Forecasts for every market — and the whole country
Nineteen new forecast pages: load, prices, wind, and solar for CAISO, PJM, MISO, ISO-NE, and SPP, plus a national US grid load page built on EIA's hourly monitor.
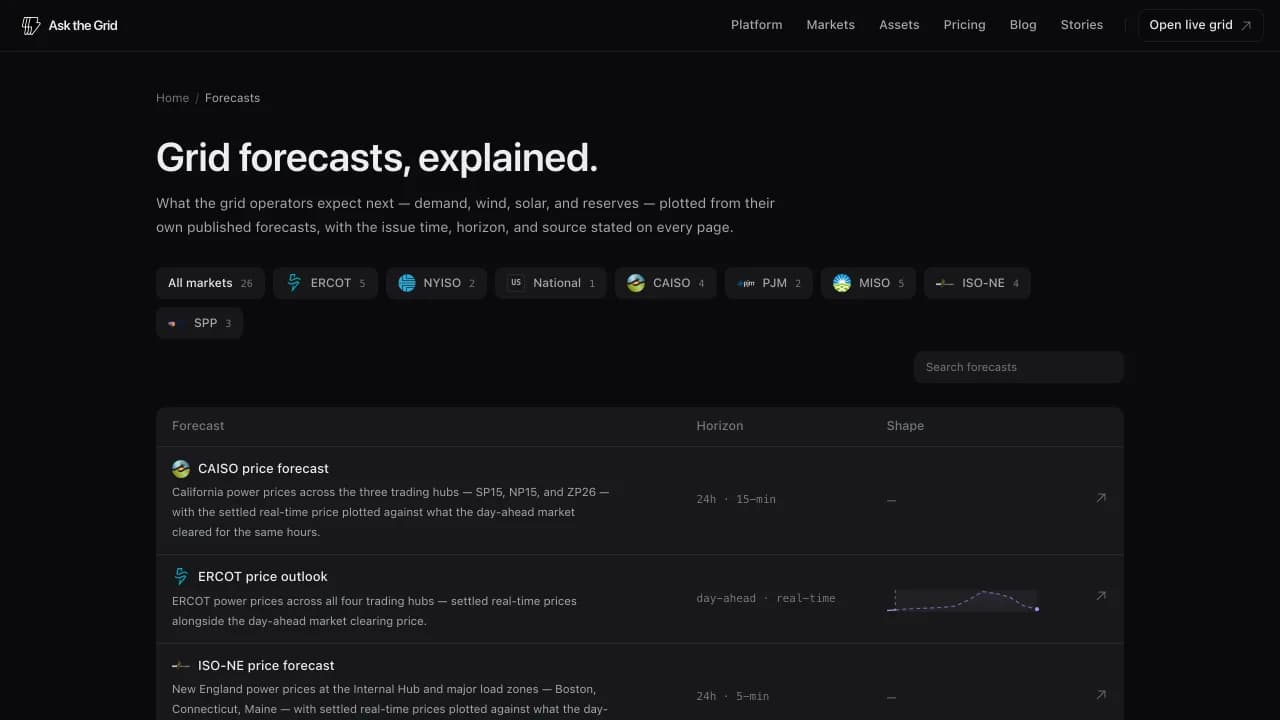
The forecast library now covers every organized US power market. Each live grid gets its operator's own published forecasts — demand with a zonal breakdown, day-ahead versus real-time prices at the trading hubs, and wind and solar output scored against delivery — on the same accuracy-scored pages ERCOT and NYISO already had.
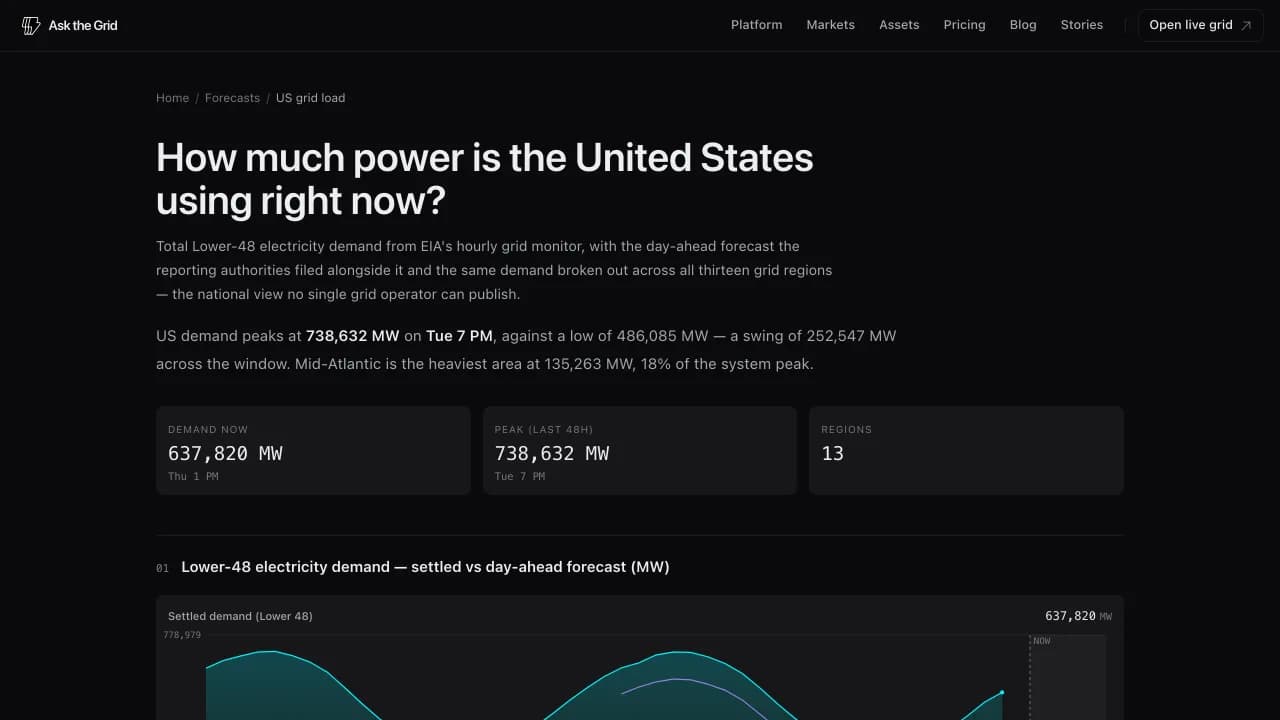
US grid load is new territory: total Lower-48 electricity demand from EIA's hourly grid monitor, with the day-ahead forecast the reporting authorities filed alongside it, the same demand split across the thirteen grid regions, and the national fuel mix rendered by the same panel the Radar cockpit uses. No single grid operator can publish this page — it takes all of them reporting into one place.
Every page states its provenance — who produces the forecast, its real horizon, and its cadence — and every time renders in the market's own time zone. The accuracy scorecards compare each forecast to what actually settled, on the vintage that was genuinely available beforehand.