
Know what moved the grid, and why.
Ask a question the way you’d say it out loud, and get an answer that shows its sources, across all 7 US power markets.
All 7 markets, on the same clock
Live · public ISO mirrors · refreshes every minute
| Market | LoadMW | Price$/MWh | As of |
|---|---|---|---|
 ERCOTTexas ERCOTTexas | loading | loading | connecting |
 CAISOCalifornia CAISOCalifornia | loading | loading | connecting |
 PJMMid-Atlantic · Midwest PJMMid-Atlantic · Midwest | loading | loading | connecting |
 NYISONew York NYISONew York | loading | loading | connecting |
 MISOCentral United States MISOCentral United States | loading | loading | connecting |
 ISO-NENew England ISO-NENew England | loading | loading | connecting |
 SPPGreat Plains SPPGreat Plains | loading | loading | connecting |
- rows of energy and infrastructure data
- 100B+
- datasets in the catalog
- 346
- map layers
- 15
From question to forecast
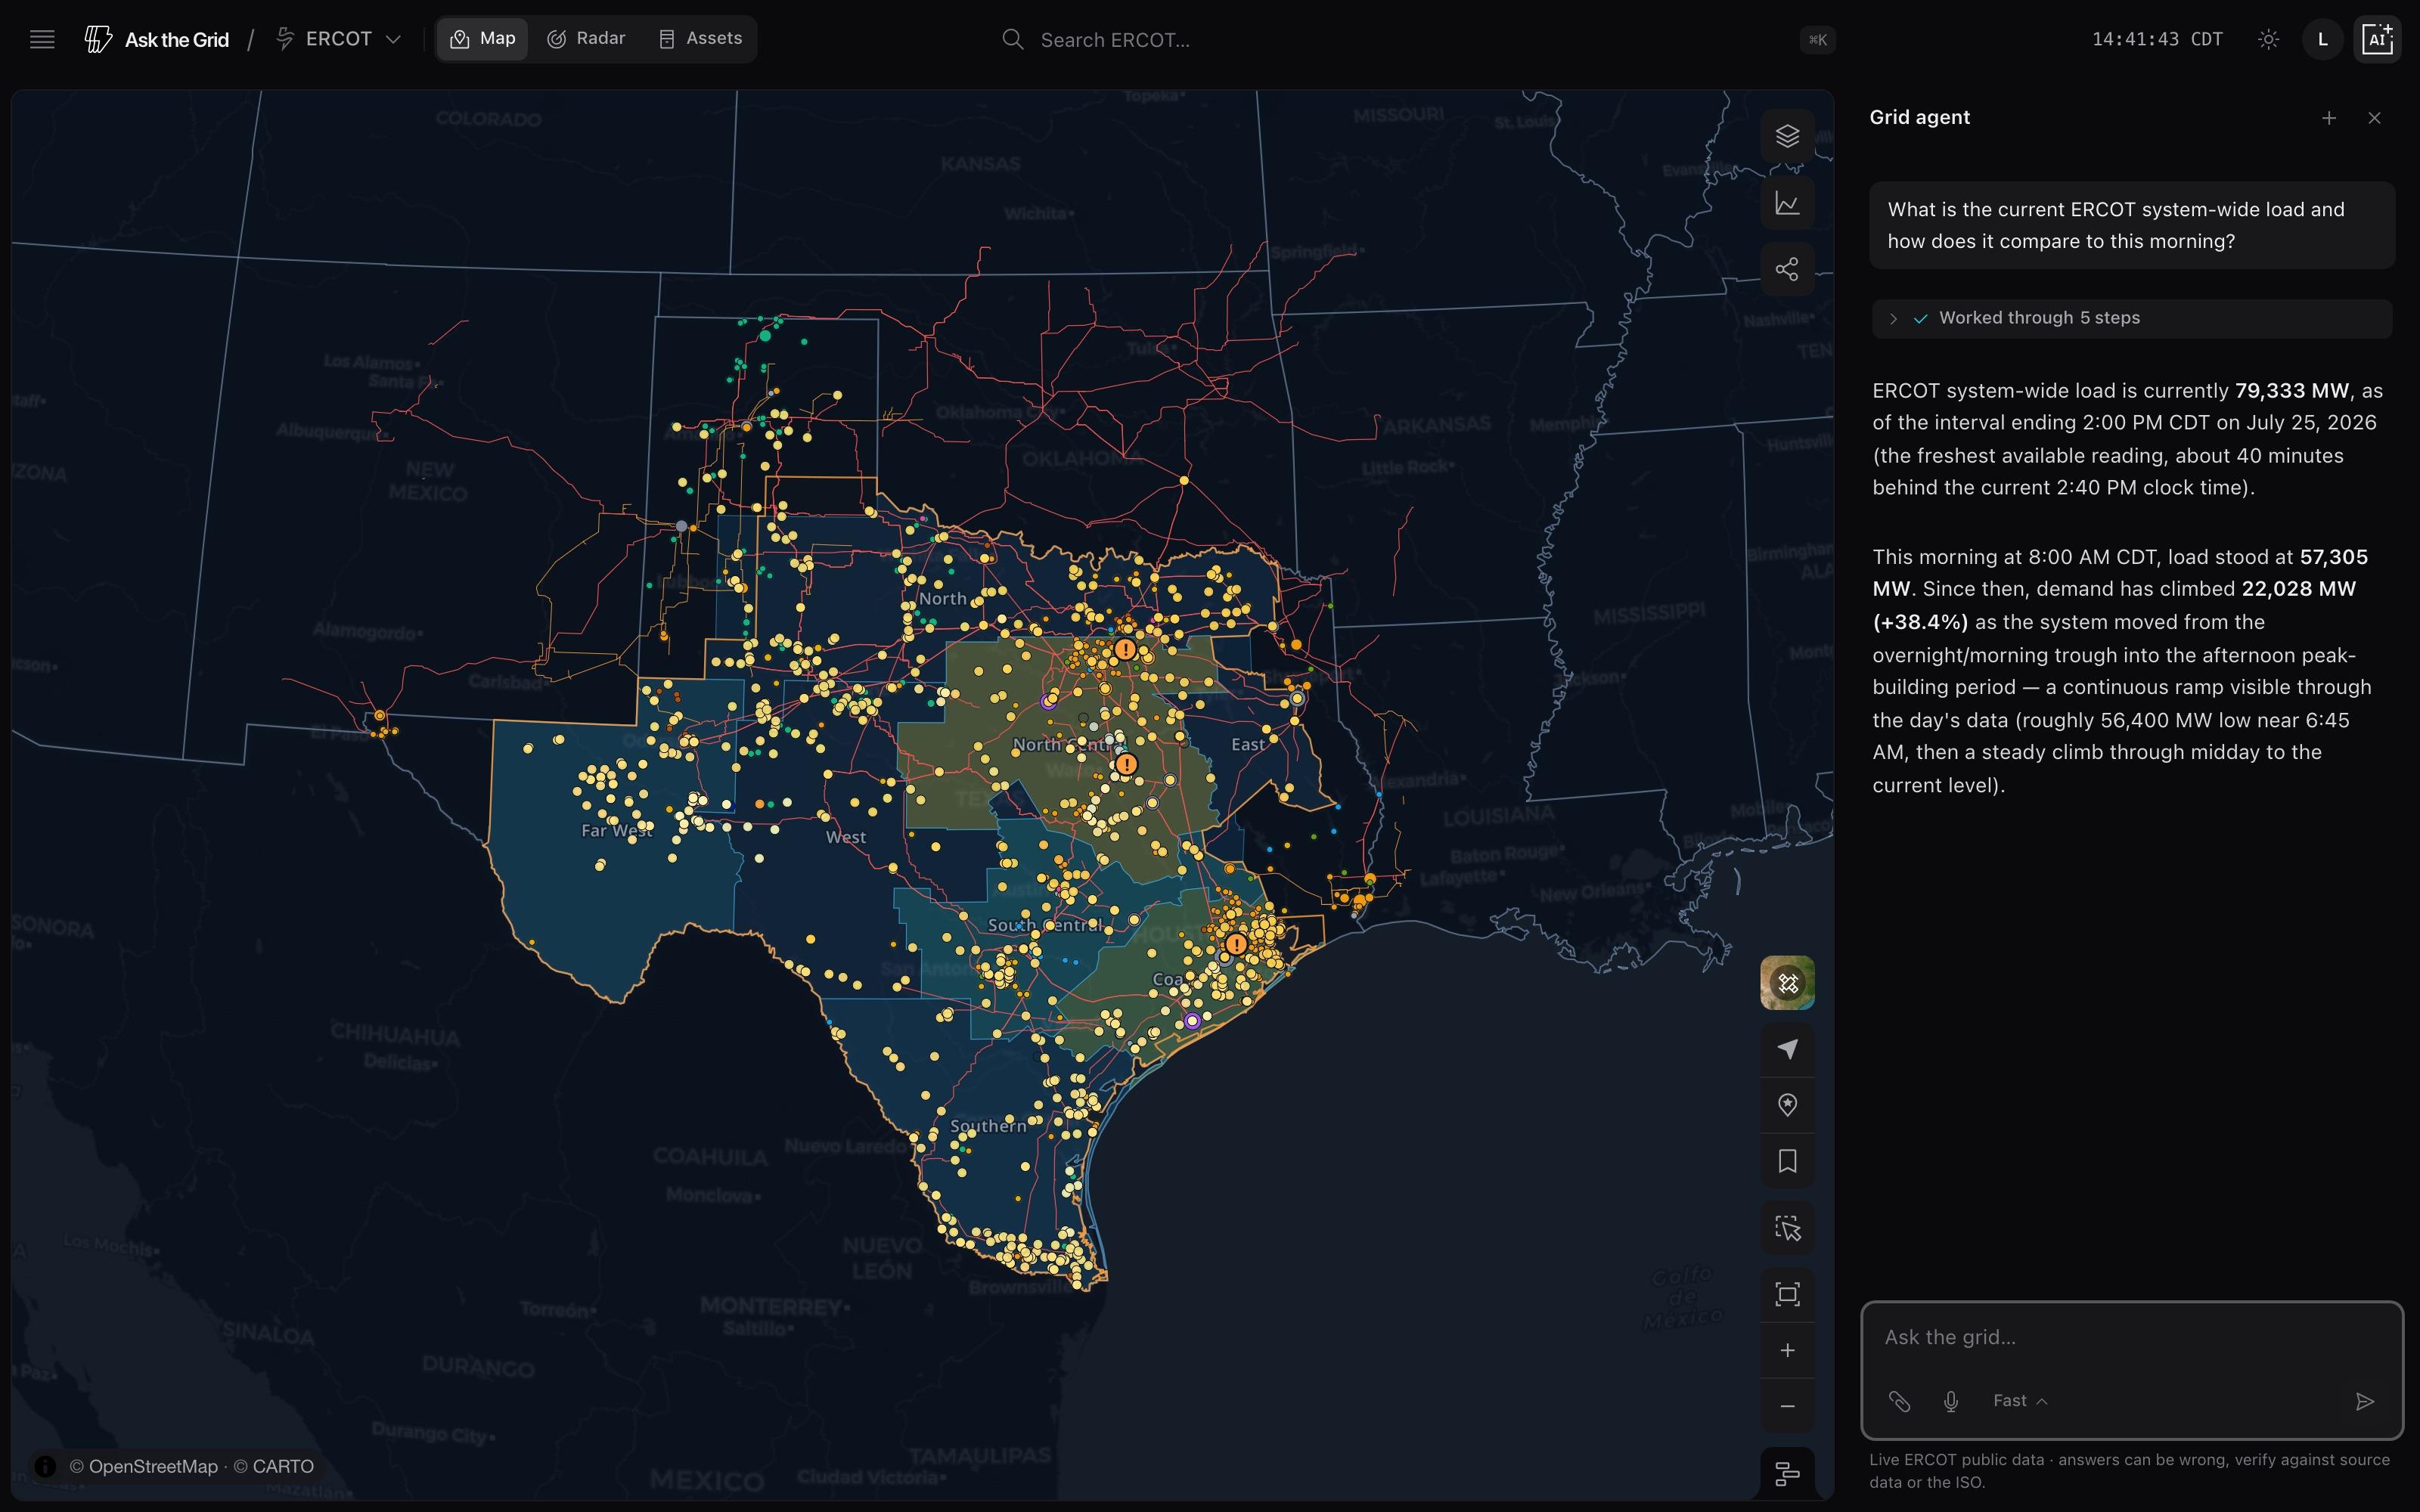
01Ask
Ask the market a question
Use your own words. The answer comes back with the dataset it used, the timestamp, and the calculation path, so you can check the work.
Meet the agent01You askliveYyouAsked the grid agent02Grid agentunder the hood
waiting for the question…
03You get—
Example trace02Locate
Find the physical cause
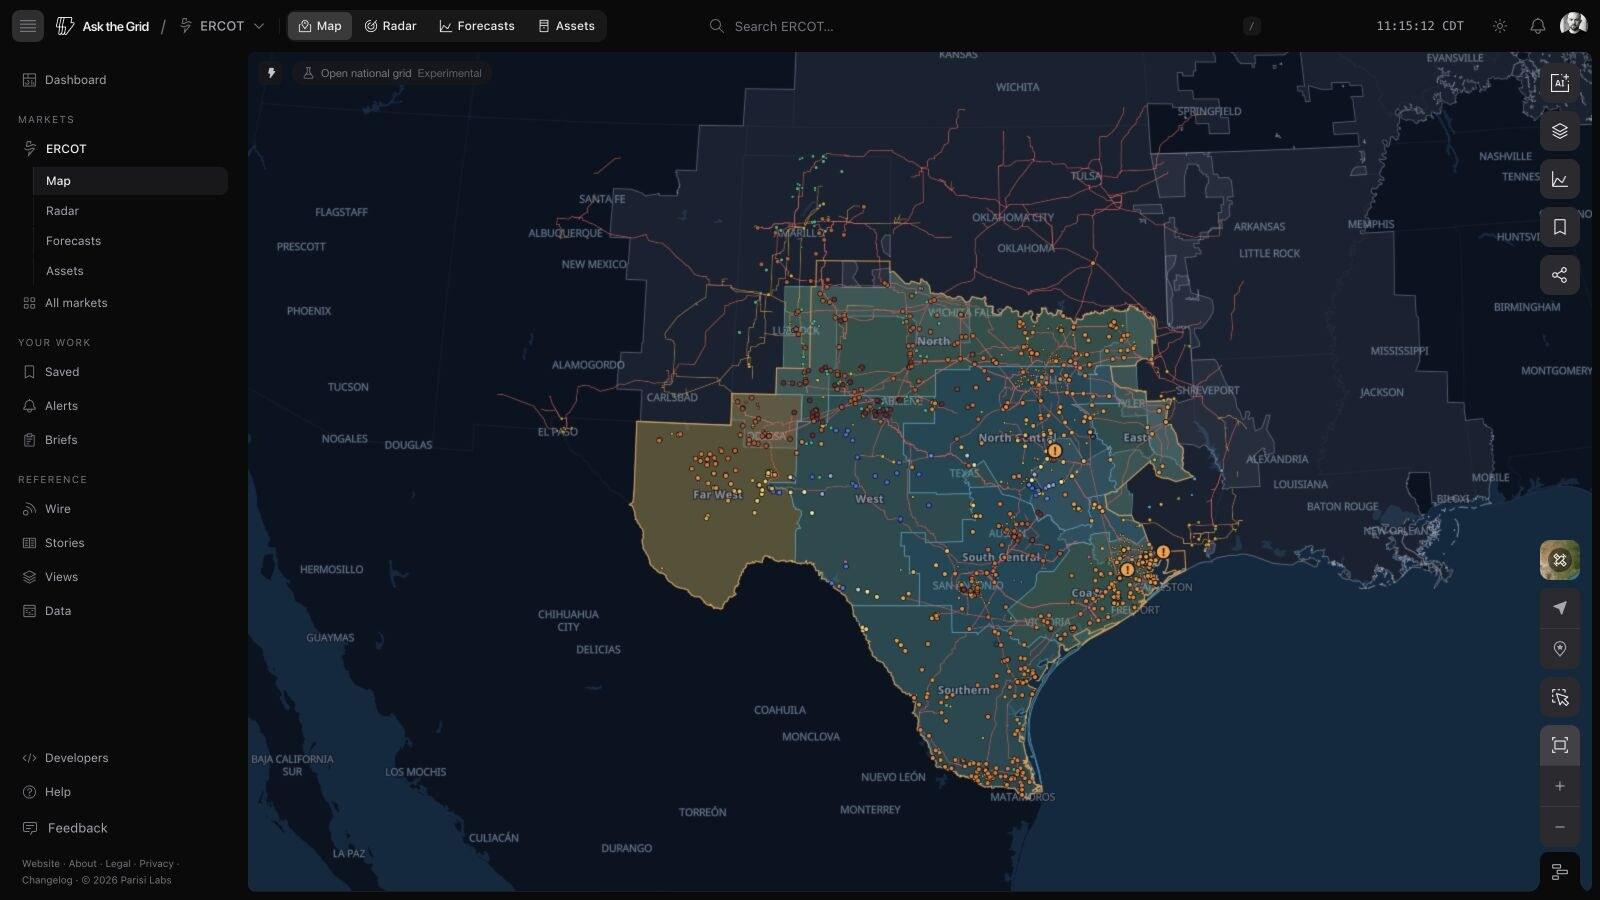
Prices, lines, outages, plants and weather sit on one map, so when two nodes price apart you can see what is standing between them.
See the live map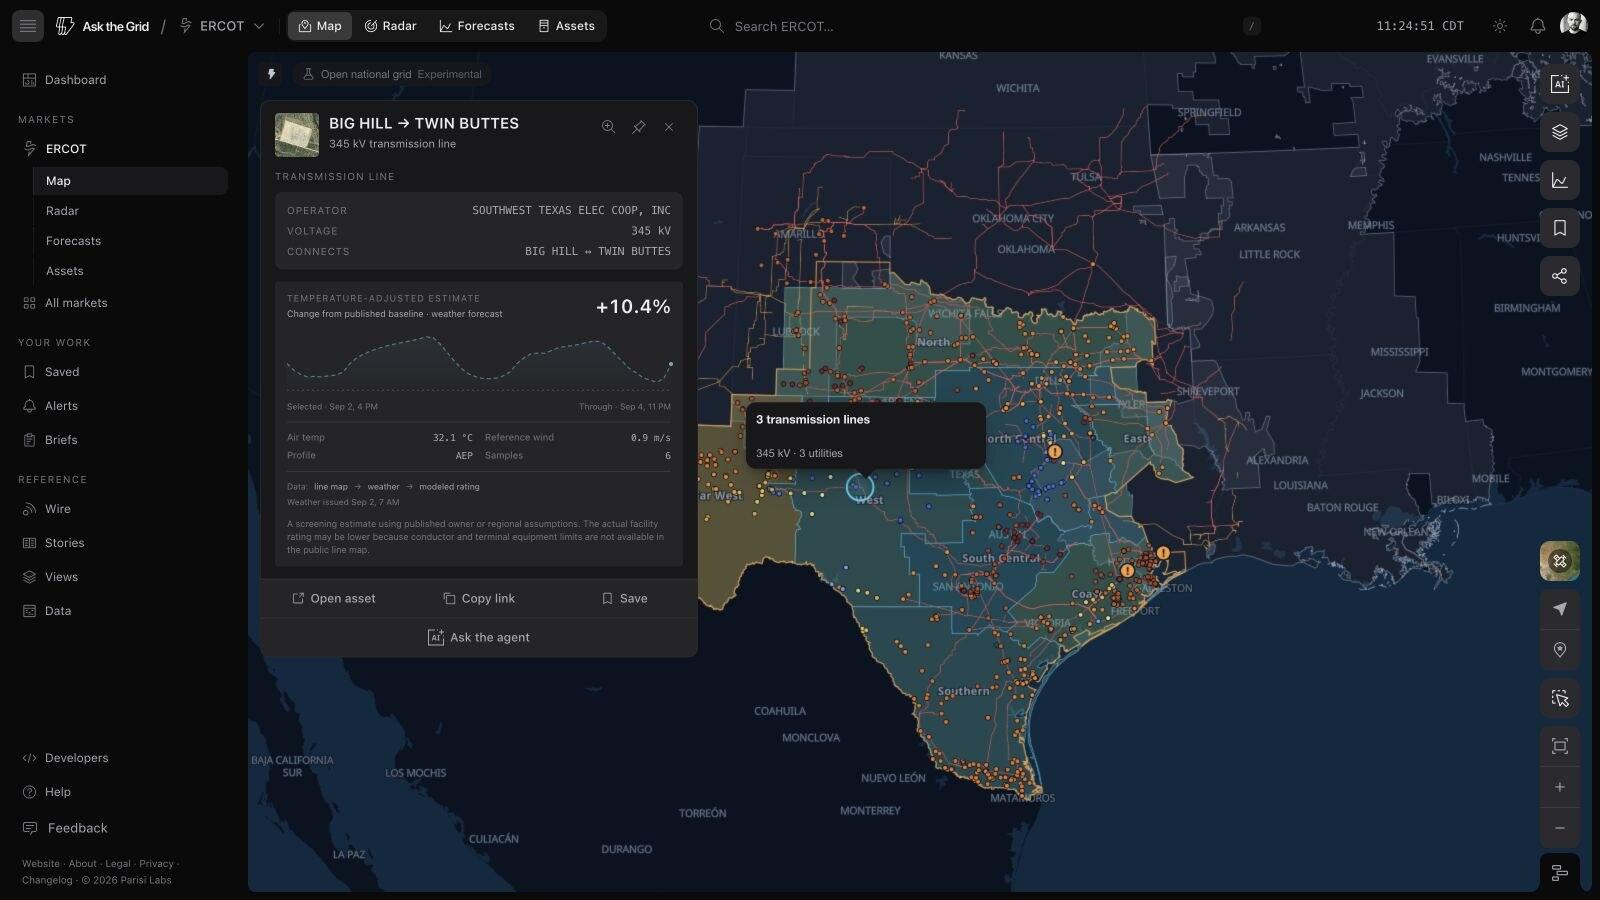
03Forecast
See where it points next
Actuals and forecasts sit on the same timeline, so the move you just explained lines up against what the market expects tomorrow.
Browse the forecasts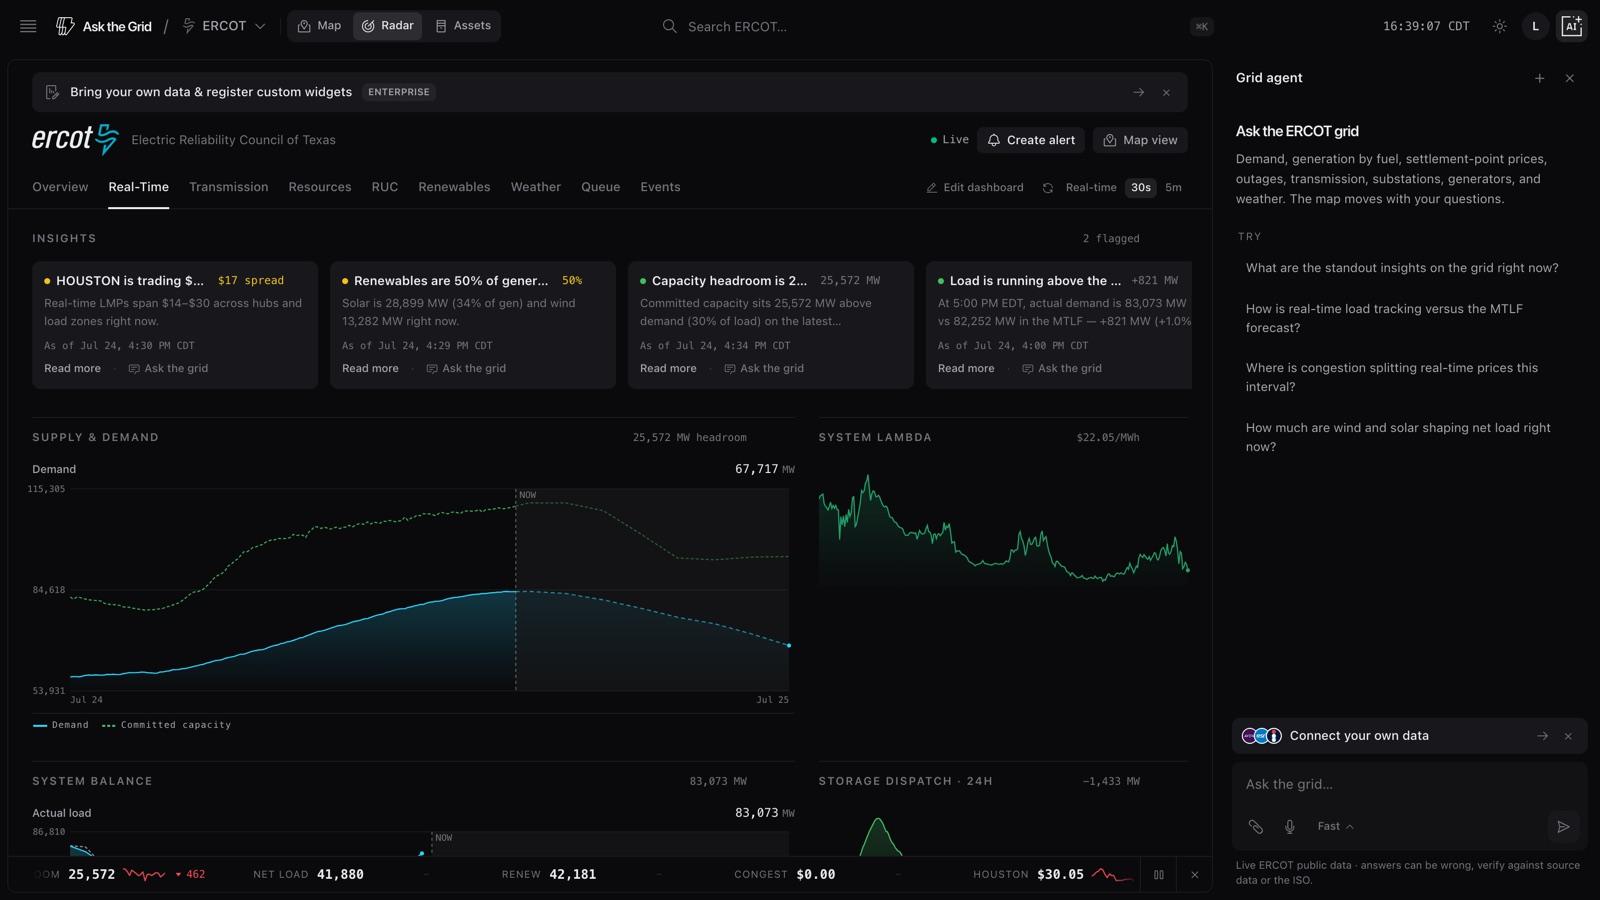
Built for traders, operators, and asset owners.
For trading desks
See what is driving the price, right now.Where is real-time congestion building?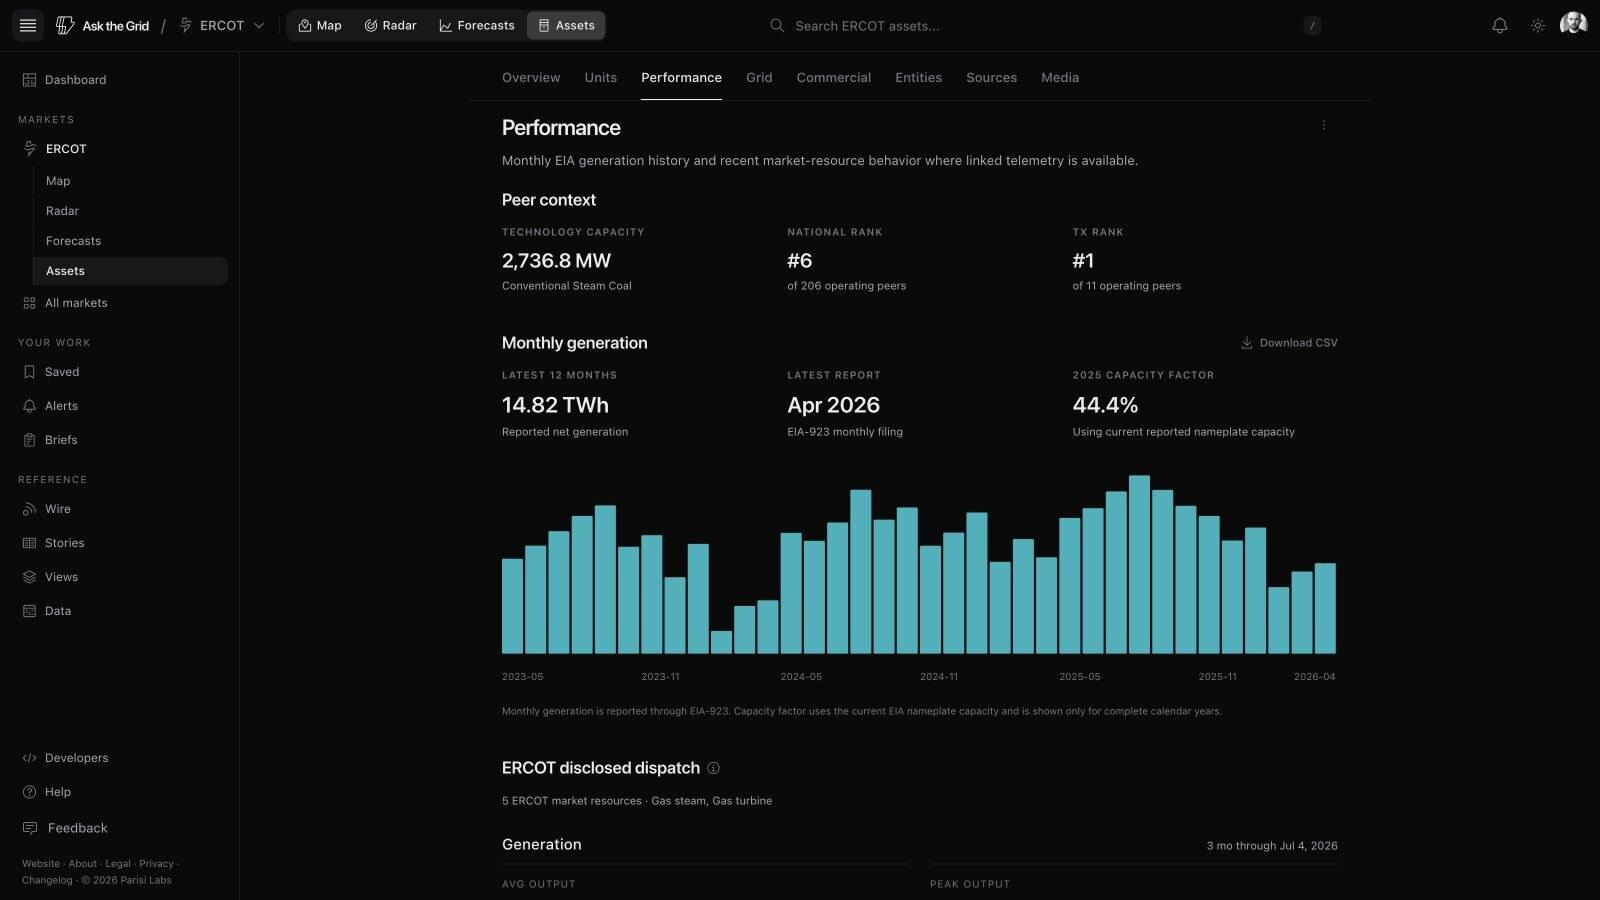
For asset owners
See your plant inside the market it sells into.What market condition is driving this dispatch?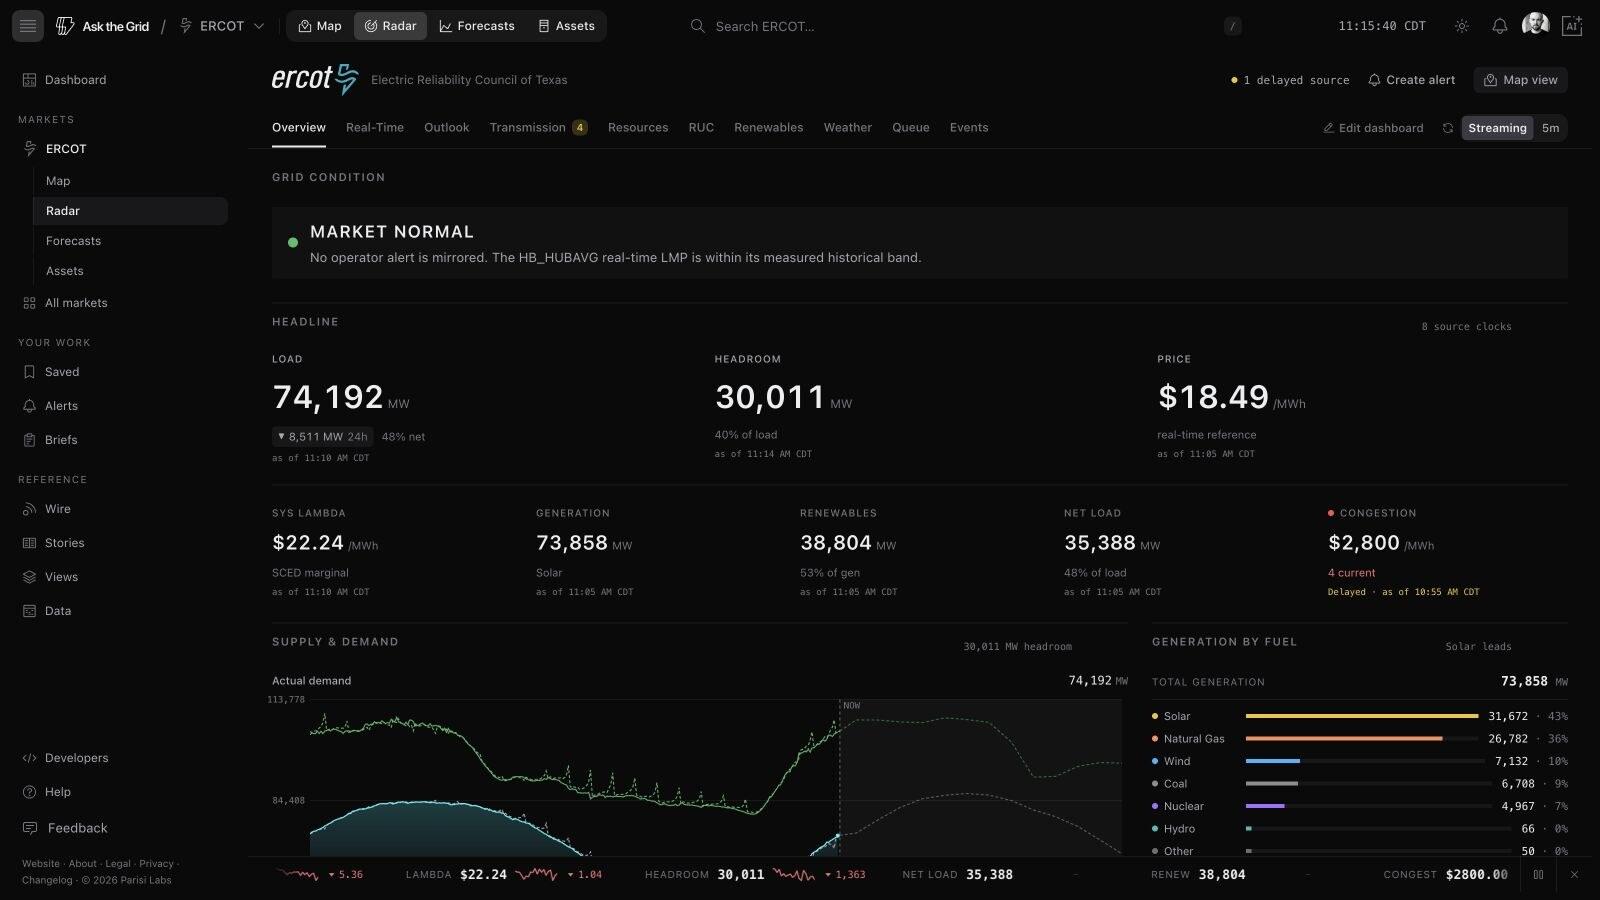
For utilities, ISOs & RTOs
See where the system is tight before the next interval.Where is regional reliability margin tightening now?Asset database
Find your plant
Every plant, substation and node on the grid has its own page.

The market is already moving.
Browsing is free, and a workspace saves what you find. No card.