Preset live views of the grid.
Curated, useful map configurations — a scene, an explanation, the underlying data, and a direct handoff into that exact live workspace.
Prices
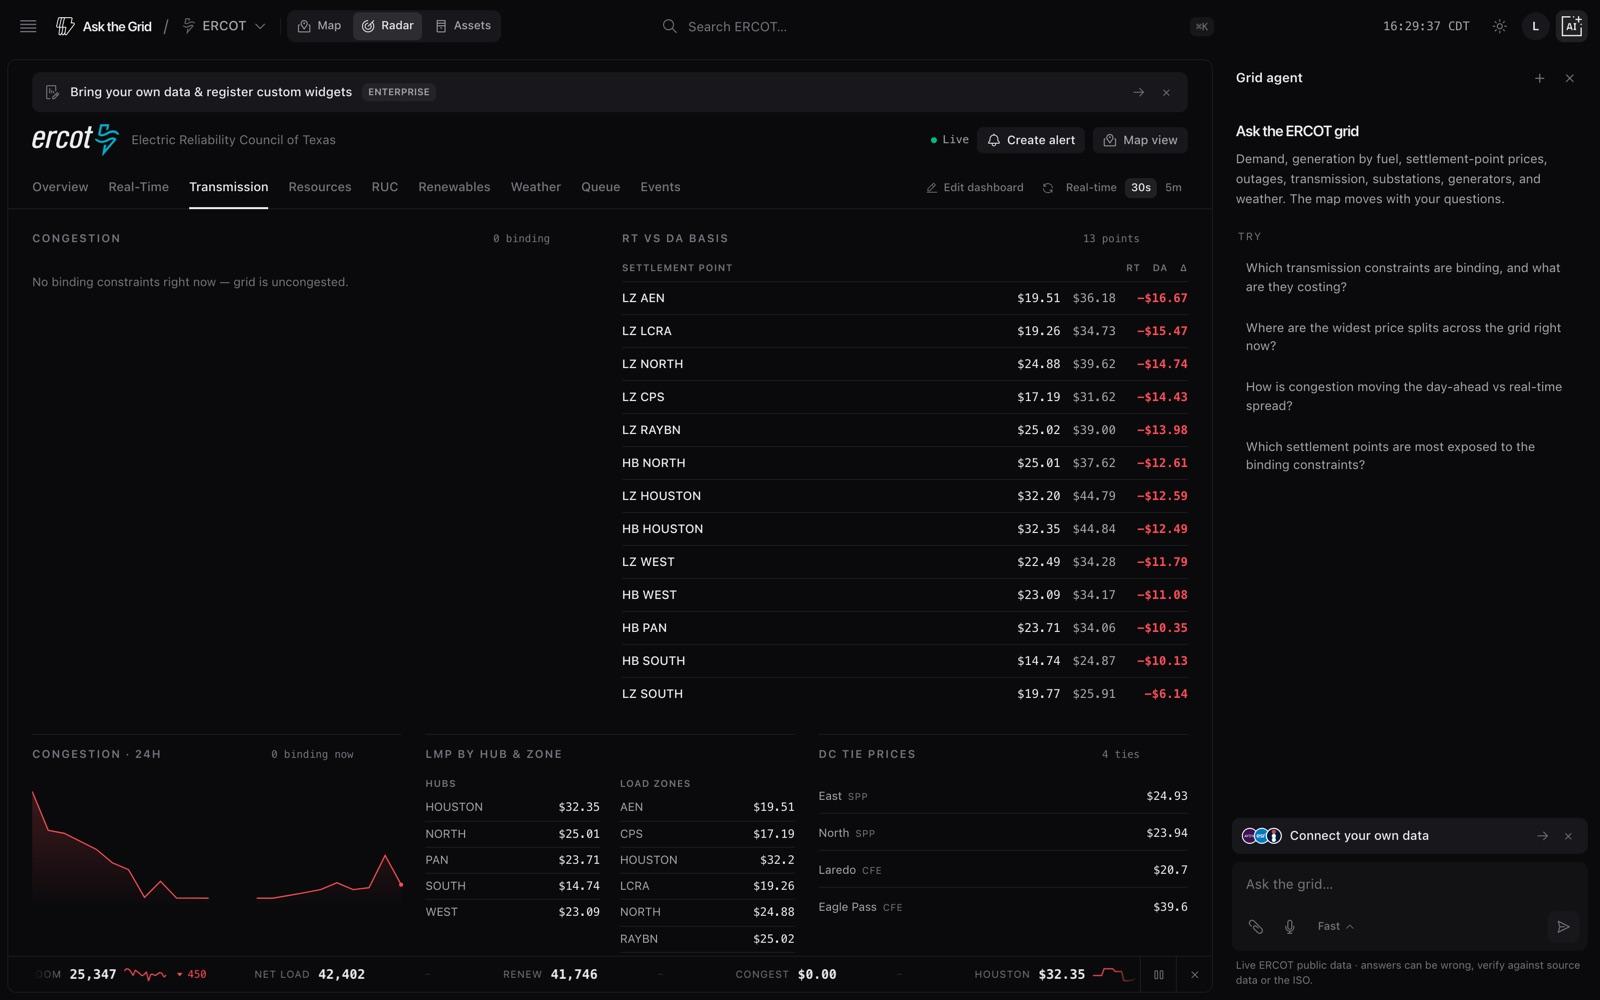
ERCOT real-time LMP
Live ERCOT real-time locational marginal prices by settlement point — the same 5-minute SCED price feed the interactive map colors nodes with, ranked in a table from highest to lowest.
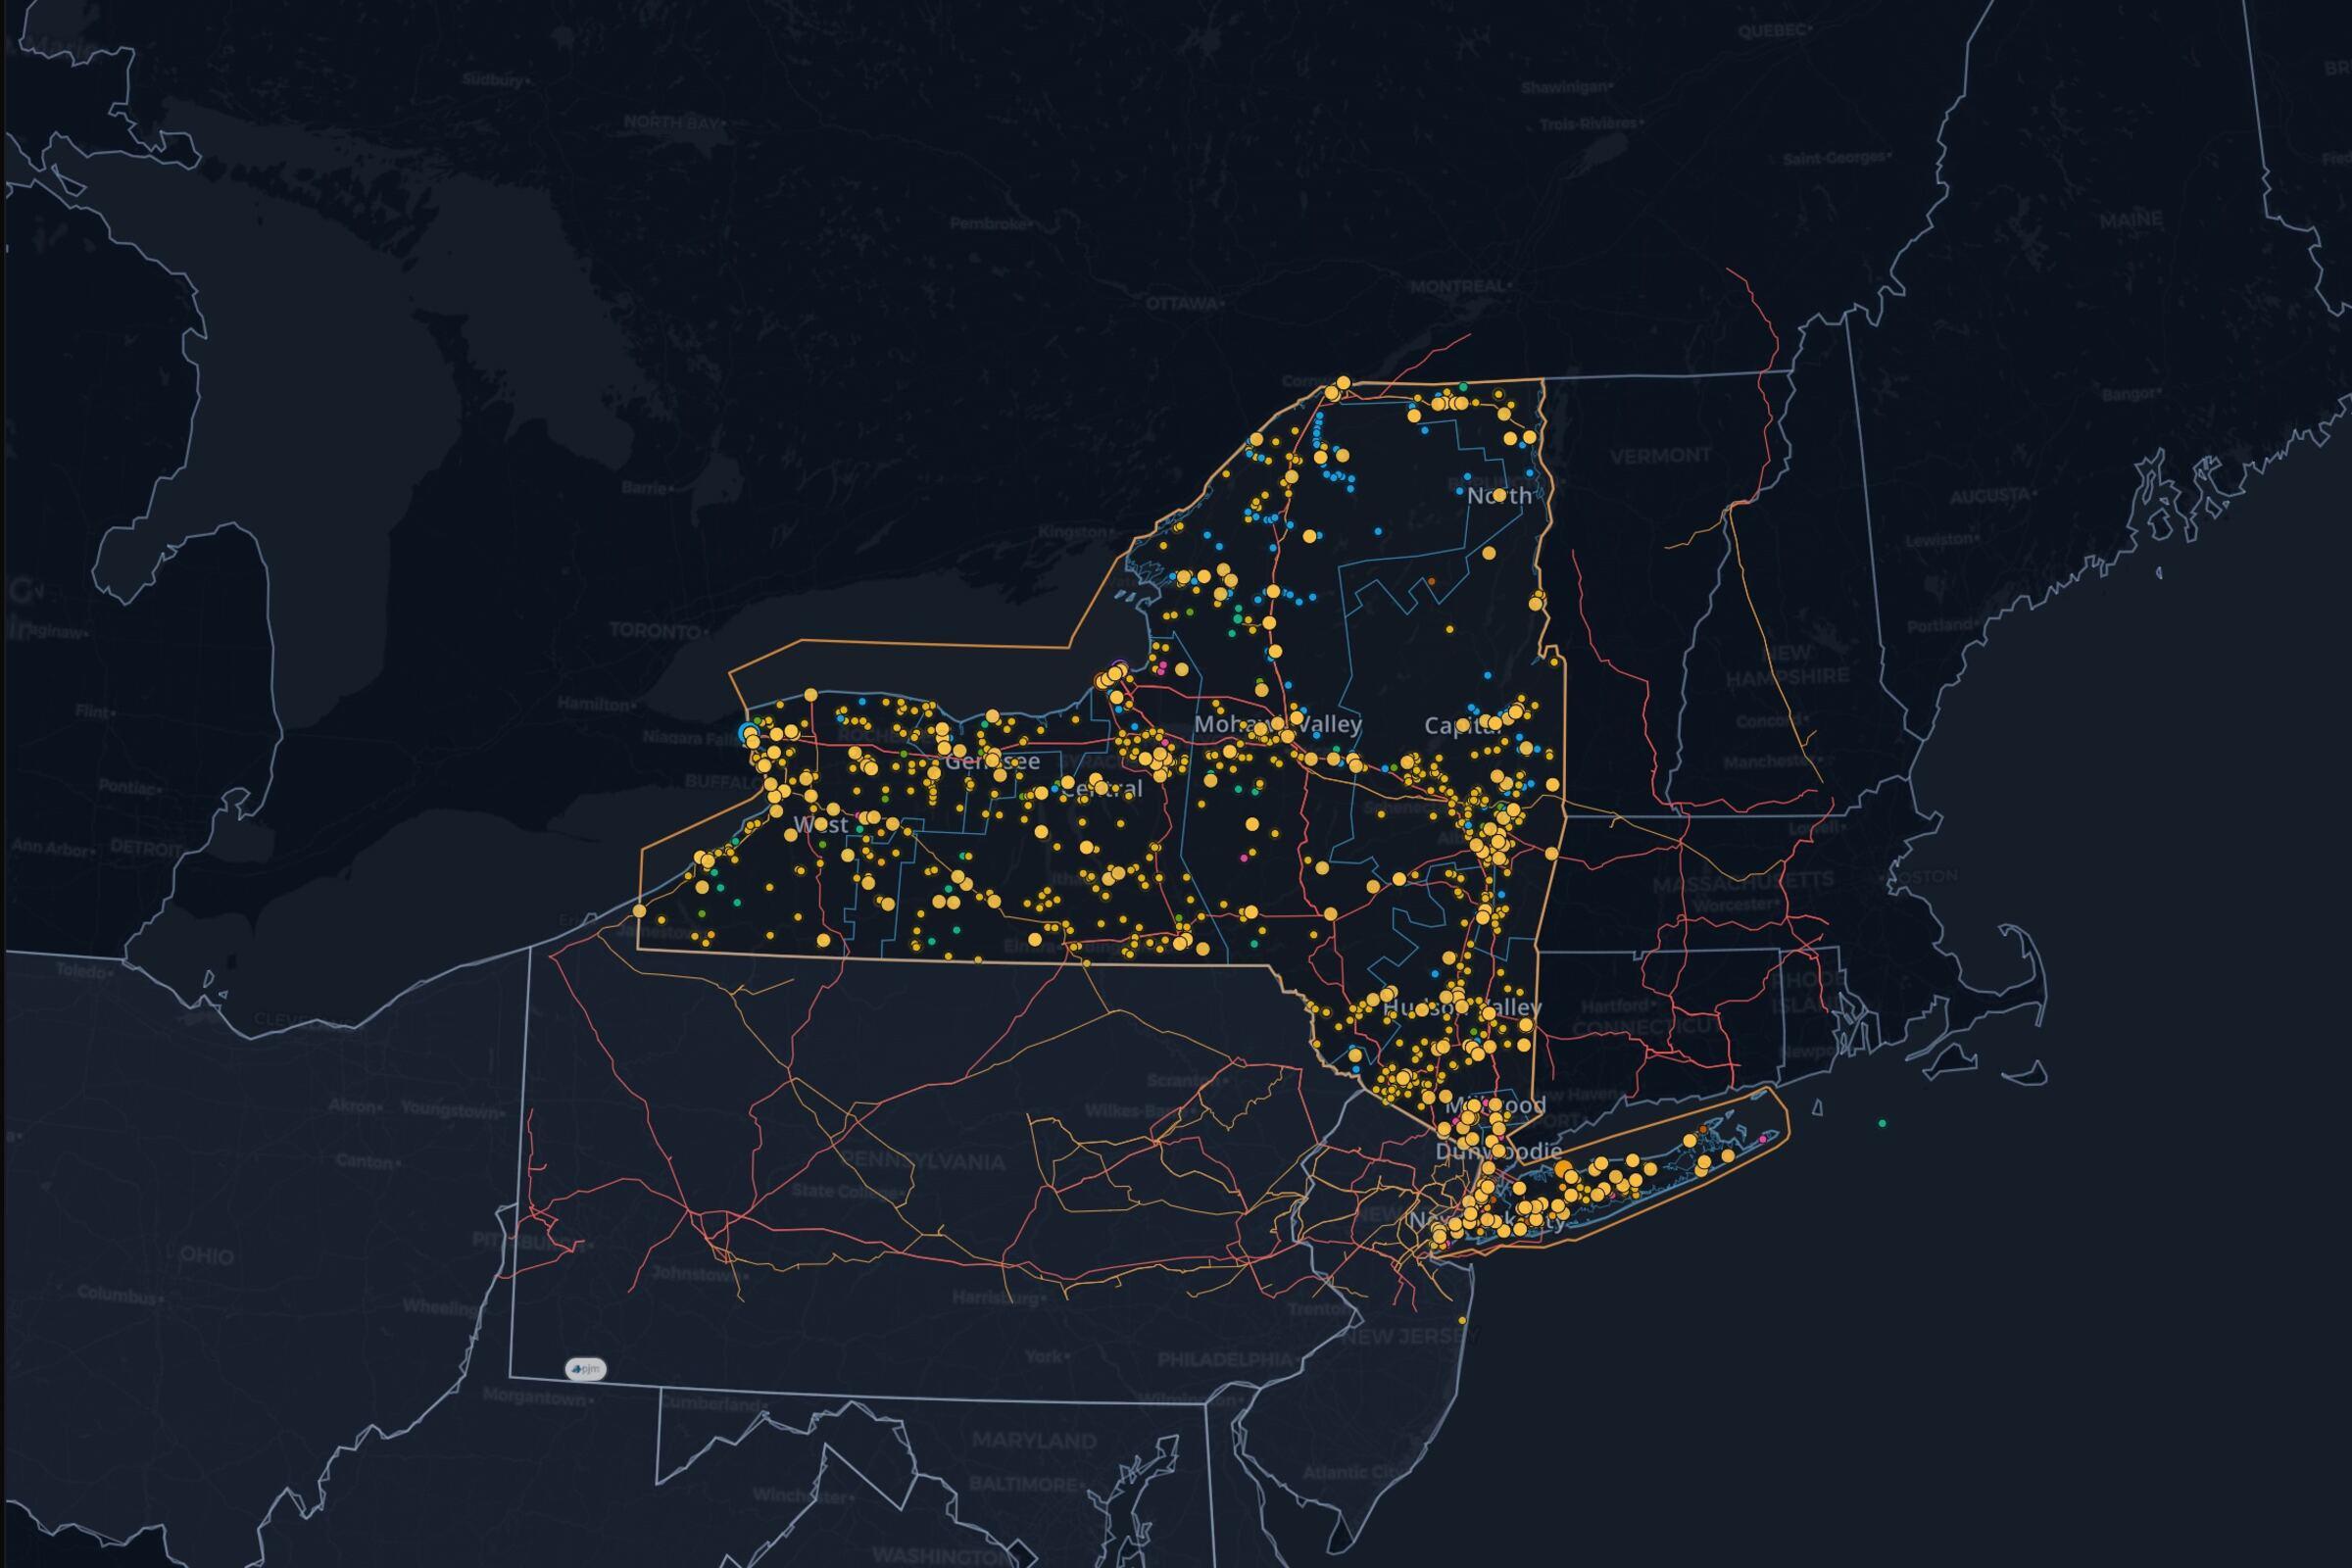
NYISO real-time LMP
Live NYISO real-time locational marginal prices at generator and load-zone buses — the same 5-minute Real-Time Dispatch feed the interactive map colors nodes with, ranked in a table.
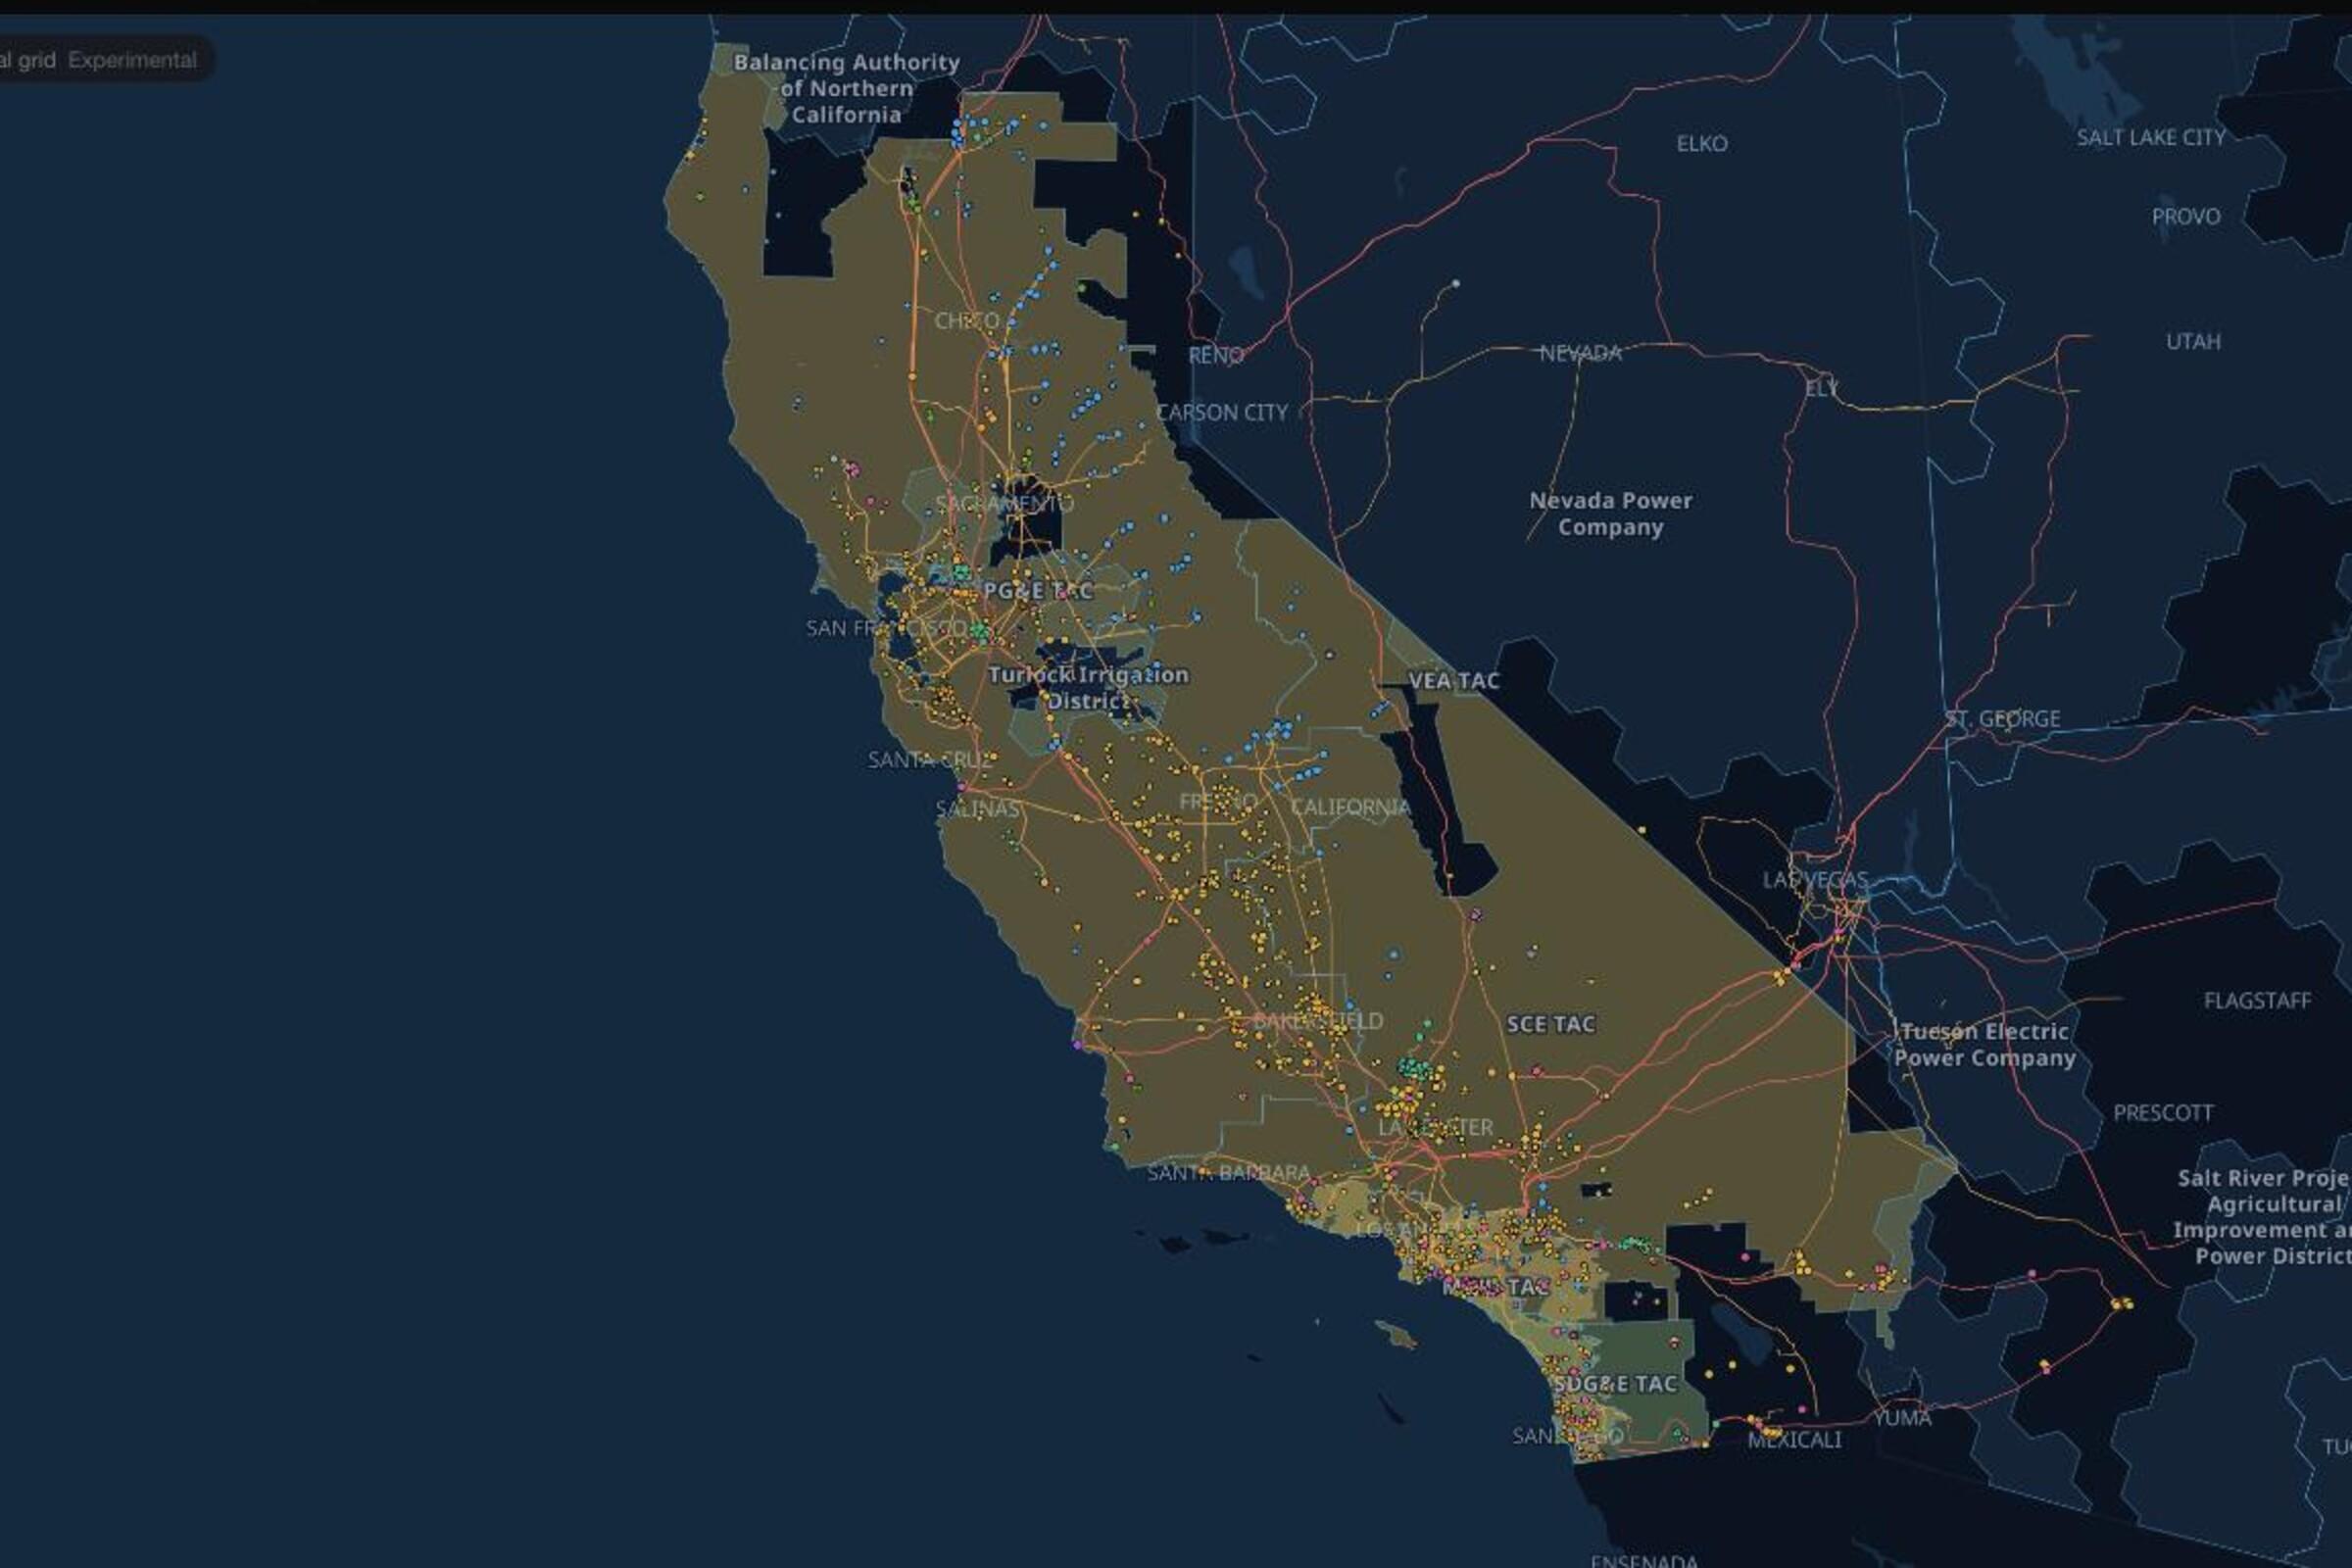
CAISO real-time LMP
Live CAISO real-time pricing-node LMPs from the 15-minute Real-Time Pre-Dispatch (RTPD) market — the same feed the interactive map colors nodes with, ranked in a table.
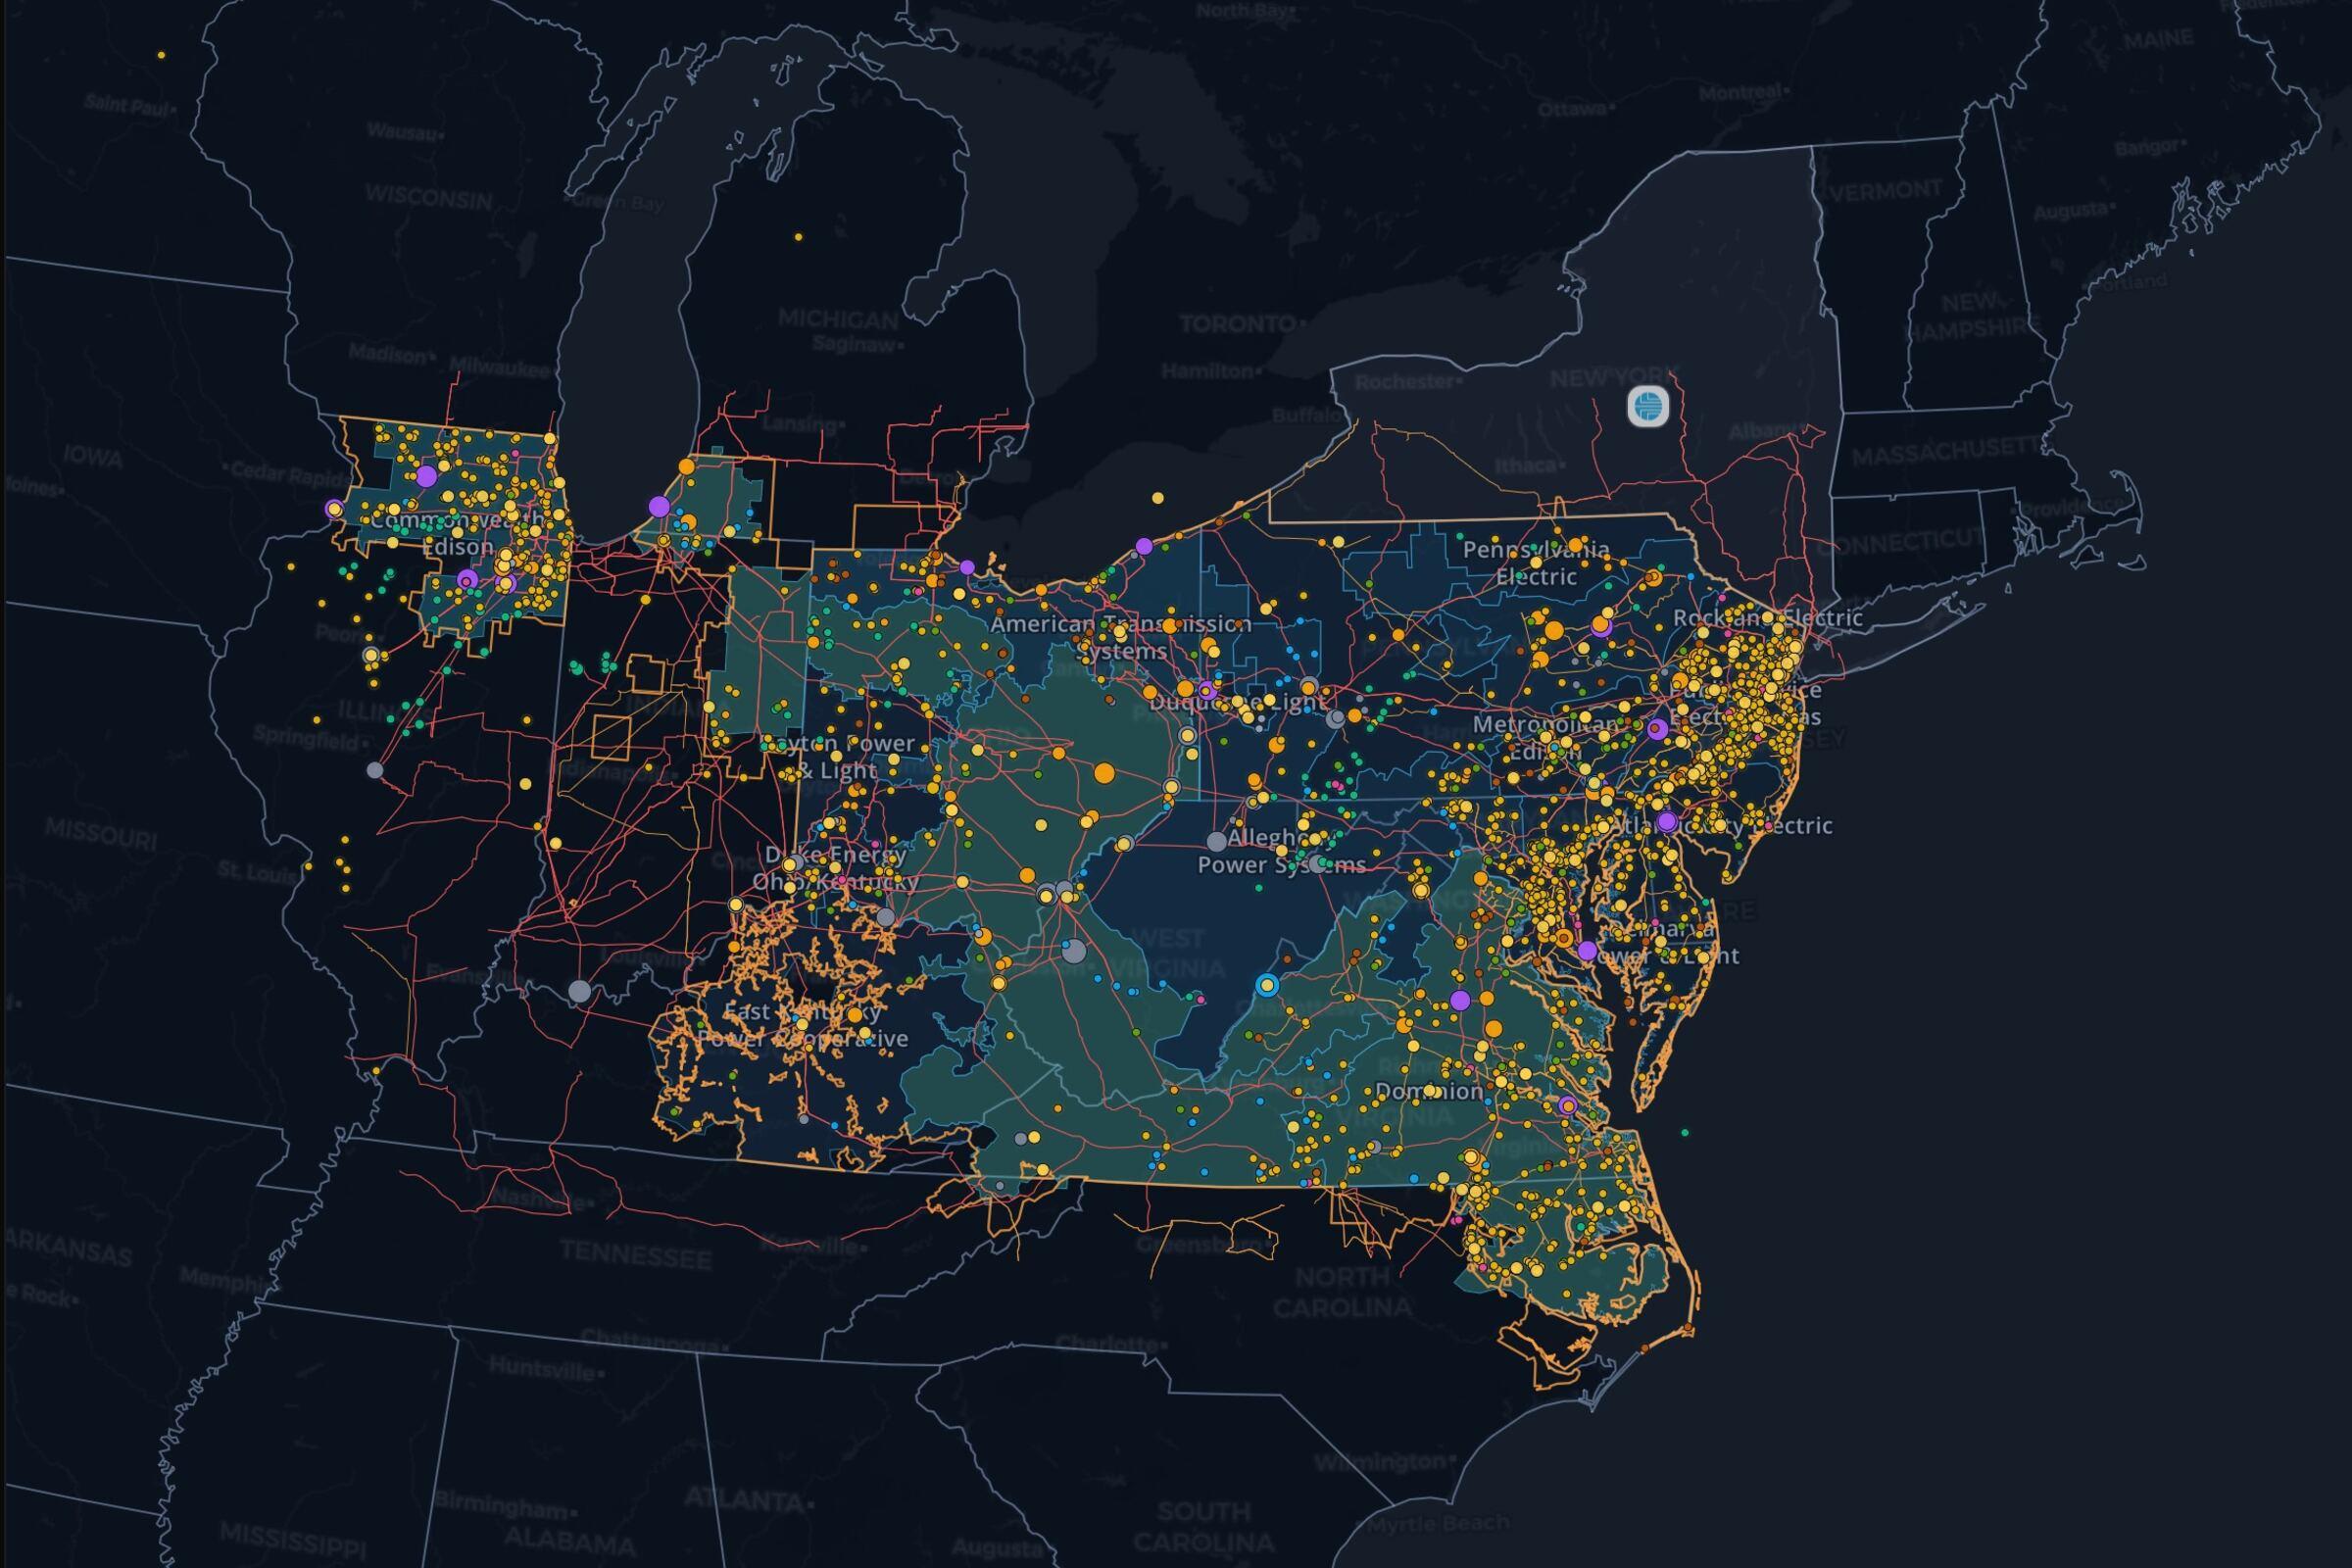
PJM real-time LMP
Live PJM real-time pricing-node LMPs from the 5-minute unverified real-time feed — the same feed the interactive map colors nodes with, ranked in a table.
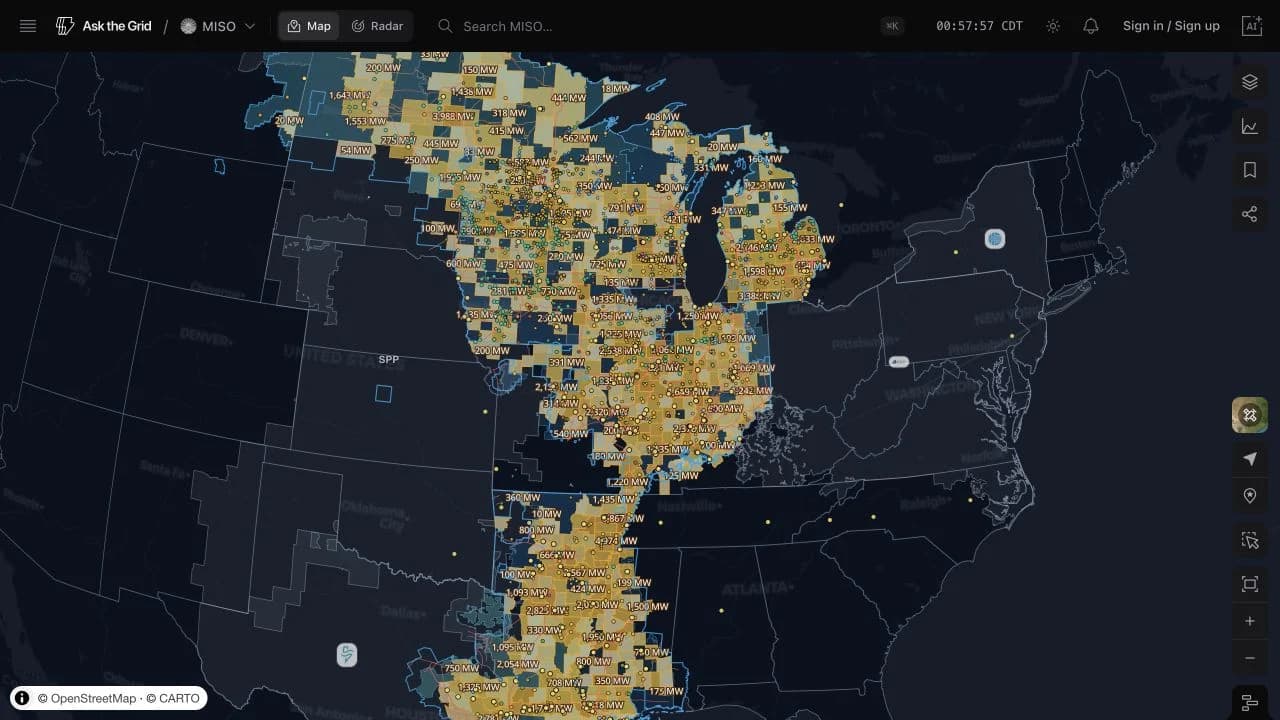
MISO real-time LMP
Live MISO real-time locational marginal prices across the 15-state footprint — the same 5-minute LMP feed behind a MISO price contour map, ranked node by node in a table.
SPP real-time LMP
Live SPP real-time locational marginal prices across the 14-state Southwest Power Pool footprint — the Integrated Marketplace's 5-minute LMP feed, ranked node by node in a table.
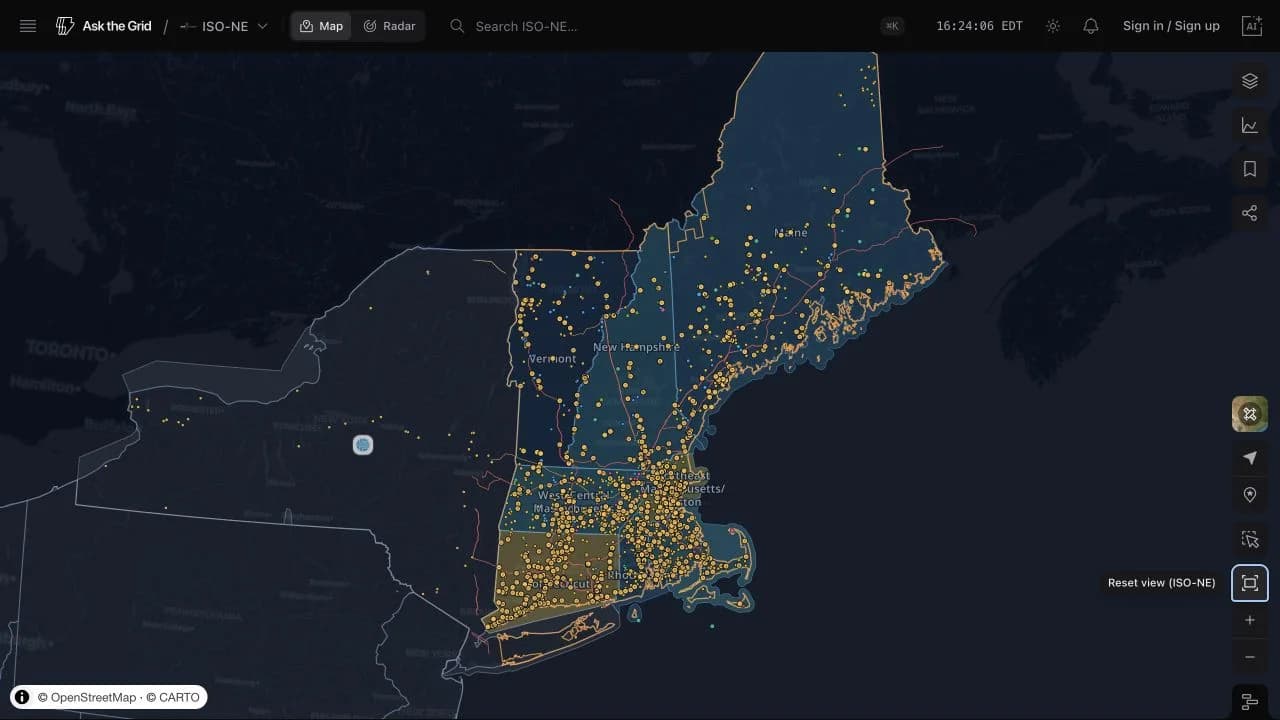
ISO-NE real-time LMP
Live ISO New England real-time locational marginal prices across the six-state grid — the ISO's 5-minute LMP at load zones, the Internal Hub, and generator nodes, ranked in a table.
Interconnection queues
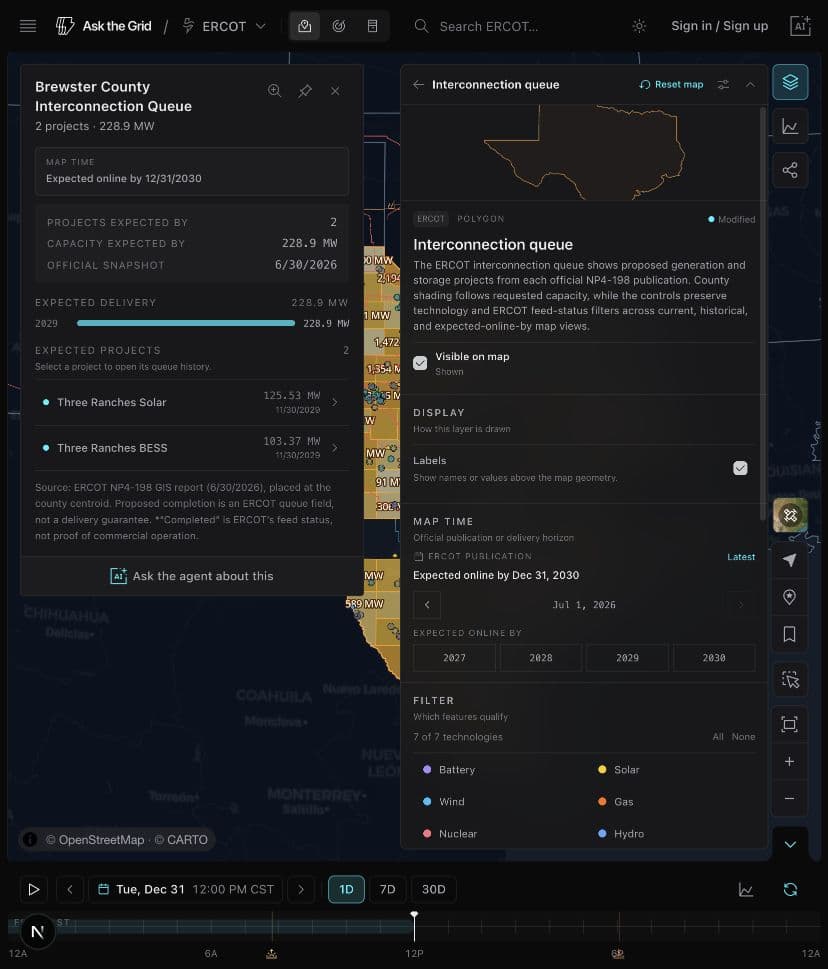
ERCOT interconnection queue
Live ERCOT interconnection queue on a county map: requested capacity by technology, project status, and proposed completion dates from ERCOT's official NP4-198 publication.
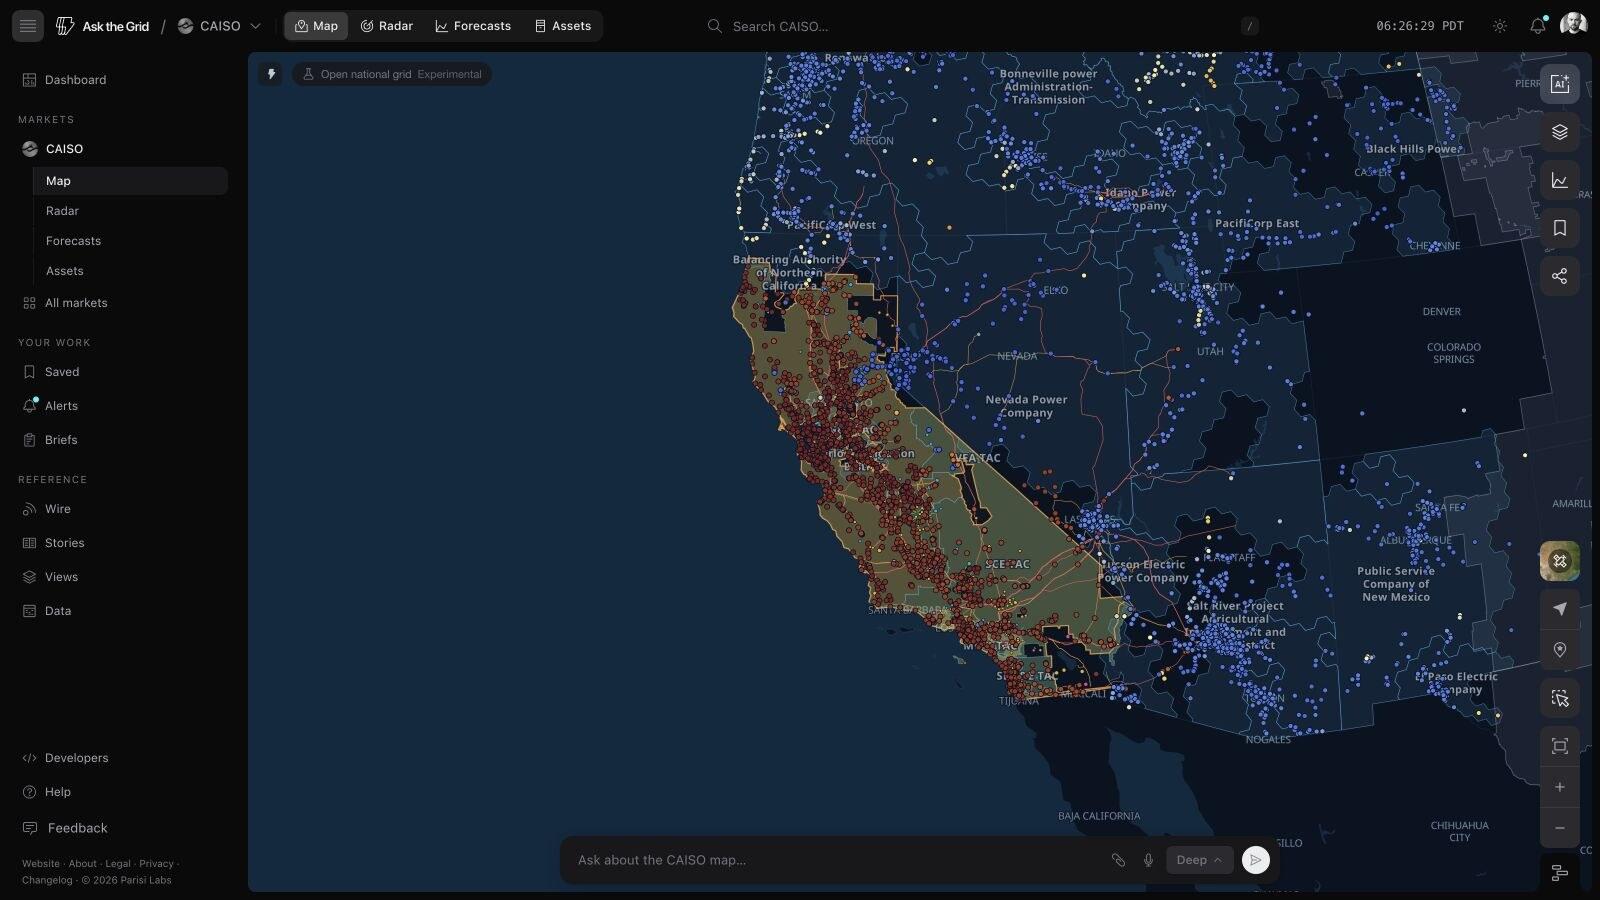
CAISO interconnection queue
CAISO's generator interconnection queue on a live California map: requested capacity by technology, project status, and proposed completion dates from the ISO's official Public Queue Report.
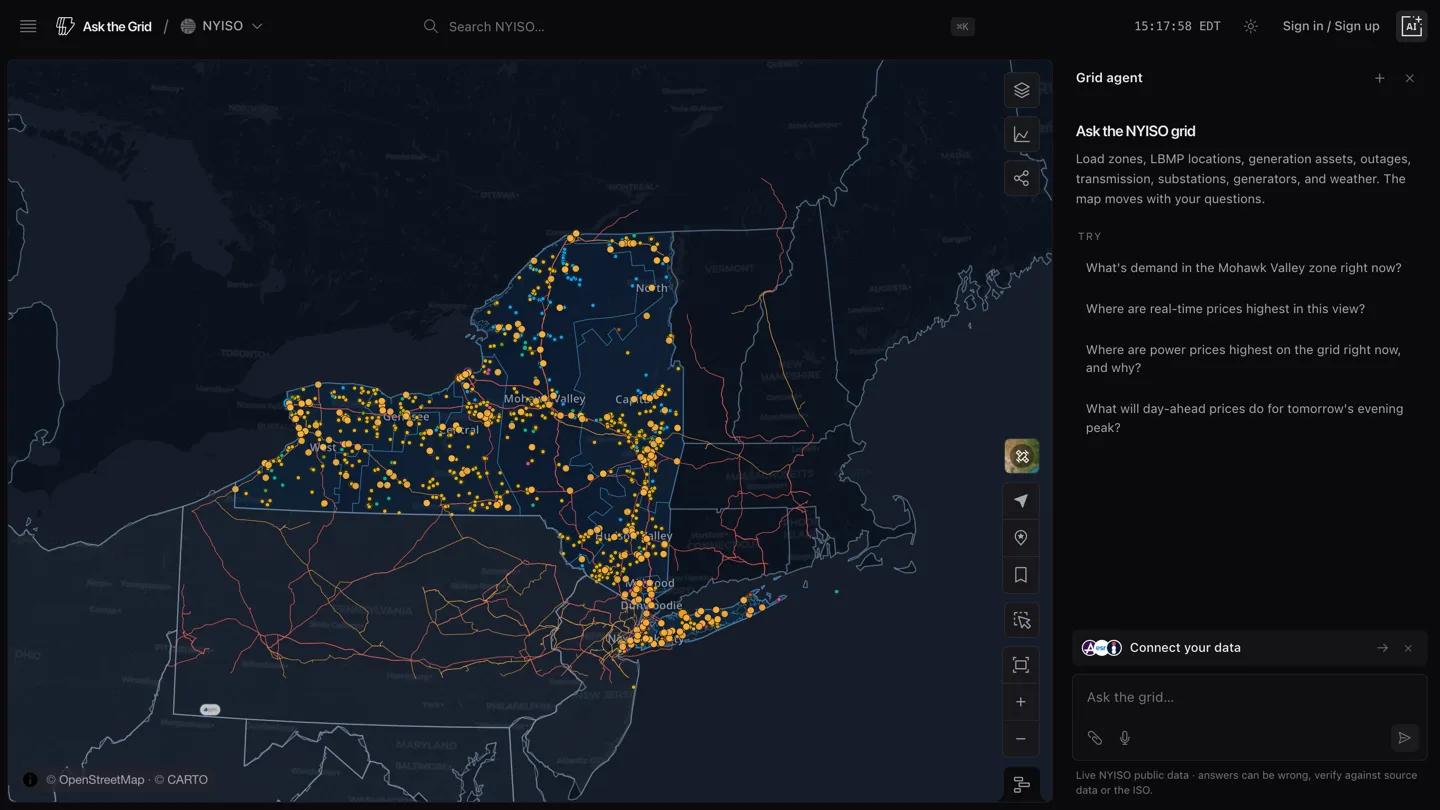
NYISO interconnection queue
NYISO's interconnection queue on a live New York map: requested capacity by technology, project status, and proposed completion dates from the ISO's official published queue.
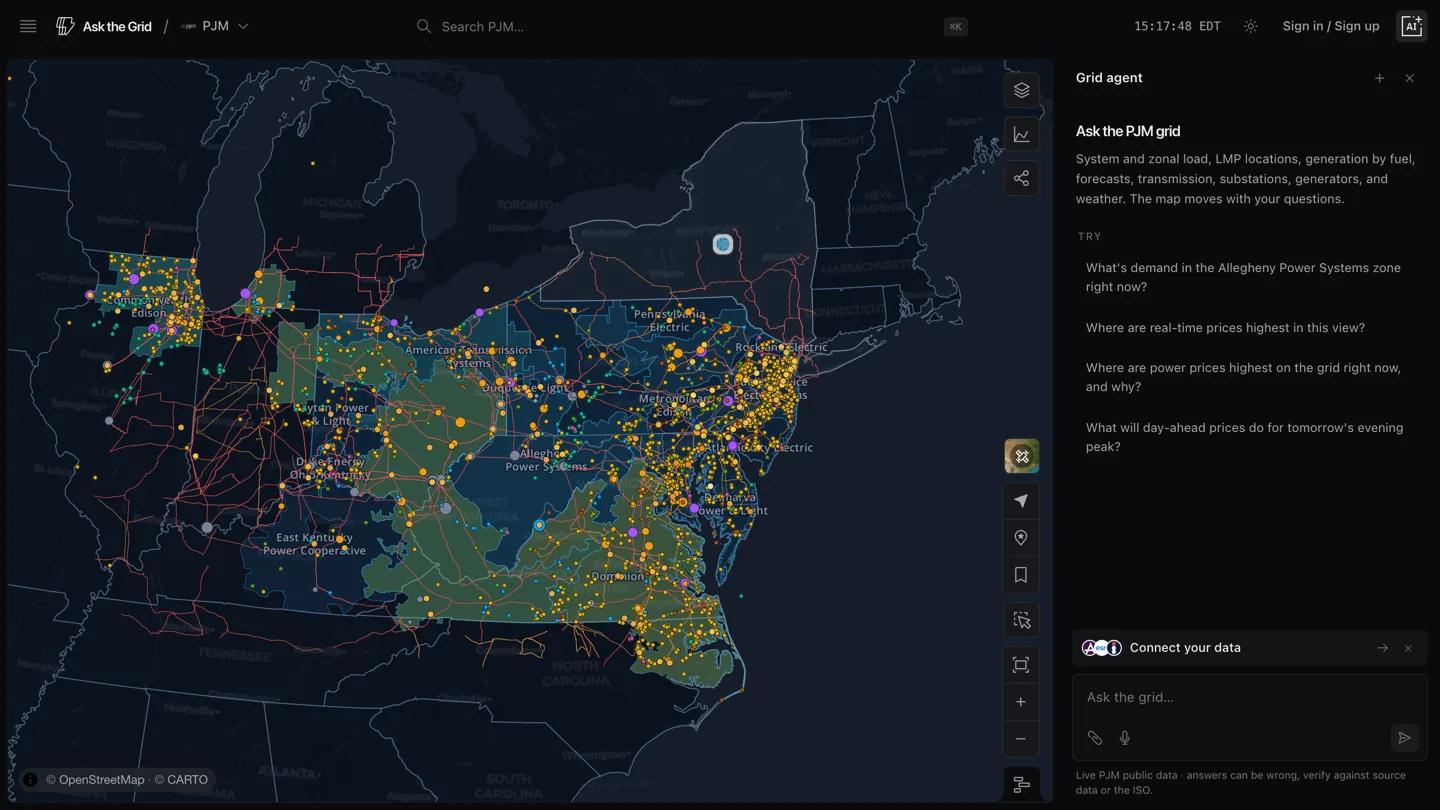
PJM interconnection queue
PJM's new services queue on a live map of the 13-state PJM footprint: requested capacity by technology, project status, and proposed completion dates from PJM's official queue publication.
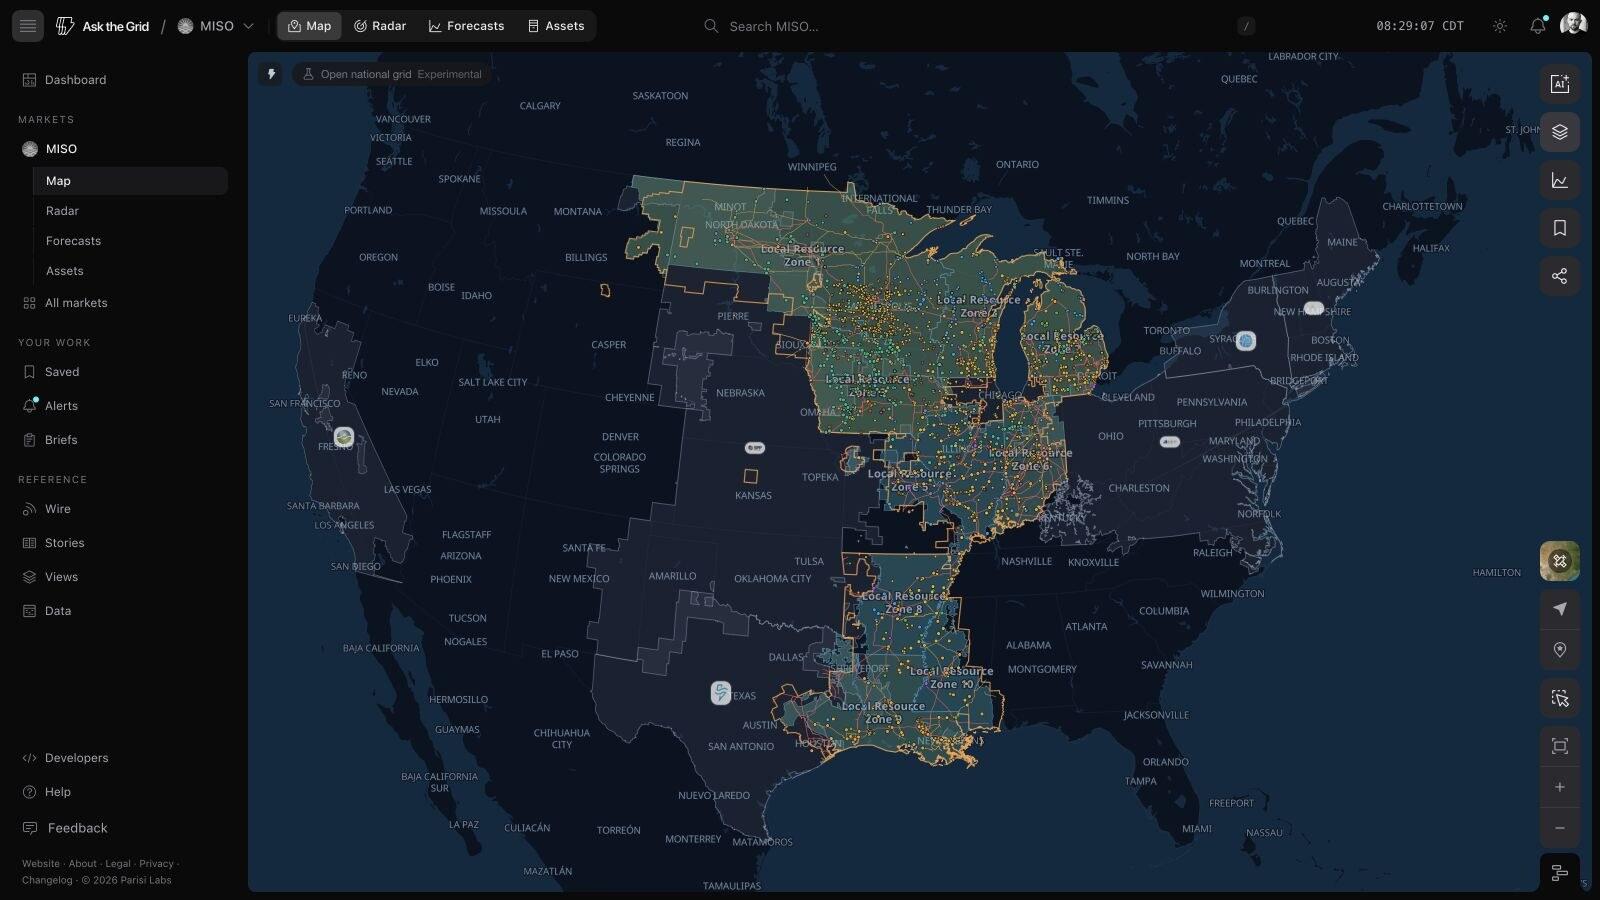
MISO interconnection queue
MISO's generator interconnection queue on a live map of the 15-state footprint: requested capacity by technology, project status, and proposed completion dates from MISO's official GI queue.
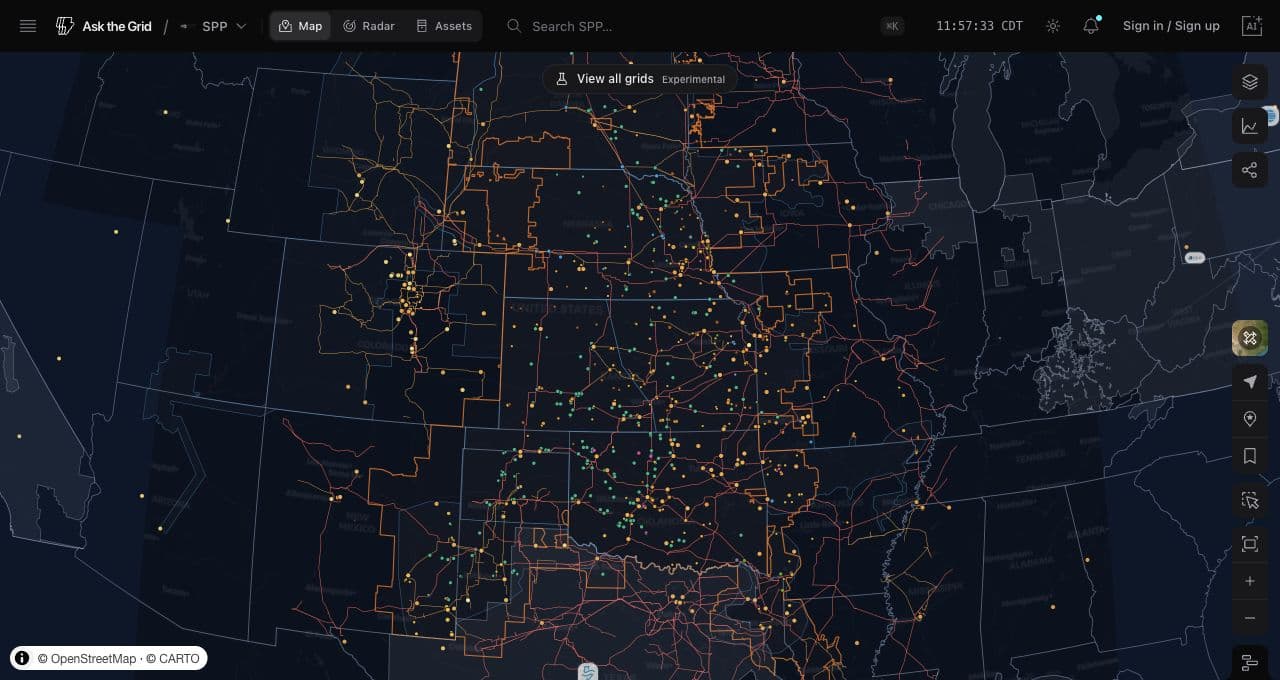
SPP interconnection queue
SPP's generator interconnection queue on a live map of the 14-state footprint: requested capacity by technology, project status, and proposed completion dates from SPP's official active queue.
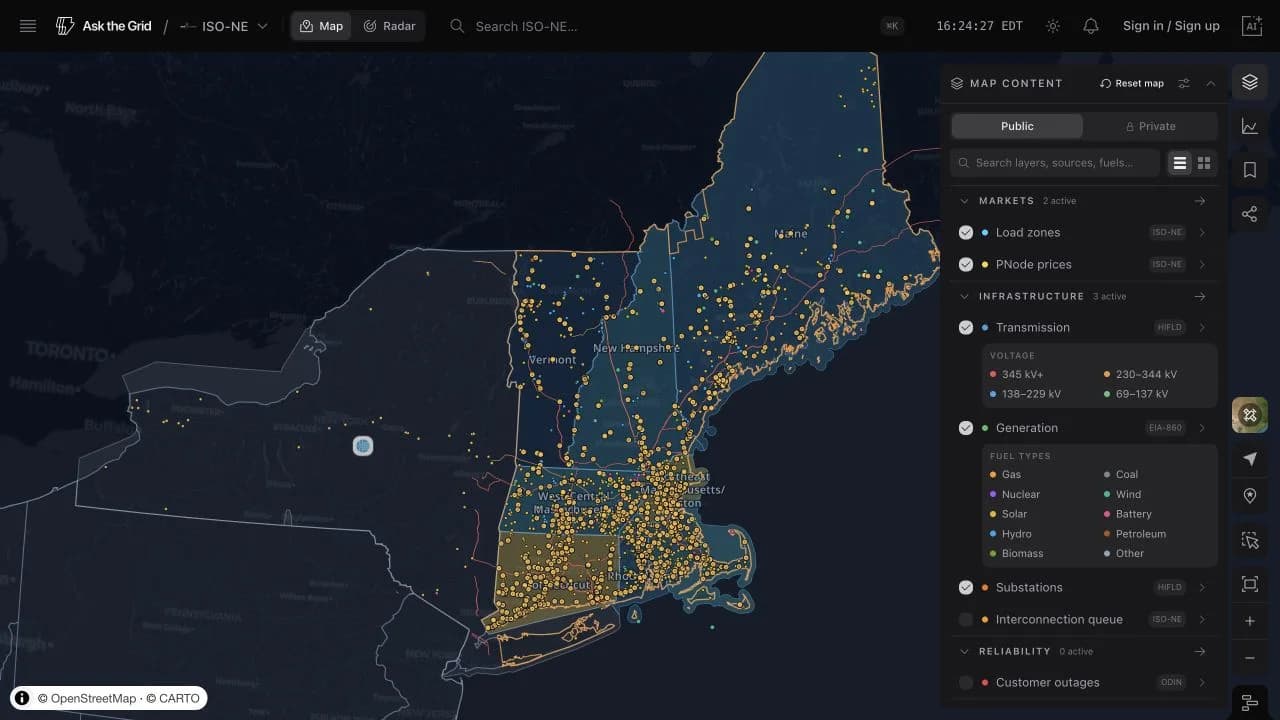
ISO-NE interconnection queue
ISO New England's official interconnection request queue on a six-state map: requested capacity and operator status, with only unambiguously resolved county or utility locations plotted.
Power outages
Texas power outages
Live county-level power outages across Texas, sourced from ODIN — meters currently out, outage count, and the utilities reporting them.
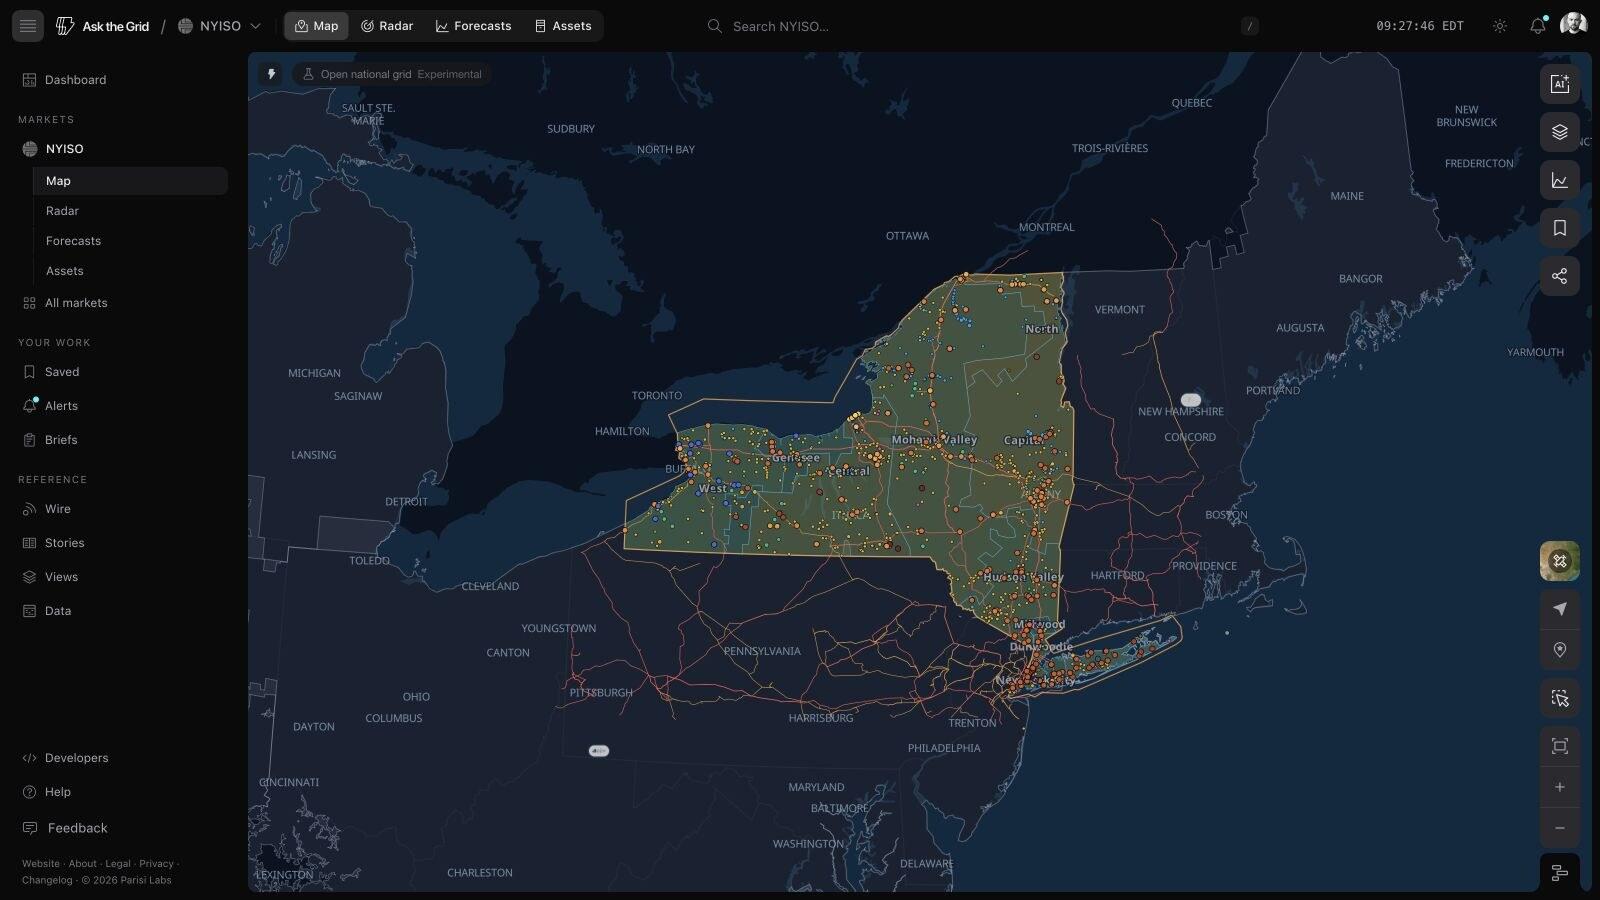
New York power outages
Live county-level power outages across New York State, sourced from ODIN — meters currently out, outage count, and the utilities reporting them.
California power outages
Live county-level power outages across California, sourced from ODIN — meters currently out, outage count, and the utilities reporting them.
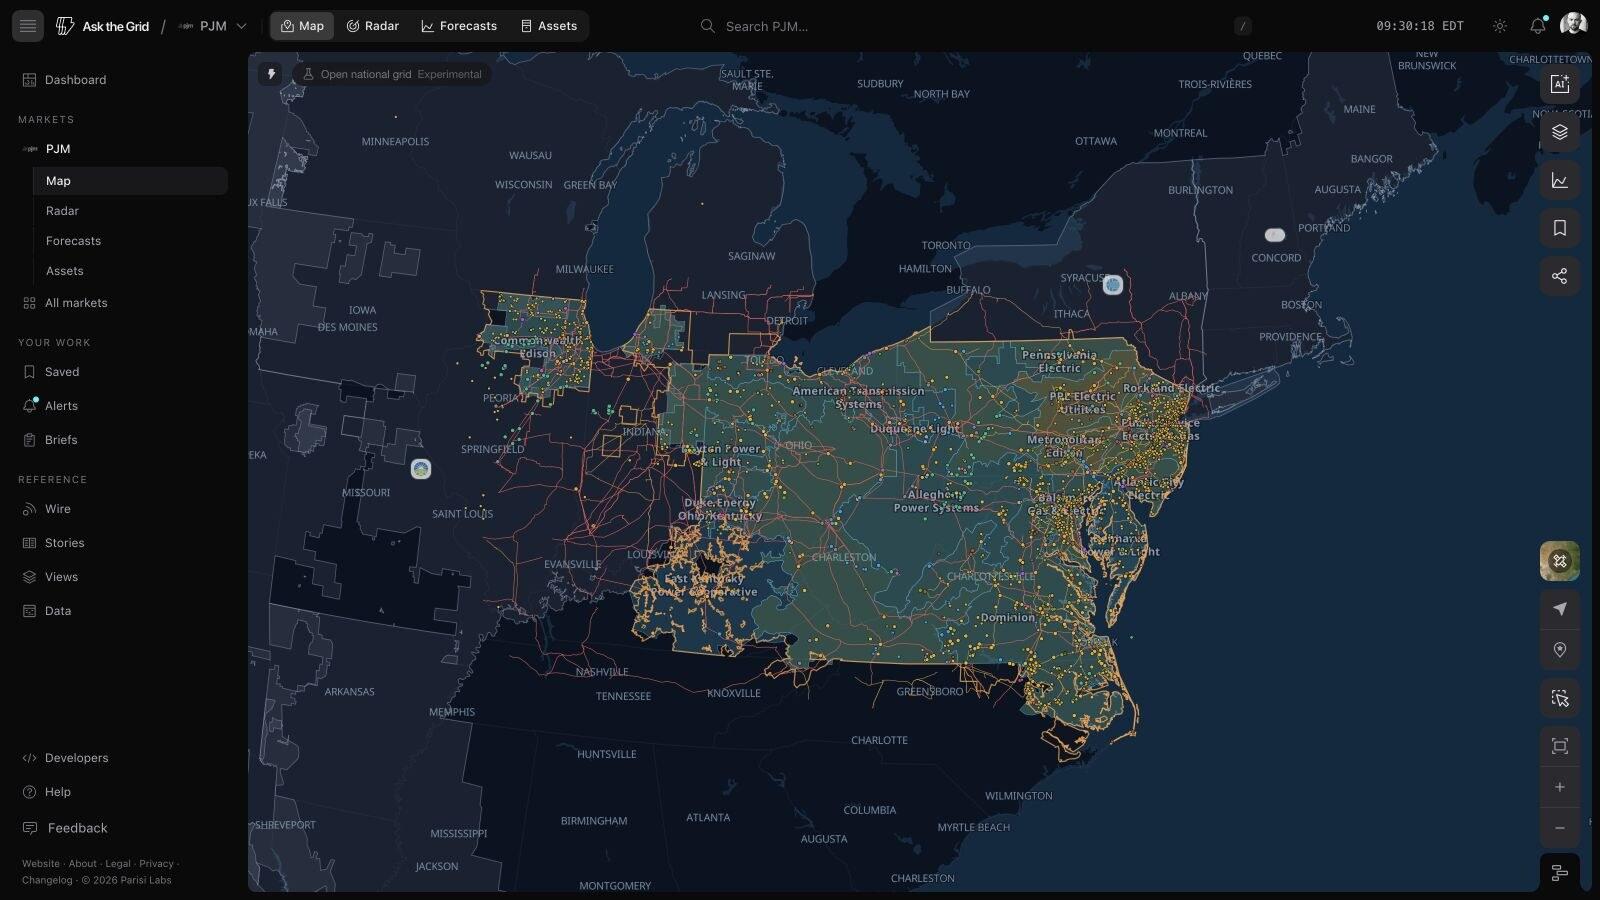
PJM power outages
Live county-level power outages across the PJM footprint — 13 states plus DC — sourced from ODIN, with meters currently out, outage count, and the utilities reporting them.
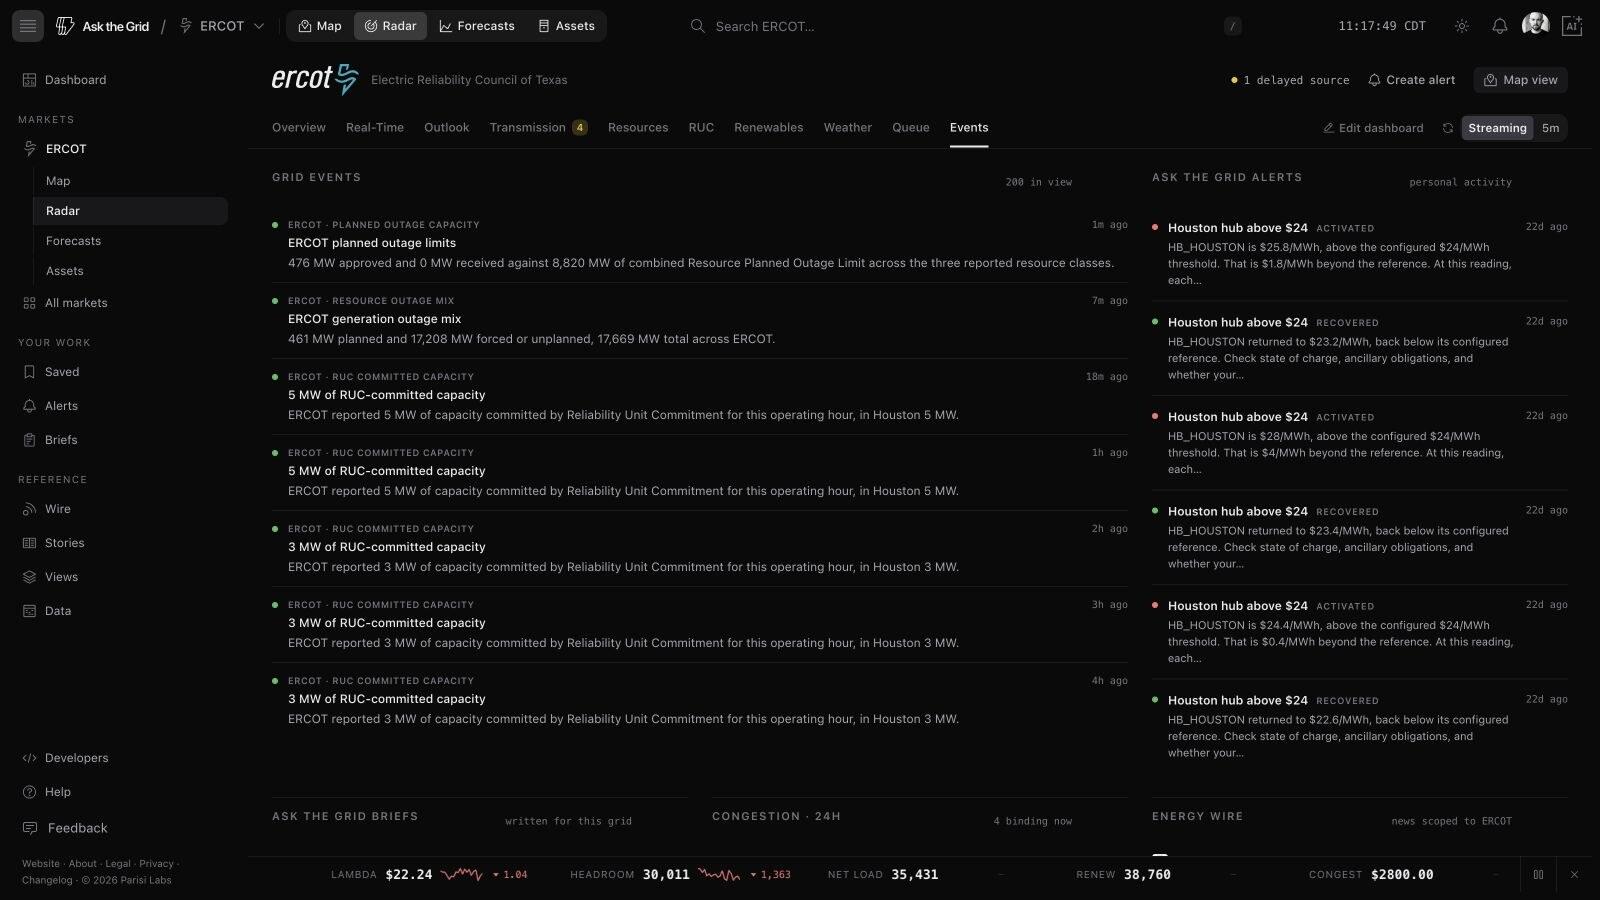
Grid events
Transmission network
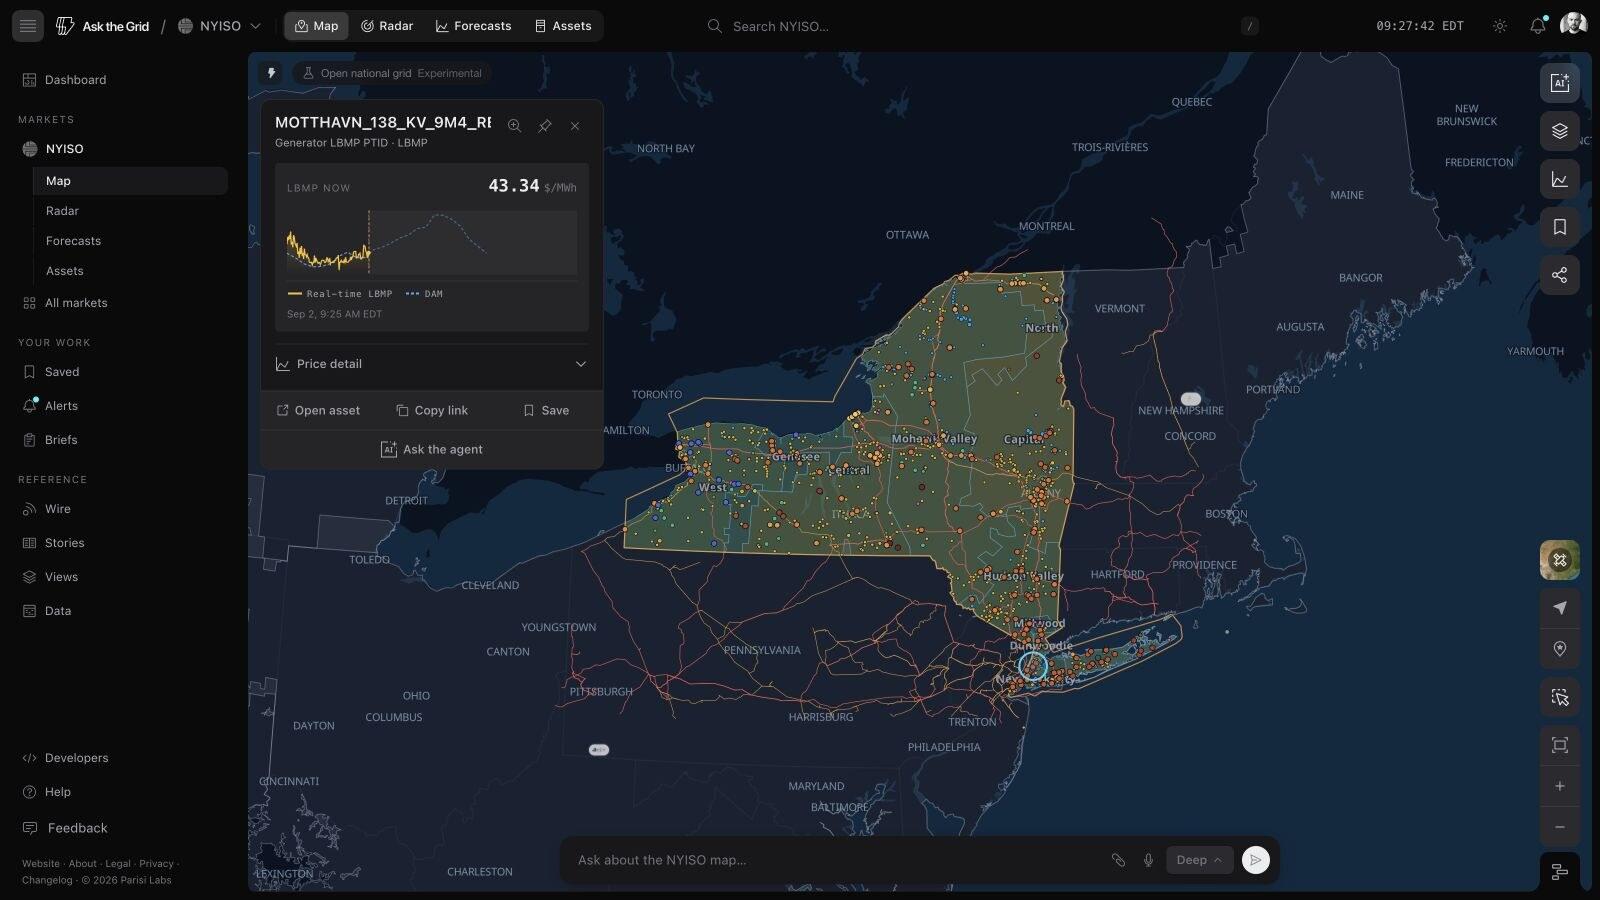
NYISO transmission map
Interactive New York transmission map showing public HIFLD transmission-line and substation inventories beside NYISO zones. Open the same network layers in the live map.
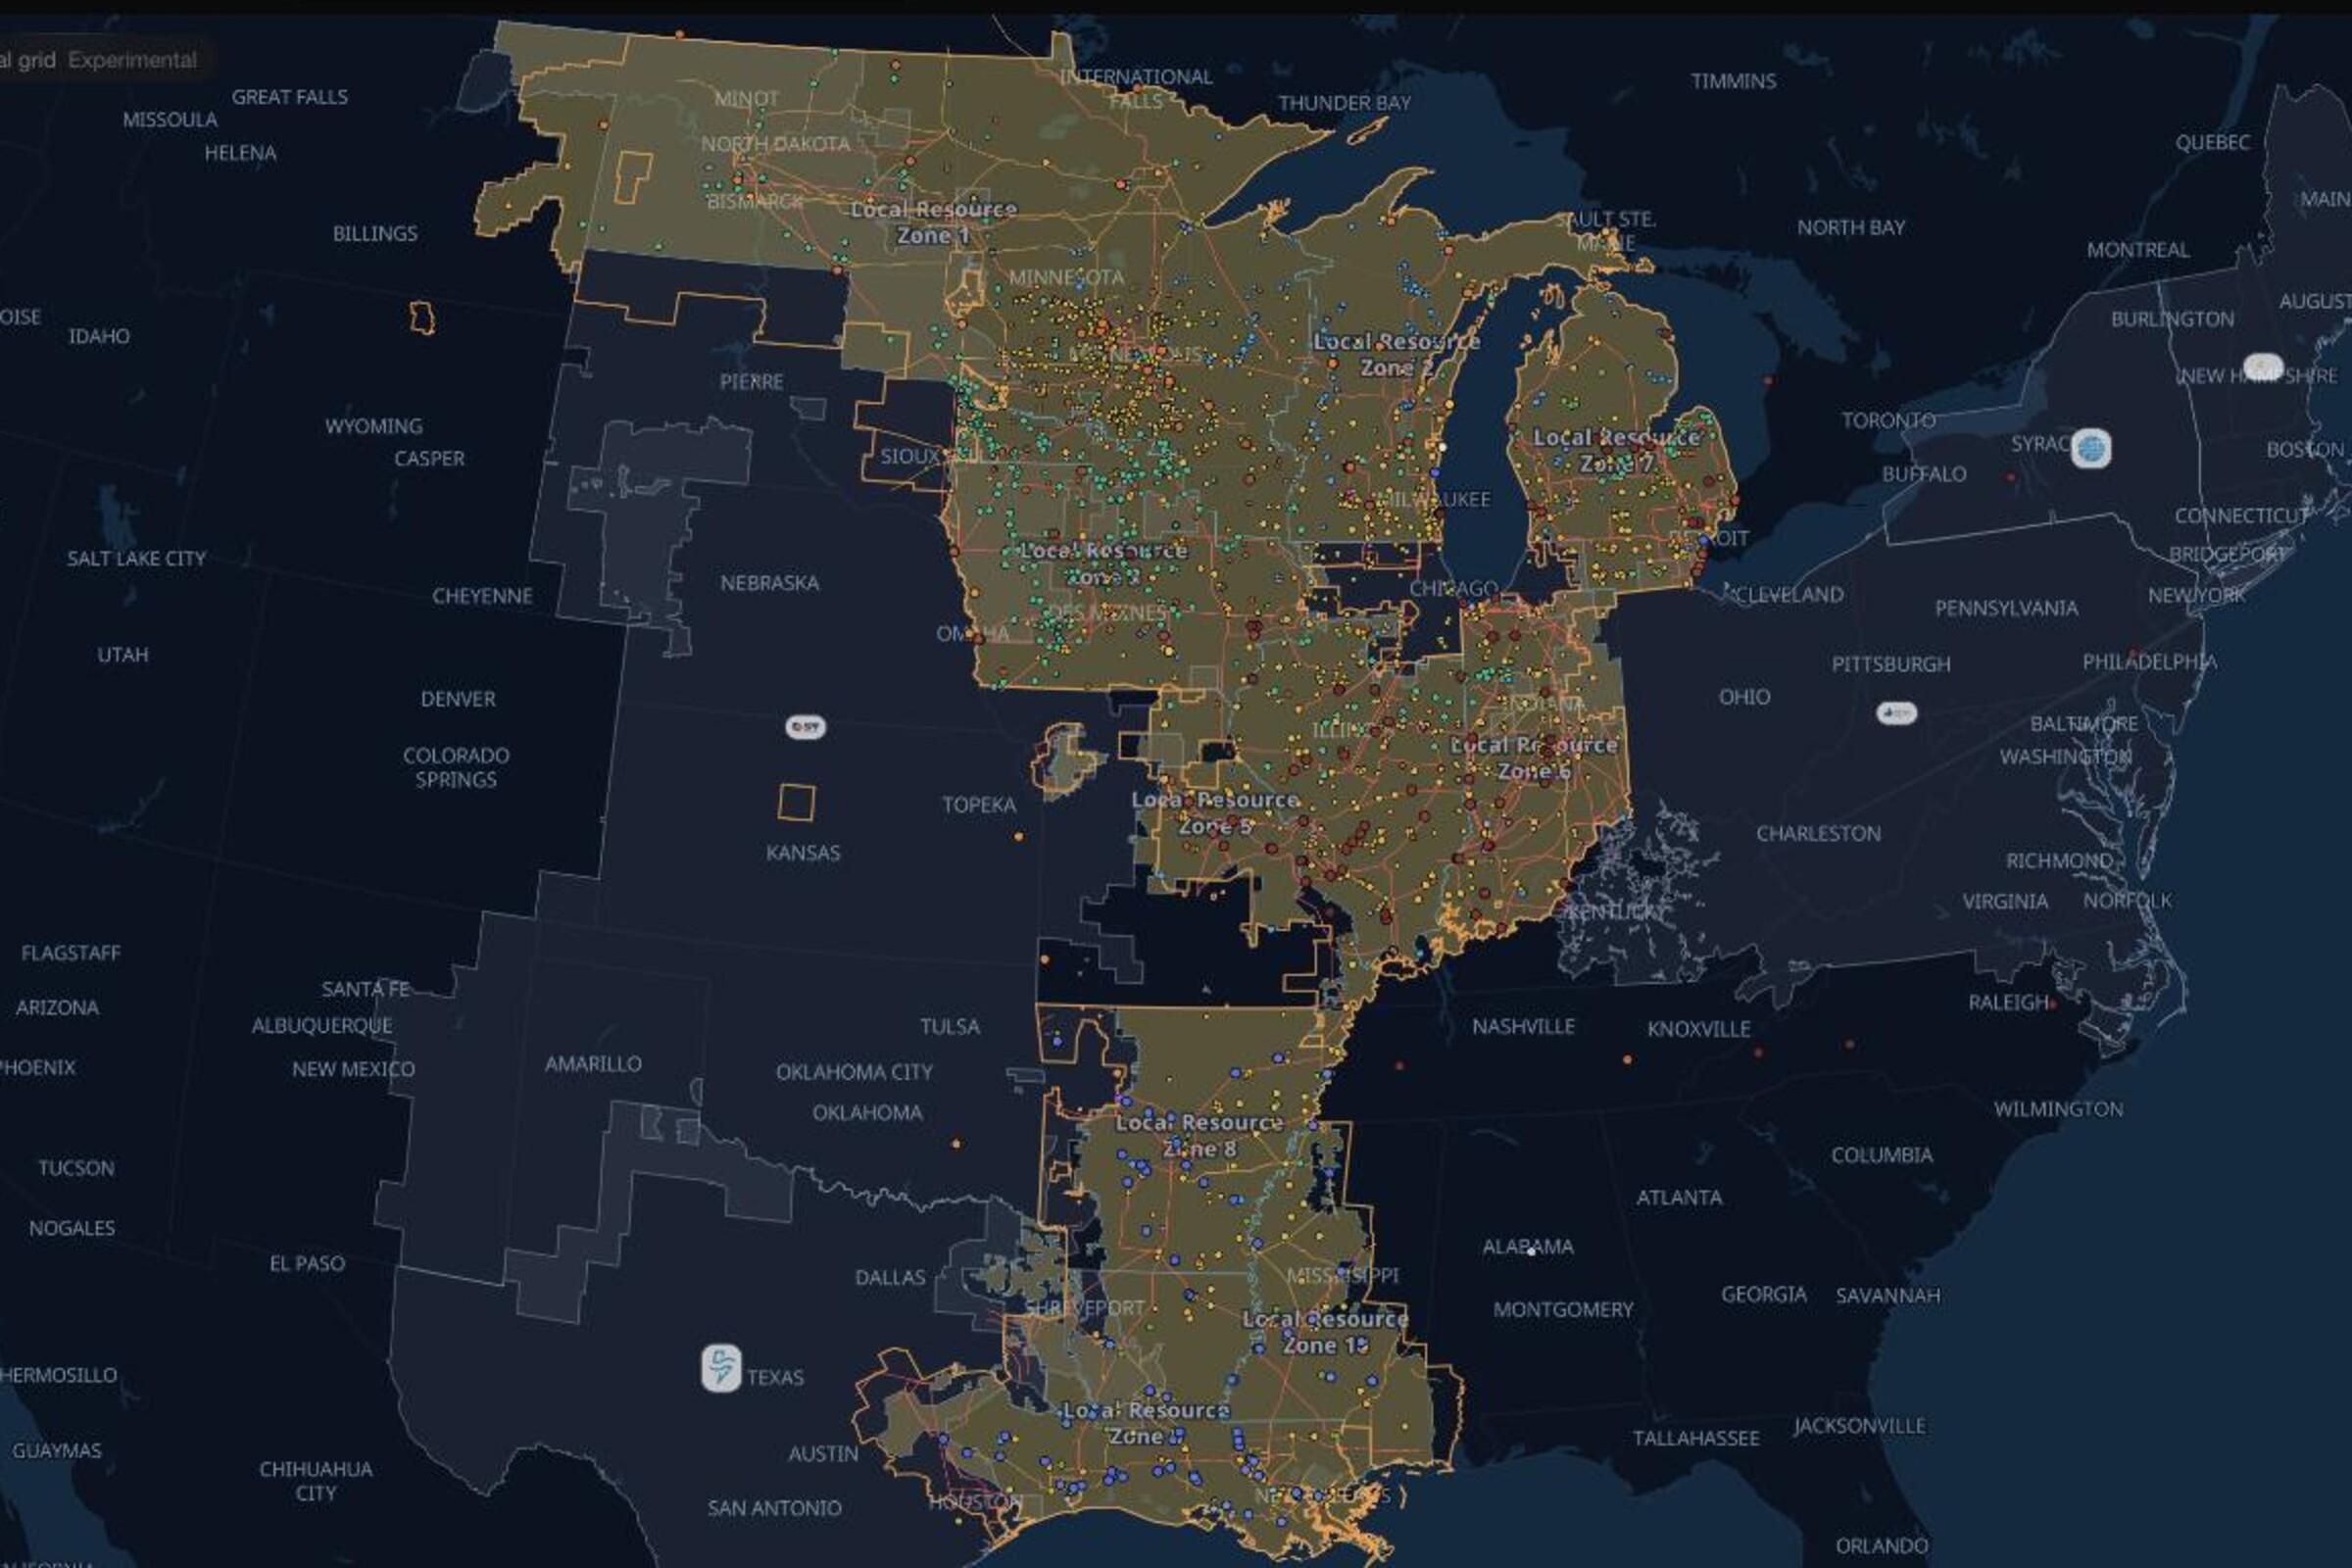
MISO transmission map
Interactive MISO transmission map showing public HIFLD transmission-line and substation inventories beside the MISO footprint. Open the same network layers in the live map.