Net load and every market forecast share one archive
Forty-one load, net-load, price, wind, solar, outage, and temperature forecasts now share one public archive across the organized markets and the Lower 48.
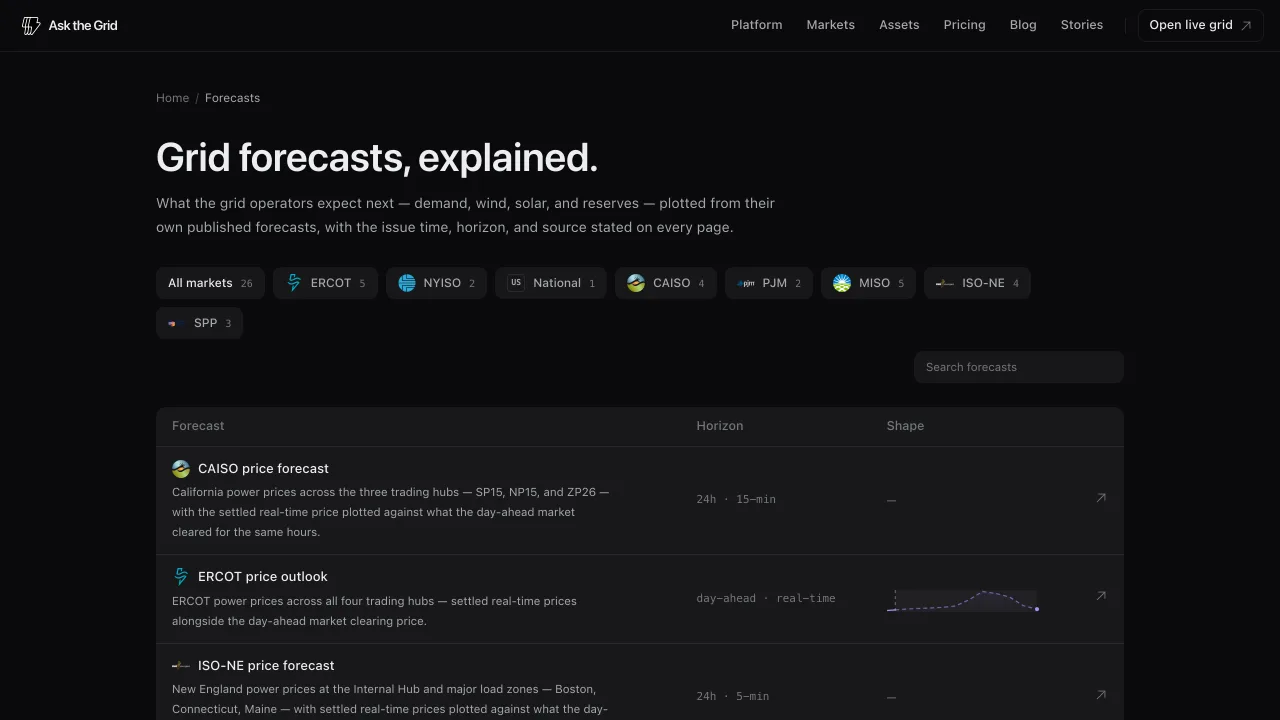
The forecast library brings operator-published outlooks into one comparable product. Each page names the issuer, issue cadence, real horizon, market time zone, source, and uncertainty or coverage limits. Load forecasts retain their zonal detail; price views keep day-ahead and real-time distinct; renewable forecasts are scored against delivered output where settled actuals are available. The archive can be read as a table or card grid and filtered by forecast kind.
The national load page combines total Lower-48 demand from EIA's hourly grid monitor with the day-ahead forecasts reported by regional authorities and a thirteen-region breakdown. It is a national assembly of operator reporting, not a forecast issued by a single grid operator.
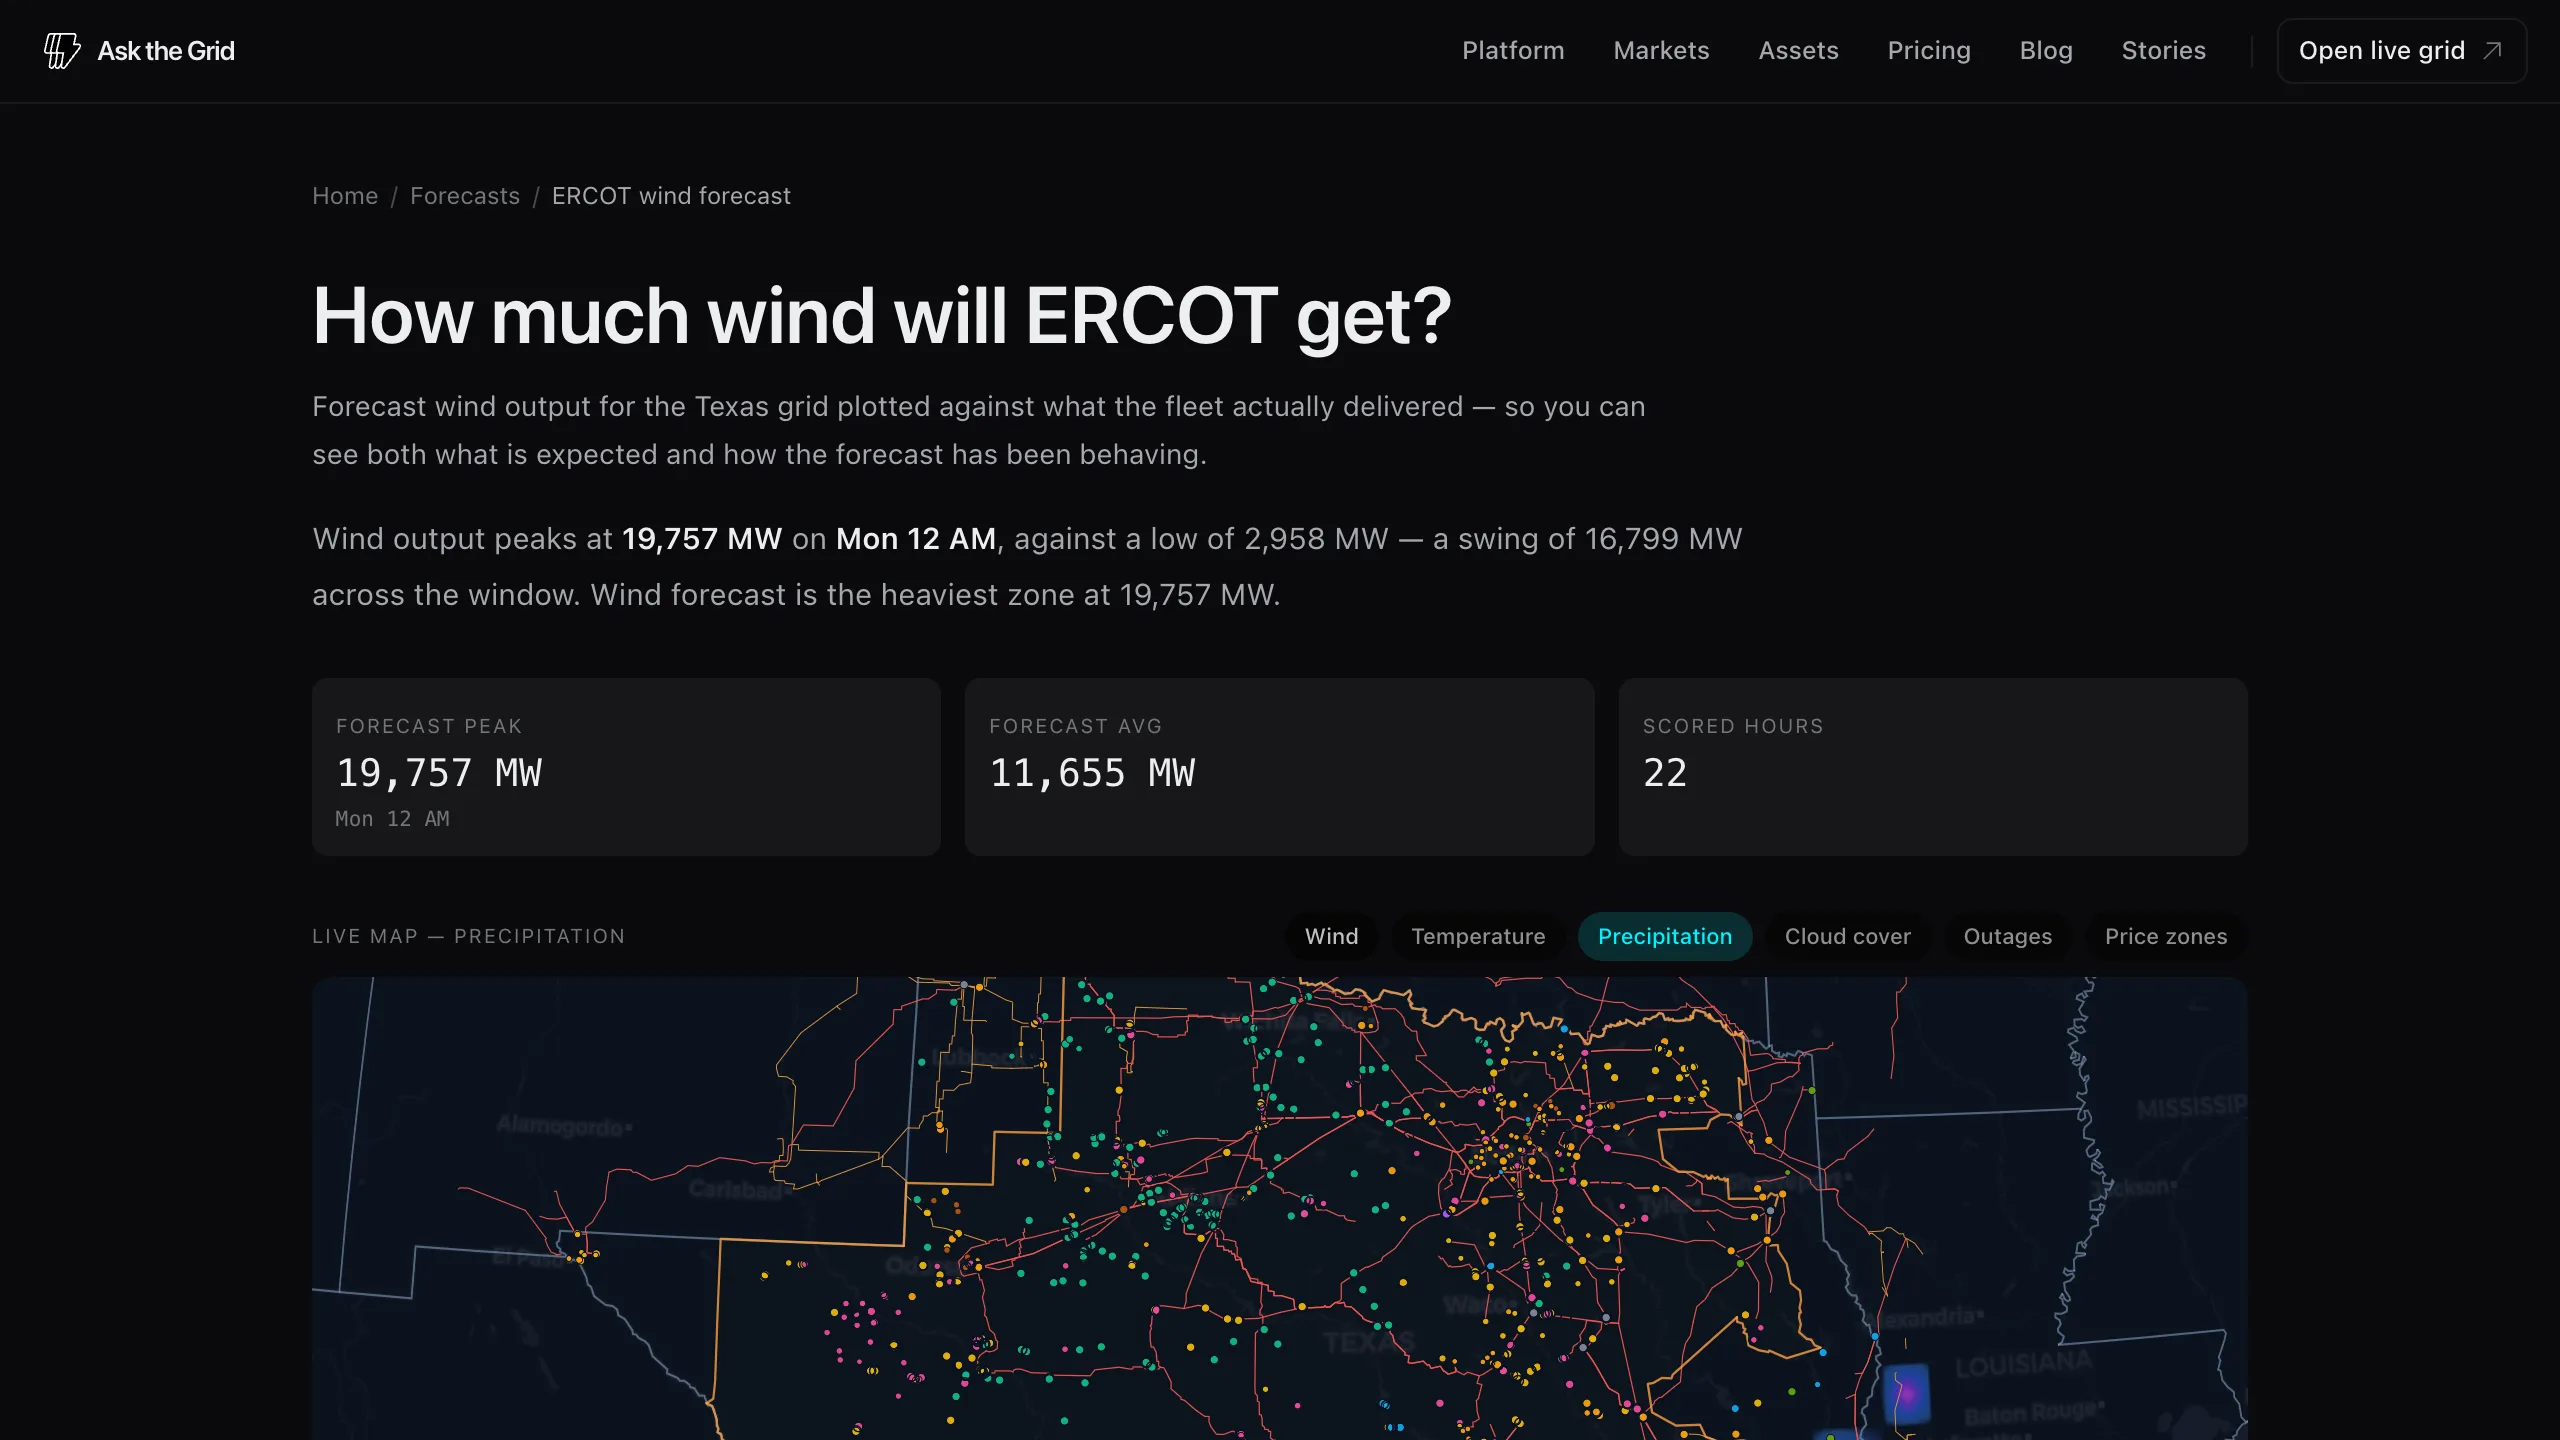
Net load pages for ERCOT, CAISO, MISO, ISO-NE, and SPP subtract the published wind and solar forecasts from published demand, then plot all three inputs beside the result so the derived curve can be checked. Outage forecasts add scheduled generating-capacity reductions, and temperature forecasts show the zonal weather operators use when building demand outlooks.
Read the demand the dispatchable fleet must serve
Net load is derived as demand minus wind minus solar from three forecasts each market publishes. The page keeps those inputs visible with the result, rather than asking the reader to trust an unexplained calculated series.
The pages are available for ERCOT, CAISO, MISO, ISO-NE, and SPP. SPP's forecast window runs seven days; the others retain the real horizons of their component feeds. The archive also includes the newly collected outage and zonal-temperature forecast families.
Browse the complete archive by forecast kind
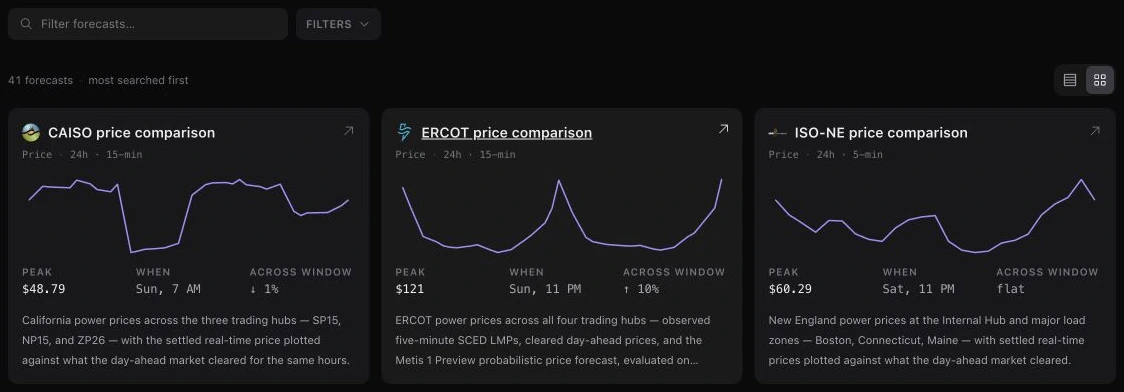
The rebuilt index holds 41 forecast pages across eight kinds. Table and card views use the same list, while filters narrow the archive to the operating question—such as price, load, renewables, outages, temperature, or net load.
Each row summarizes the forecast peak, its hour, and the change across the visible window from the same points drawn in its sparkline.
Open every forecast for one market
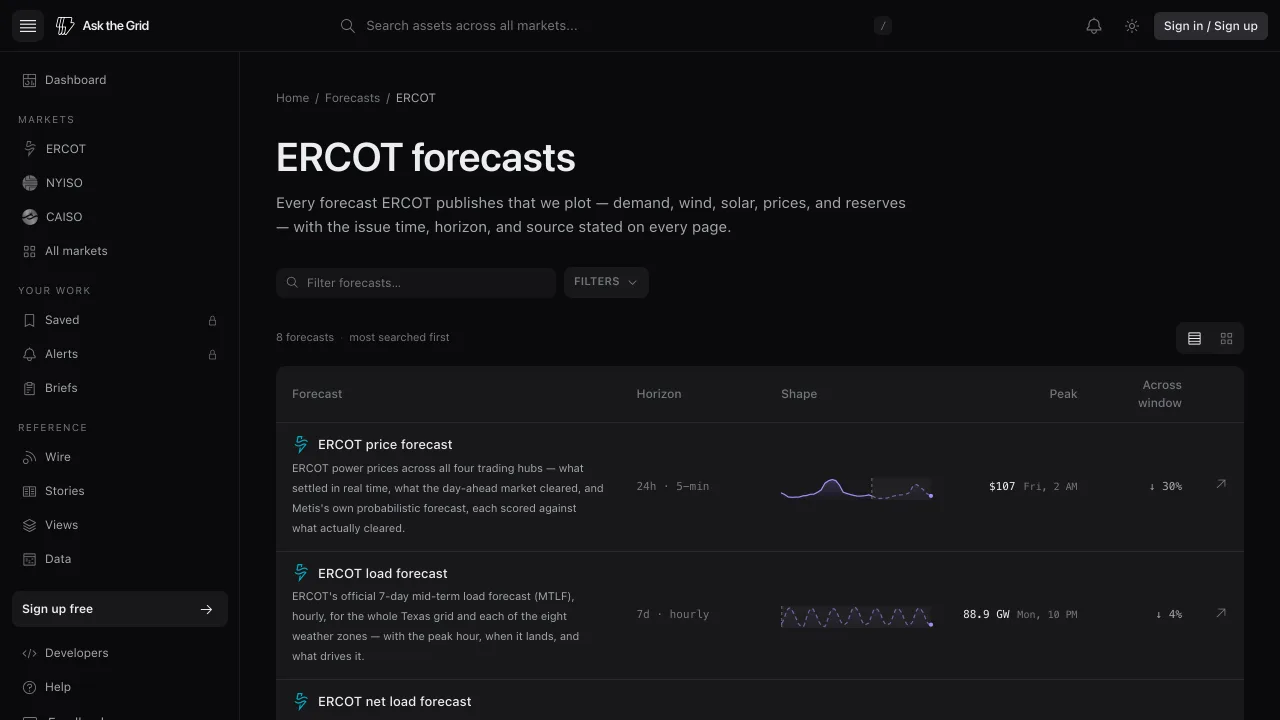
A market's Forecasts tab now opens that market's complete archive at a stable address rather than choosing one page to represent the whole feed set. ERCOT, for example, exposes eight published forecast pages from the same market index.
A national demand view no single operator publishes
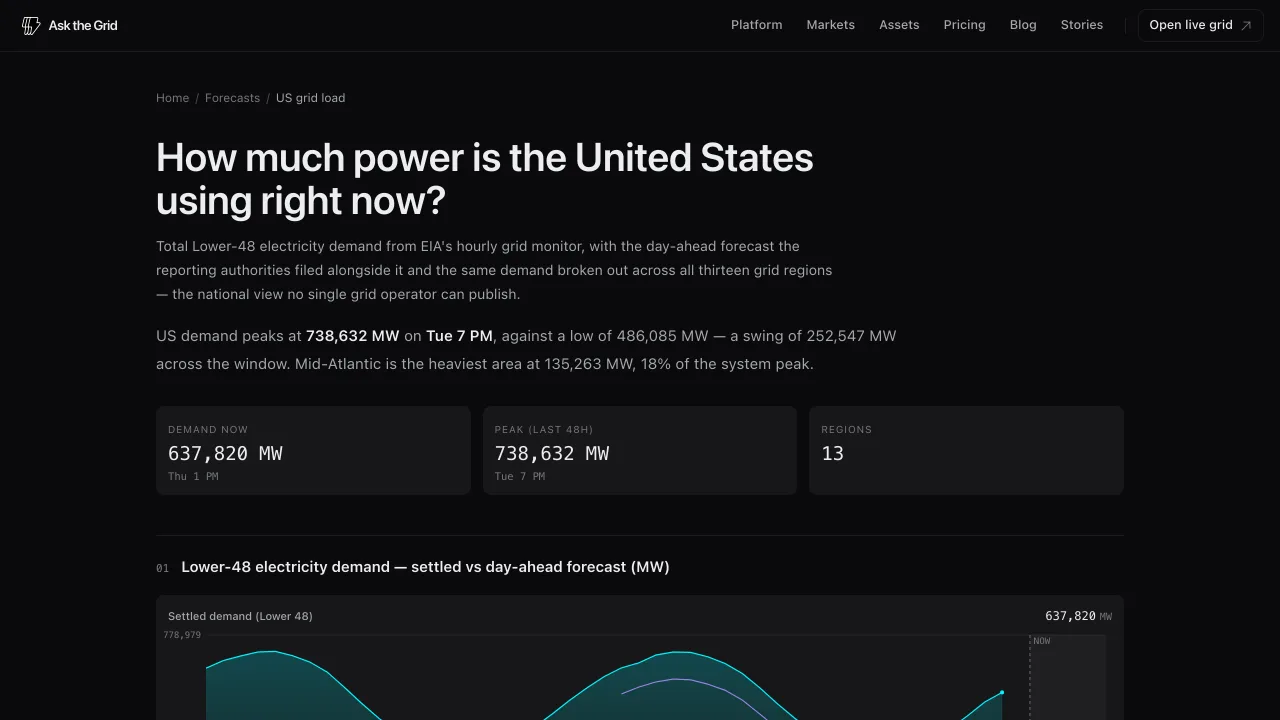
US grid load shows total Lower-48 electricity demand, the filed day-ahead outlook, the same demand divided across thirteen grid regions, and the national fuel mix. The page keeps the source authorities and their reporting boundaries visible rather than presenting the assembly as one operator's forecast.
Comparable pages, operator-native provenance
Nineteen forecast pages extend the library across CAISO, PJM, MISO, ISO-NE, and SPP, joining ERCOT and NYISO. A shared page structure makes them easier to compare while operator-specific horizons, cadences, products, and time zones remain explicit.
The directory can be searched or filtered by market and forecast family. Coverage and source links live on the page rather than in a separate methodology note.
Evaluate the vintage that actually existed
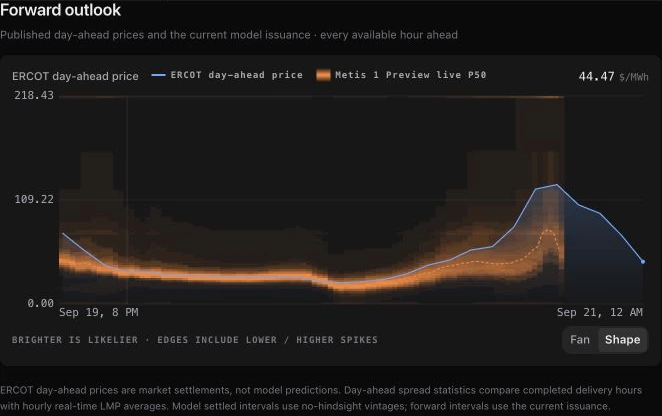
Historical comparison preserves the original model run and places the eventual settled values beside it. The evaluation does not blend later information into an earlier forecast, and charts label the boundary between observed history and the live horizon.
Eligible users can also preview Metiscast Energy forecasts on ERCOT node charts, including an uncertainty range, refresh schedule, inputs, methodology, and centrally controlled preview status.
Keep forecast context on the map
Each curated forecast opens with the map layer that matches its subject. Wind, temperature, precipitation, cloud cover, outages, and price zones can then be combined independently on that page, without altering another tab or the full map workspace.