SPP is now live on Ask the Grid
Southwest Power Pool now has a dedicated Map and Radar workspace for its public grid geography, real-time market conditions, and operating context.
SPP is available from the market switcher and opens as its own Map and Radar workspace. The experience is built around the public SPP feeds and the market’s geography, rather than treating the Great Plains footprint as a generic version of another ISO.
The release is deliberately specific about what its data can establish. Live prices, fuel mix, demand, short-term renewable forecasts, ancillary-service clears, and binding constraints are available now. Queue history, DC-tie or interface prices, reserve adequacy, outage capacity, and operator commitments are not part of this launch.
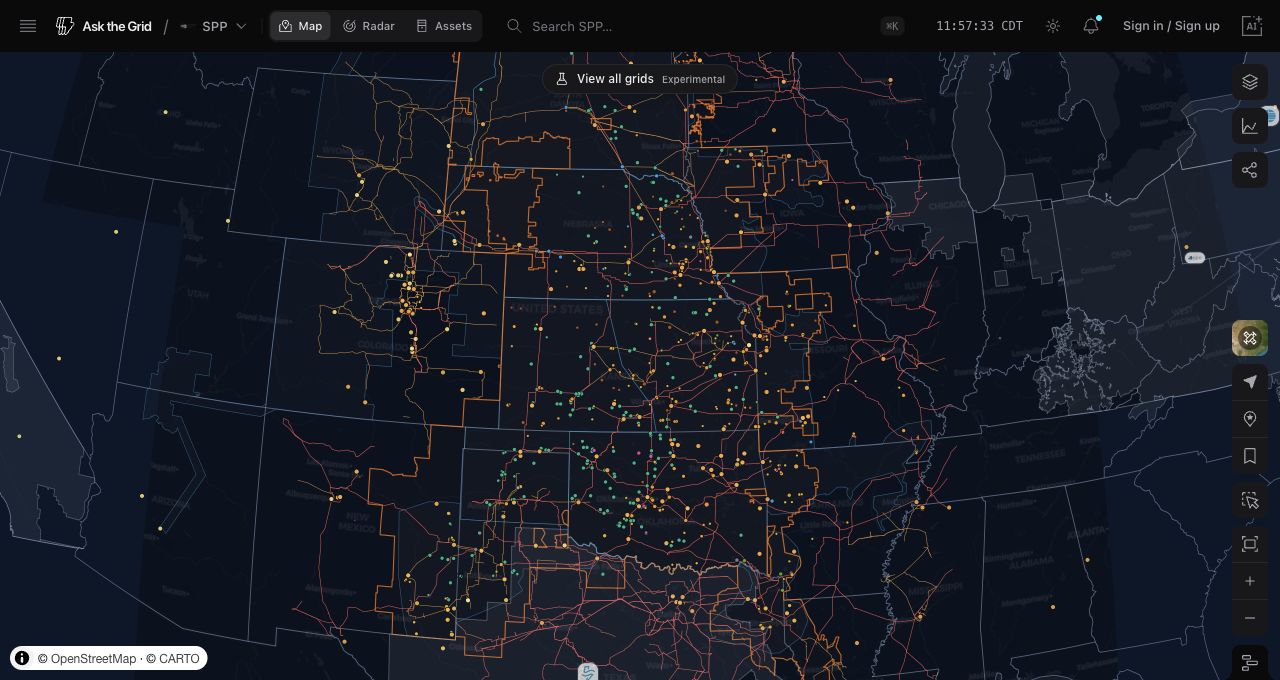
Start on the SPP map
The new map centers the Southwest Power Pool footprint and keeps public generation, pricing nodes, transmission, substations, zones, and weather layers in the same geographic workspace. It is the fastest way to move from a market question to the part of the system that makes the question concrete.
Use the layer controls to narrow the view, use the timeline for the available time context, or open the agent with a selected place or asset. The map shows public location and network context; it does not imply electrical connectivity simply because two features appear nearby.
Read the operating picture in Radar
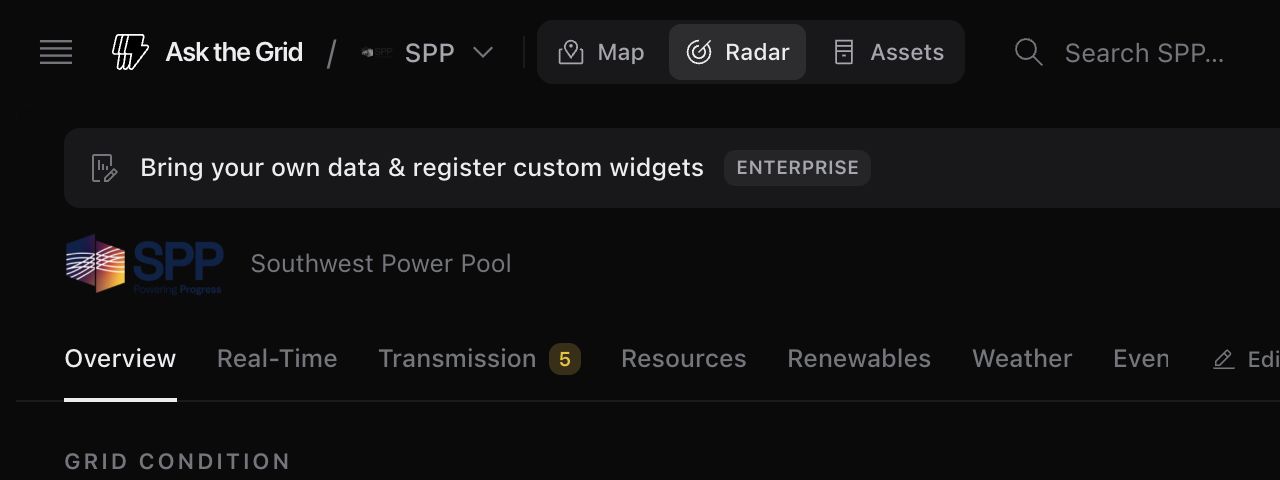
SPP Radar brings the latest public demand, generation by fuel, hub prices, binding-constraint information, real-time versus day-ahead hub basis, and ancillary-service clears into one operator-style view. The feed timestamp is visible in the product, so the dashboard does not present stale data as live.
Wind and solar are shown alongside their short-term forecasts where SPP supplies the needed series. The dashboard does not calculate a reserve margin or claim an outage-driven explanation when the necessary public fields are absent.
Ask a question that the SPP data can answer
The transmission desk surfaces the currently binding constraints and their published shadow prices, then places the SPP North and South hub readings beside the real-time versus day-ahead comparison. That gives an analyst the observed signal before they decide whether there is enough evidence for an explanation.
The agent starts with SPP-specific prompts for those supported questions: current real-time prices, the two hub readings, wind and solar against short-term forecasts, and binding constraints. It no longer proposes an unsupported SPP price forecast or reserve assessment.