Radar, events, and alerts turn live data into an operating desk
Market-native Radar desks now connect live prices, demand, congestion, generation, operator events, and persistent alerts without inventing signals an operator does not publish.
Grid Radar began as a dense ERCOT operations cockpit and expanded into market-native desks for CAISO, NYISO, SPP, MISO, and ISO-NE. Each version follows the same operating questions—condition, supply and demand, prices, congestion, resources, weather, and events—while showing only the measures its operator actually reports in a compatible form.
Events and alerts turn the cockpit into an ongoing workflow. Normalized operator notices, outages, schedules, and observations remain distinct on the map, Radar, asset pages, and in the agent. A contextual alert can then keep evaluating a value, event stream, asset, or geographic scope after the dashboard closes.
A market-native operations cockpit
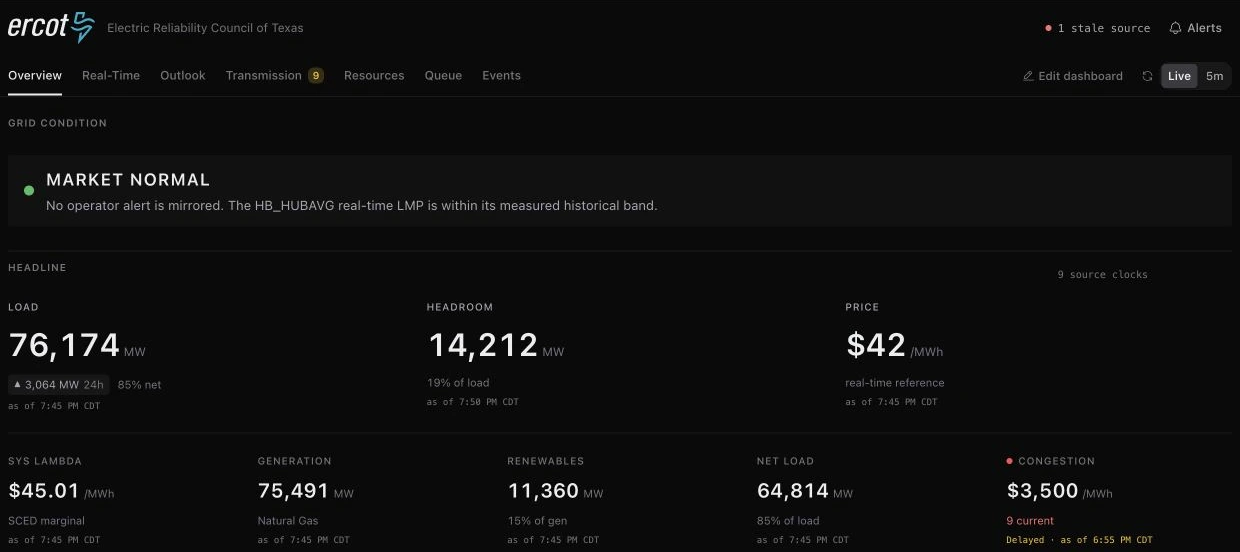
ERCOT Radar combines load, headroom, hub price, system lambda, net load, congestion, committed capacity, fuel mix, constraints, border prices, and real-time versus day-ahead basis. CAISO and NYISO added their own supply, demand, prices, constraints, renewable, storage, interface, and operator-event views according to their published feeds.
Widgets show an explicit empty state when a live source is unavailable. Custom layouts persist, individual widgets have stable links, and image export supports briefings without changing the data shown.
Expand without pretending every grid is the same
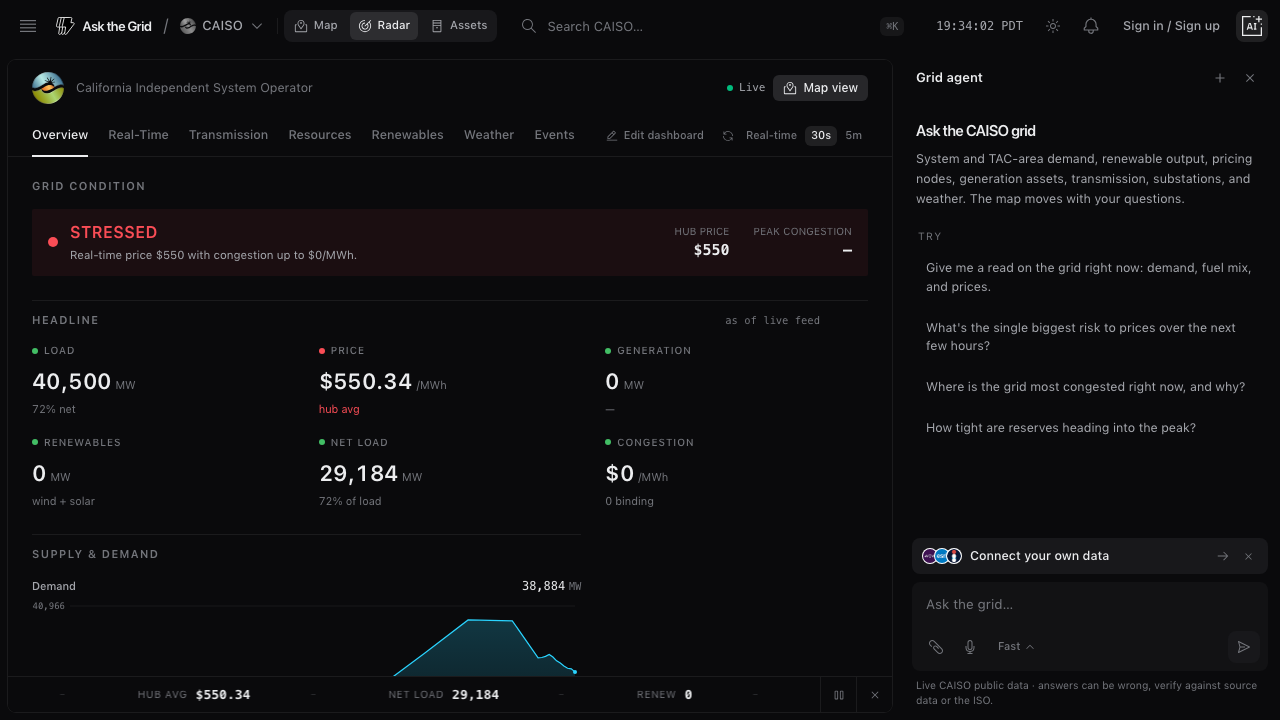
CAISO includes intertie and nomogram congestion, battery dispatch, and wind and solar actual versus forecast. NYISO includes generation by fuel, eleven load-zone prices, external-interface prices, and operator advisories. Where one market has no compatible counterpart to another's measure, the desk leaves it out.
Move from a headline price to the geographic signal
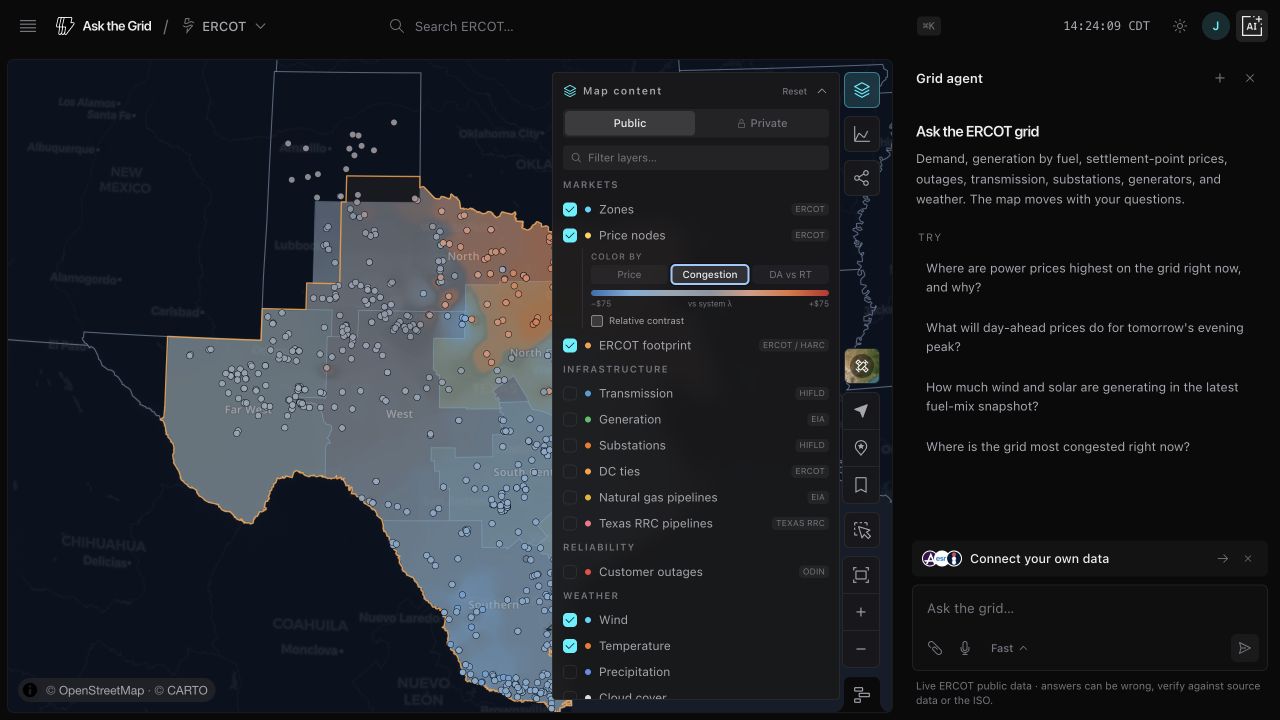
ERCOT price nodes can be colored by congestion relative to system lambda or by real-time versus day-ahead congestion difference. Replaying the timeline shows how separation moves across the day.
This is an observational view of public settlement data, not a power-flow model or proof that a particular constraint caused every local price move.
Keep operator events distinct and source-backed
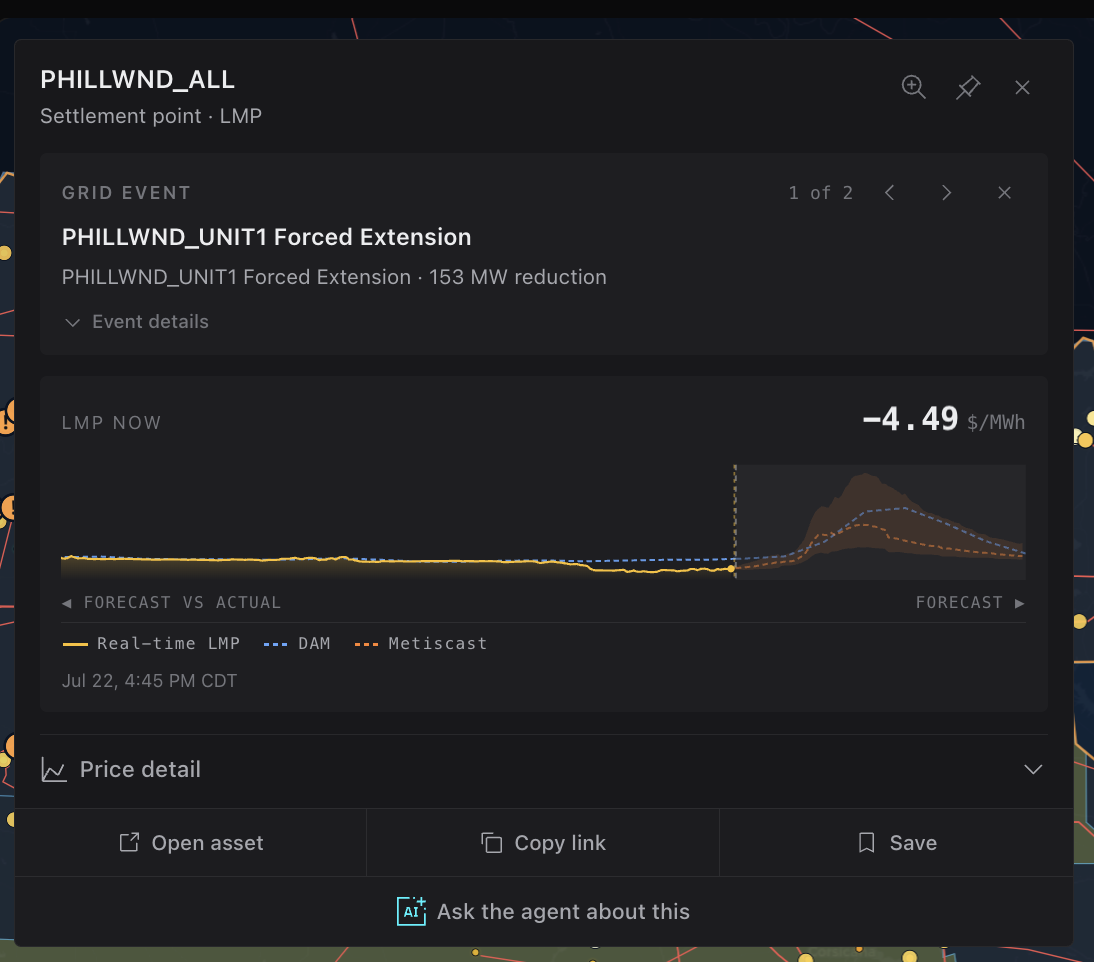
Operational episodes, schedules, and grid-level observations retain provider, publication or observation time, valid window, severity, status, and geographic or asset attachment. Repeated intervals remain one episode, and an aggregate outage snapshot is not counted as a second physical event.
ERCOT planned, forced, dispatchable, and renewable outage quantities remain separate. A grid-level publication does not pretend to identify a resource, and temporal overlap is not presented as causation.
Turn the observed condition into a persistent alert
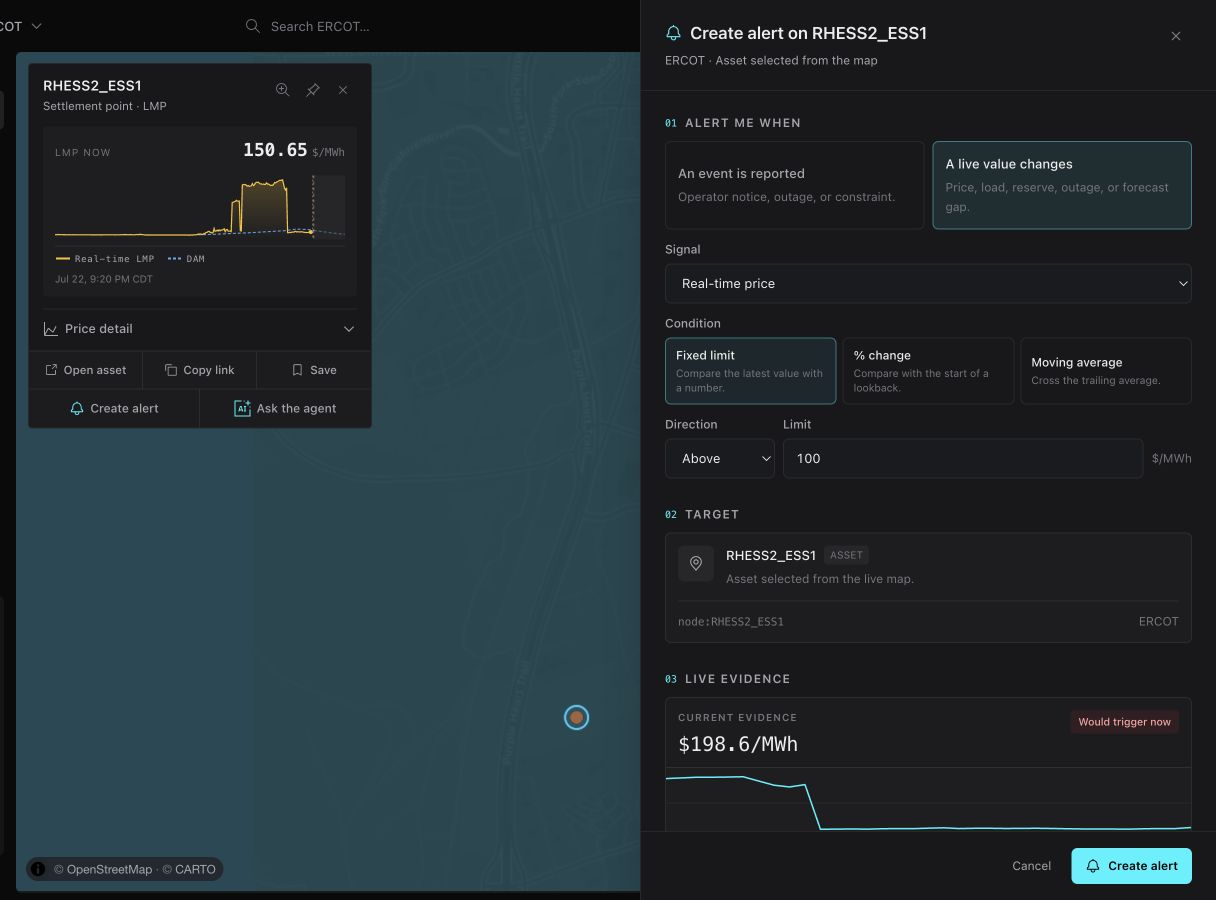
Alerts can begin from a selected node, Radar metric, asset, multi-selection, area, or dropped pin. The composer carries the active grid, entity, geometry, metric, and starting value into the rule while keeping the underlying workspace visible.
Rules can require repeated evidence before activating, use recovery bands, track source health separately from the monitored condition, and keep an evidence history. The manager supports testing, editing, cloning in a paused state, pausing, resuming, and archiving.