Grid assets become explorable operating records
Source-backed plant profiles, generation detail, independently mapped data centers, and New York hosting capacity connect individual facilities to the public grid evidence around them.
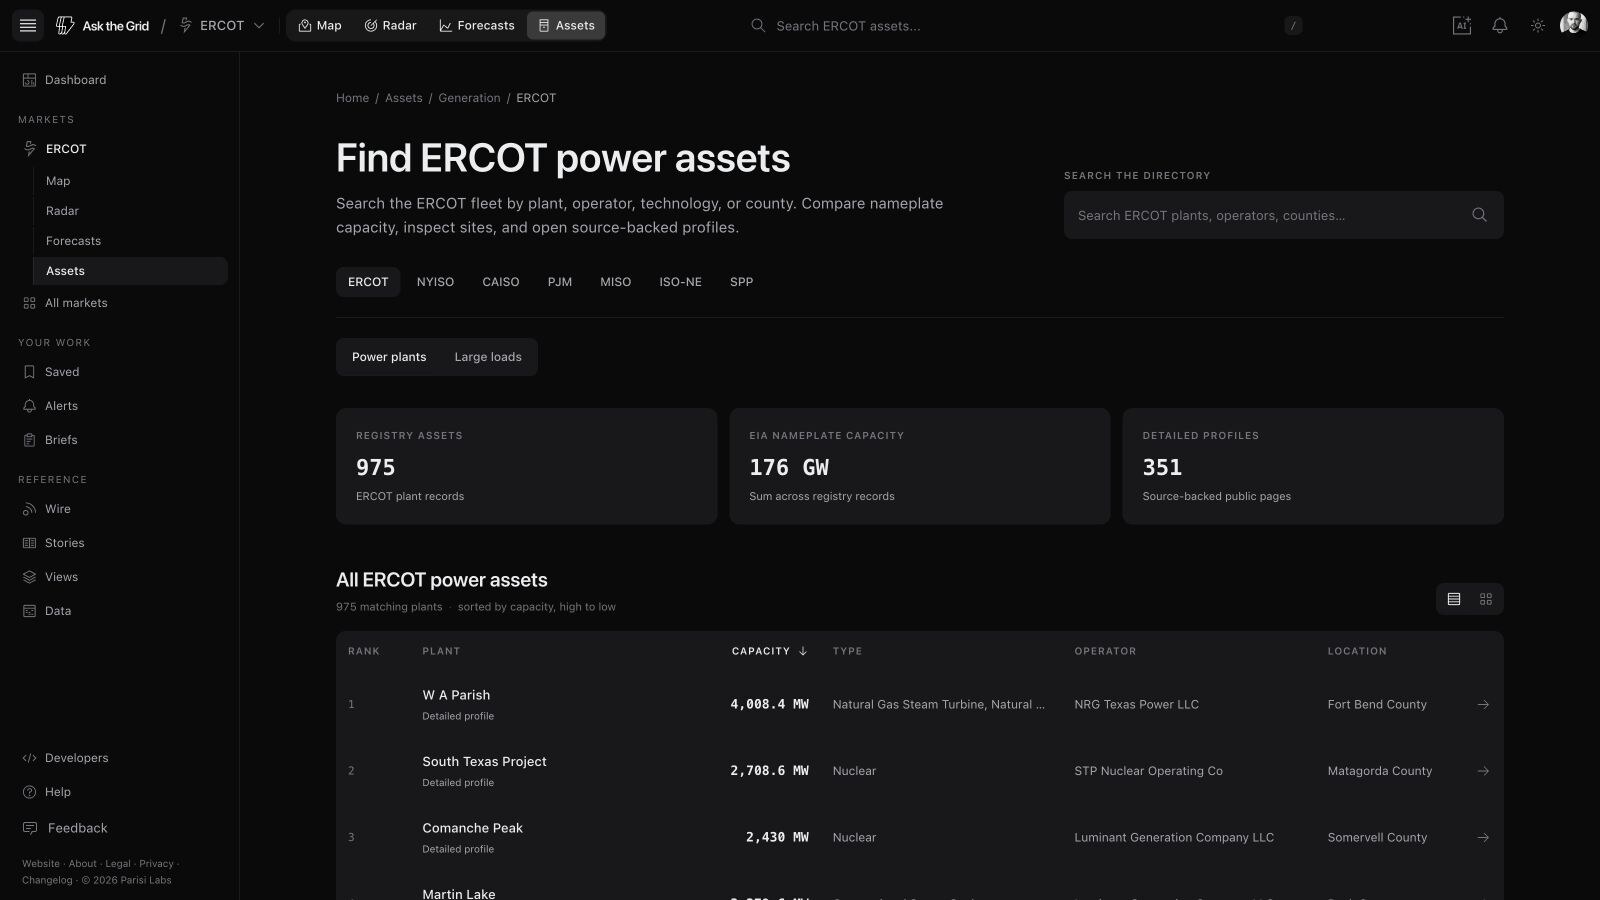
Asset research now moves from the fleet to the facility and back to the grid. Asset directories span ERCOT, CAISO, NYISO, PJM, MISO, ISO-NE, and SPP, with the market switcher preserving the Assets view between grids. Each directory searches plants by operator, technology, county, and market context; individual profiles collect operating records, generation history where available, related parties, and linked primary sources.
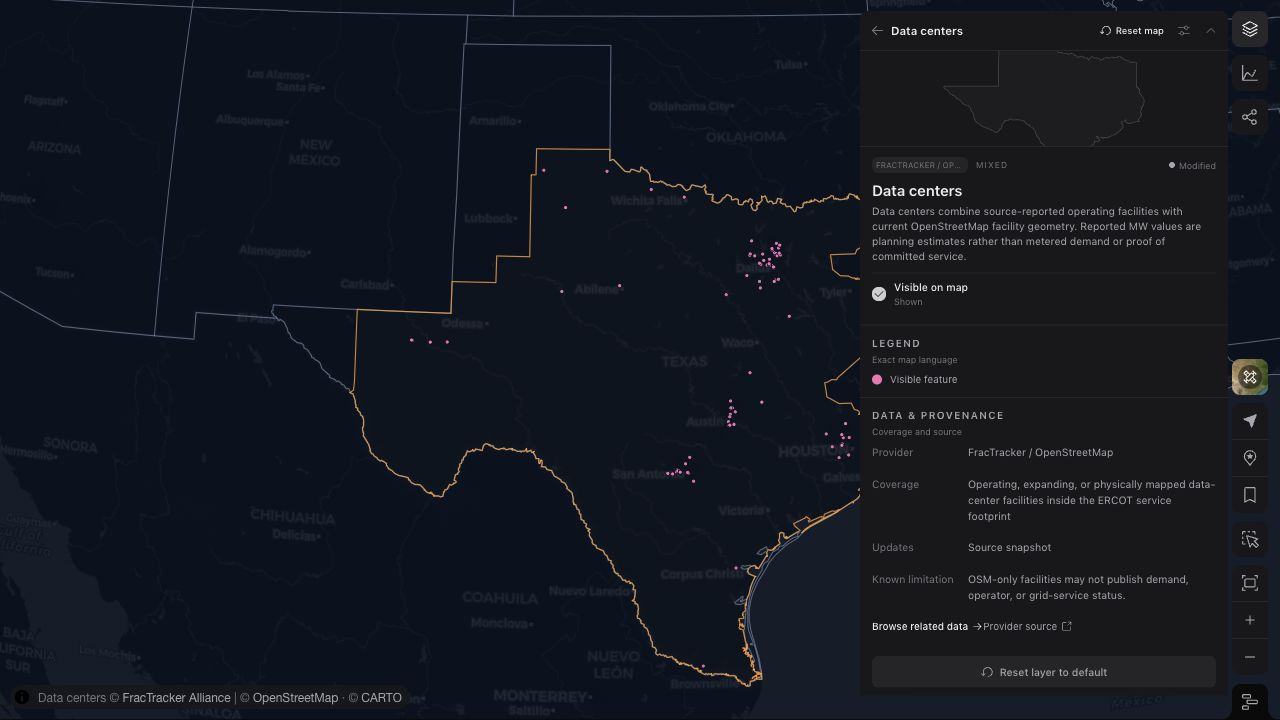
The map adds other infrastructure questions that are not represented by a conventional generator record. Publicly mapped data centers can be studied beside transmission, substations, prices, weather, and queues in ERCOT. NYSERDA's county hosting-capacity rollup shows where New York distribution systems report headroom, including separate ESS charging and discharging views.
Search the fleet, then open the public record
Profiles join plant and equipment records with generation history where available, market context, related parties, and primary-source links. Every organized US market has the same Assets entry in its workspace header, while market views and technology leaderboards provide a way into the directory without requiring an exact plant name.
Read an individual plant's disclosed output
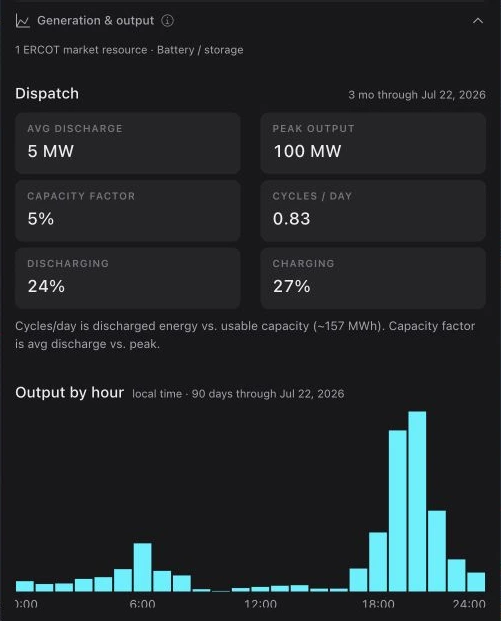
Selecting a plant opens current or recent operating detail and a generation history drawn from the available public feed. Storage plants show dispatch; other plants show output by fuel. The catalog states the cadence and coverage behind each view.
ERCOT plants read ERCOT's own disclosed telemetry: twelve months of output, and for the latest disclosed day how each resource traded at its settlement point's real-time price. A battery shows what it discharged and charged at, the spread between them, and the reserves it held. Plants in other markets report monthly generation from EIA-923 filings.
Place large loads in grid context
The ERCOT data-center layer uses OpenStreetMap for facility location and footprint, with a separate reviewed publication process for ownership, development, power, permitting, compute use, environmental context, and local reporting.
Published MW values retain whether they are requested, contracted, energized, gross campus, or critical IT load. They are not presented as metered demand.
Separate battery charging and discharging headroom
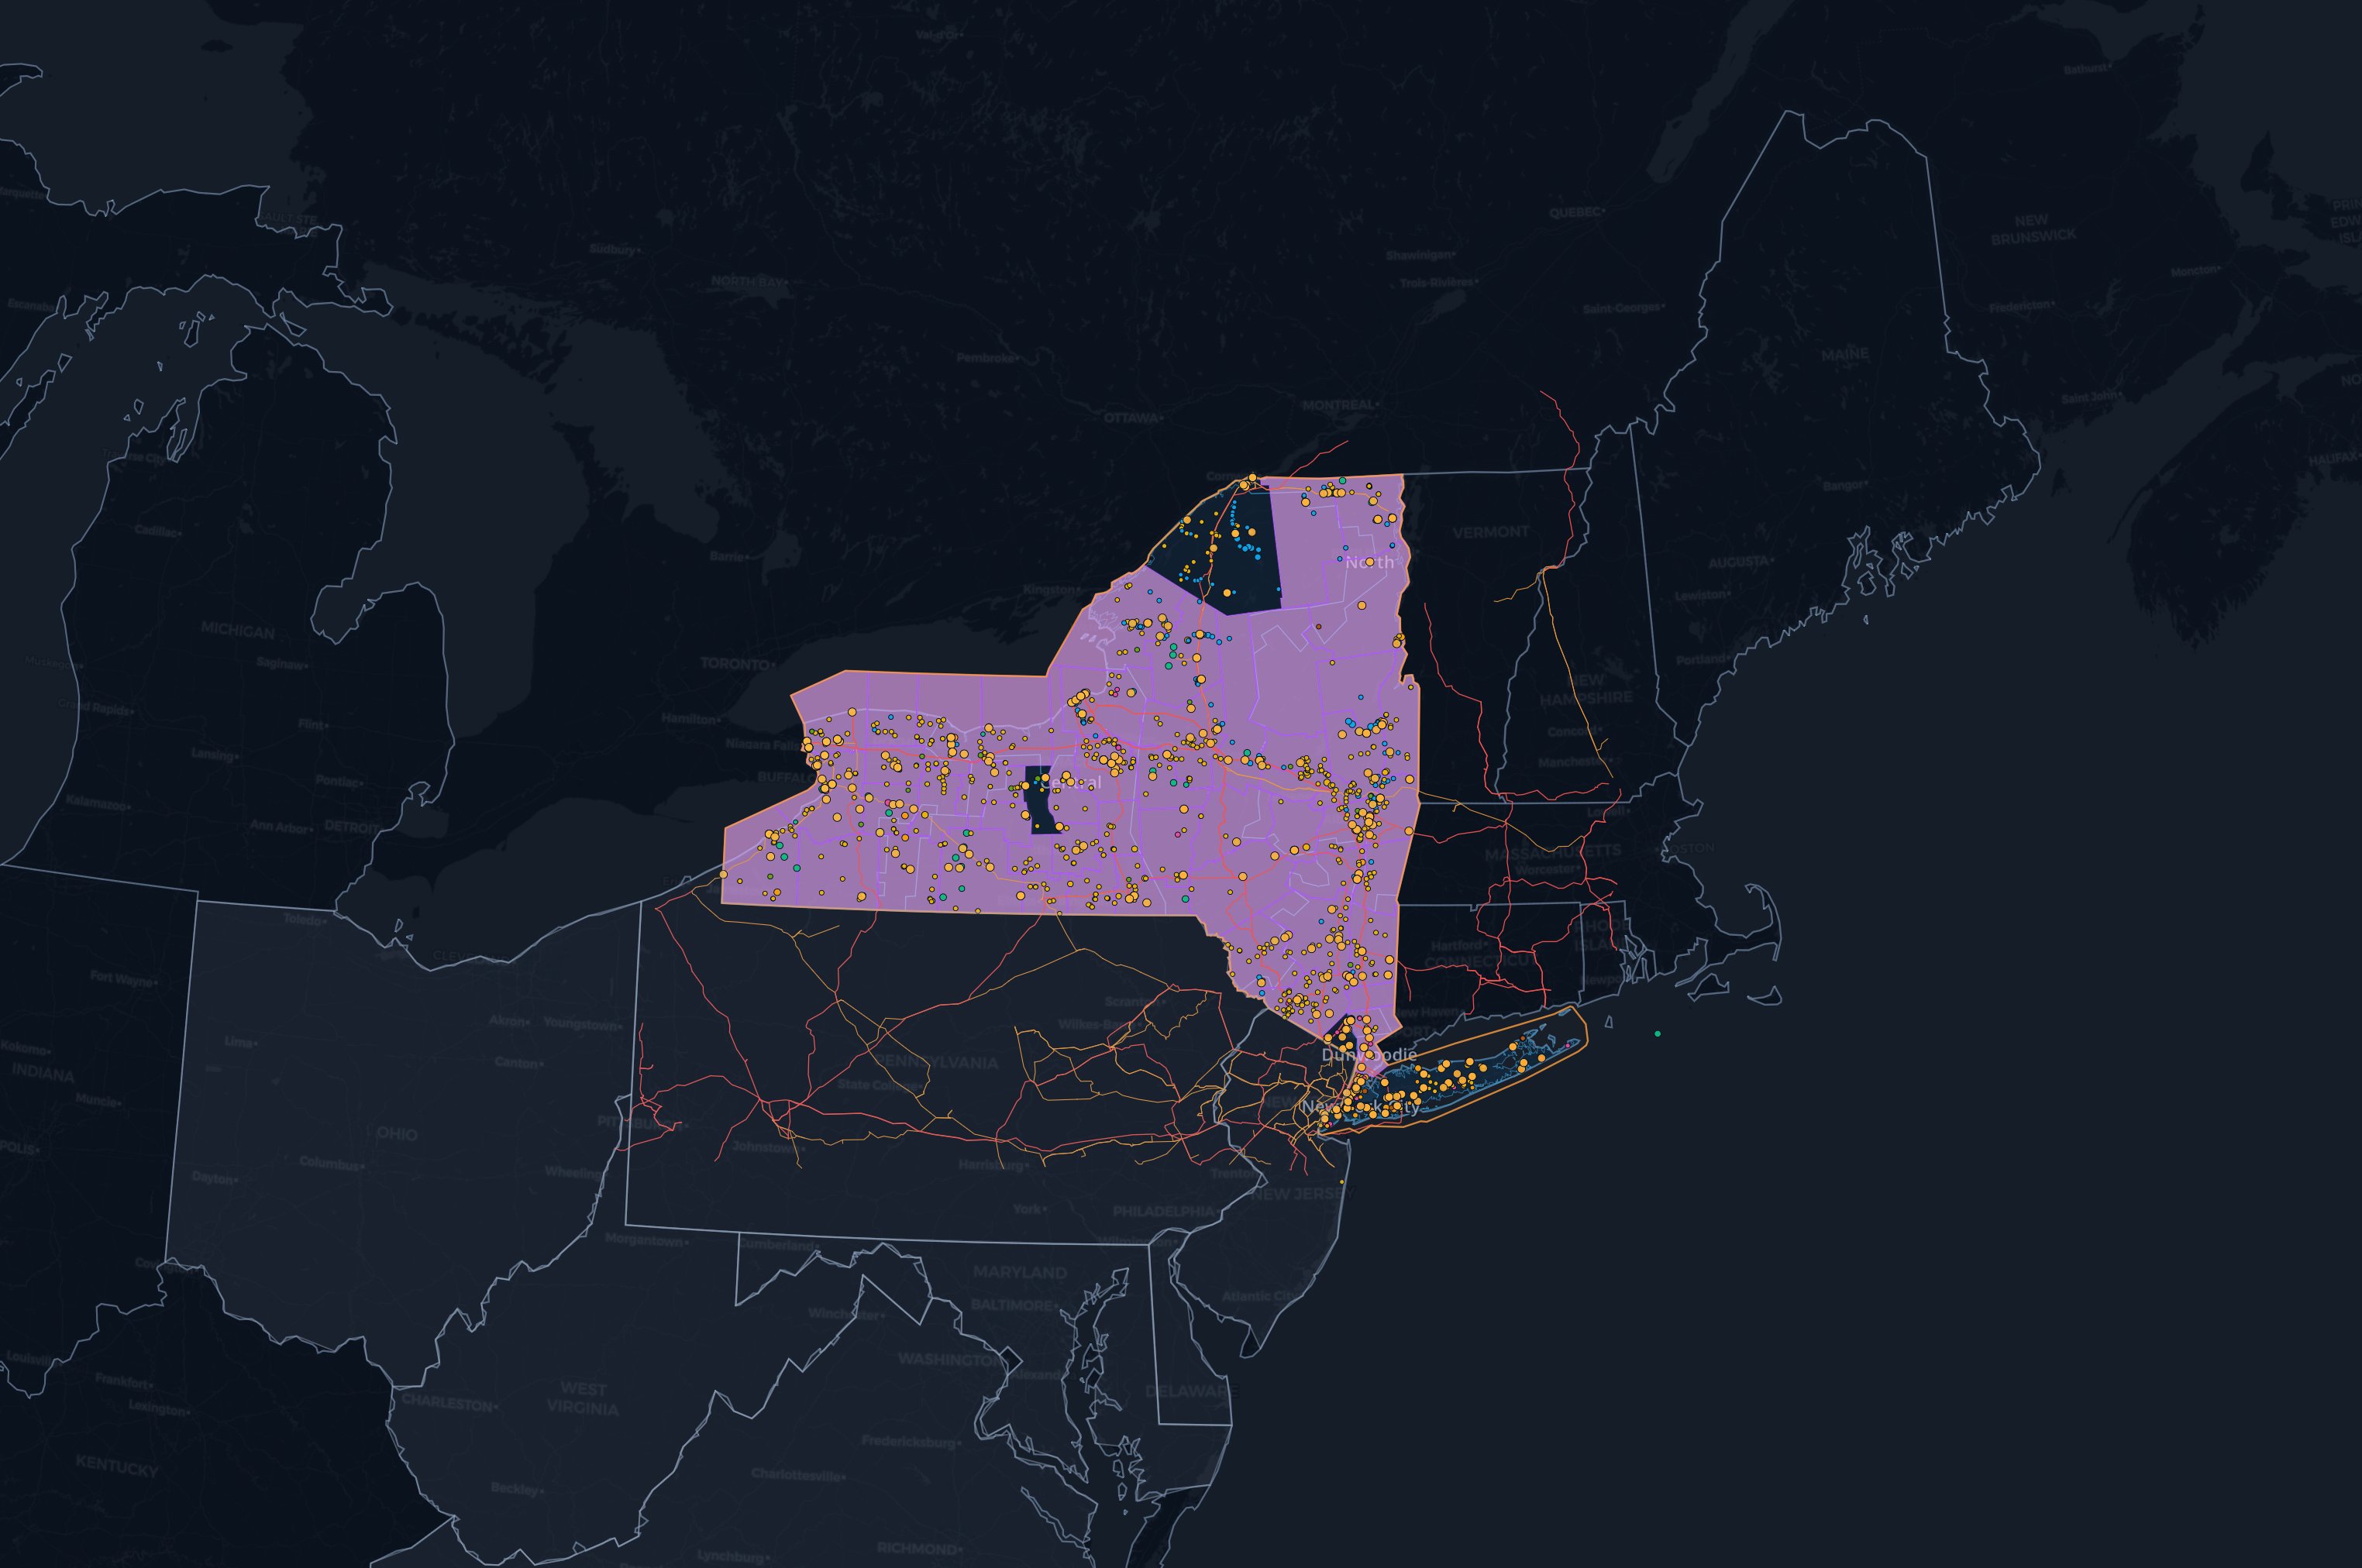
NYSERDA's IEDR rollup covers all 62 New York counties with DER counts, feeder counts, and hosting-capacity headroom. Total, ESS charge, and ESS discharge views expose the directional asymmetry that a single total can hide.
The source refreshes daily and supplies statewide coverage including National Grid and PSEG Long Island, whose own public layers do not provide the same statewide view.