Duke, Florida and Southern join the grid
Duke Carolinas, Duke Florida, FPL and Southern now have their own maps, with hourly demand, fuel mix, exchanges, plant output and, for Southern, regional auction prices.
The Southeast now has its own maps. Duke Carolinas, Duke Florida, FPL and Southern each open as a balancing-area workspace beside the organized markets, with the utility's plants, substations and transmission on the same map and the operating history behind them one click from any territory.
These are utility balancing areas, not wholesale markets. They have no locational price nodes, so each map is read through demand, generation by fuel, exchanges with neighbors and plant output, every reading carrying the clock of the publisher that reported it. Southern adds the one price it publishes: regional auction clearing prices.
Read the Carolinas as one map
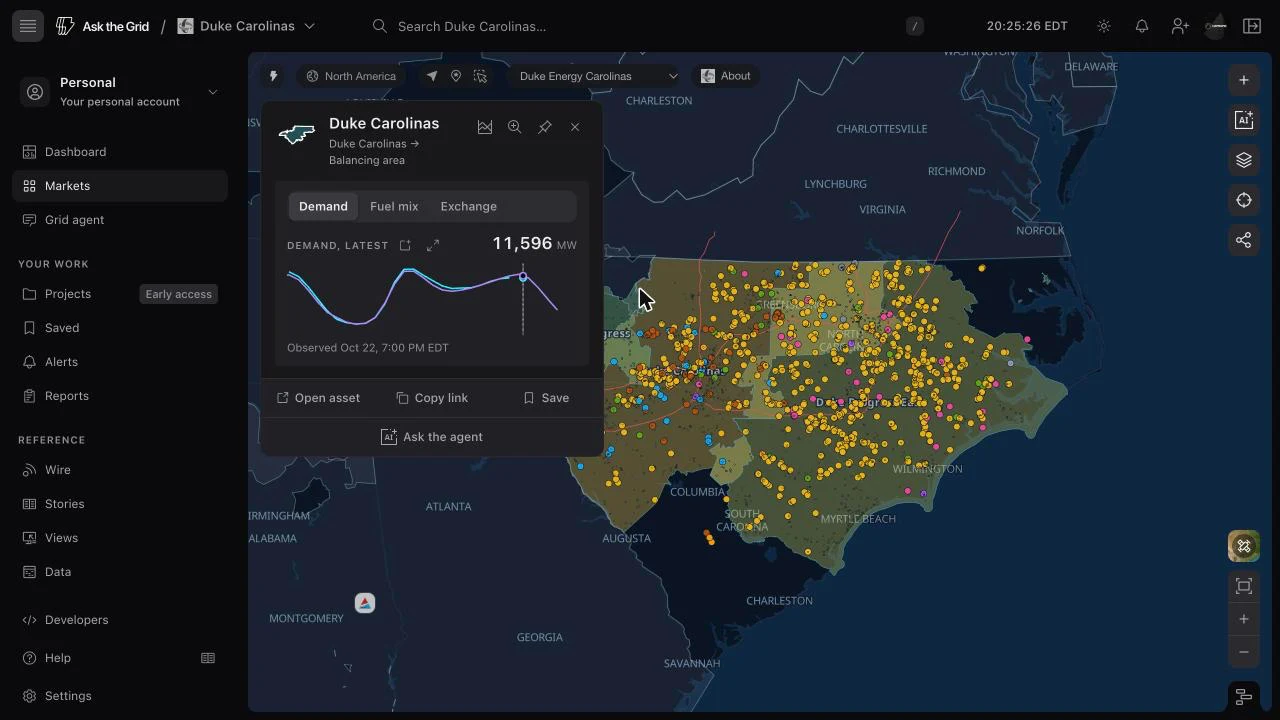
Duke Carolinas is one regional map holding Duke Energy Carolinas, Progress East and Progress West. Choose Operating area, or select a territory, to open its own hourly demand and forecast, generation by fuel and net interchange. The fuel menu offers the fuels the area actually reported over the past 90 days, including petroleum and pumped storage where they appear.
Territory outlines are approximate. Progress West uses the historical 2017 HIFLD control-area boundary; the other areas use filed retail territories.
Follow neighbors, plants and Florida
Duke Florida and FPL open as separate maps. Transmission, substations, generation footprints and mapped data centers come from the shared national infrastructure inventory, so a plant here carries the same card as it does on an ISO map: monthly EIA-923 output and, where available, daily NRC reactor reports as a percentage of rated power. Nearby assets show their distance separately from confirmed site records.
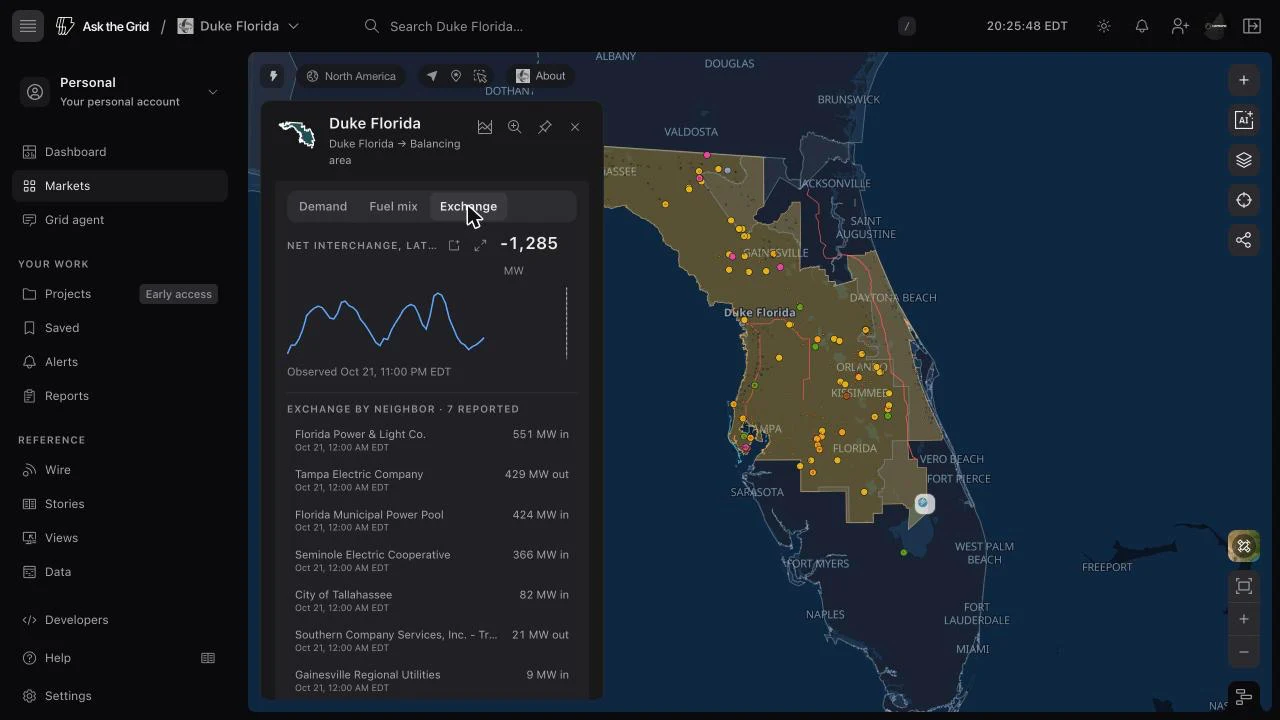
The Exchange tab on the area card lists each neighboring balancing authority with its own observation hour, and selecting a neighbor charts hourly interchange. These EIA-930 figures describe the balancing-area pair; they do not identify a circuit or its transfer capacity.
Read Southern's regional auctions
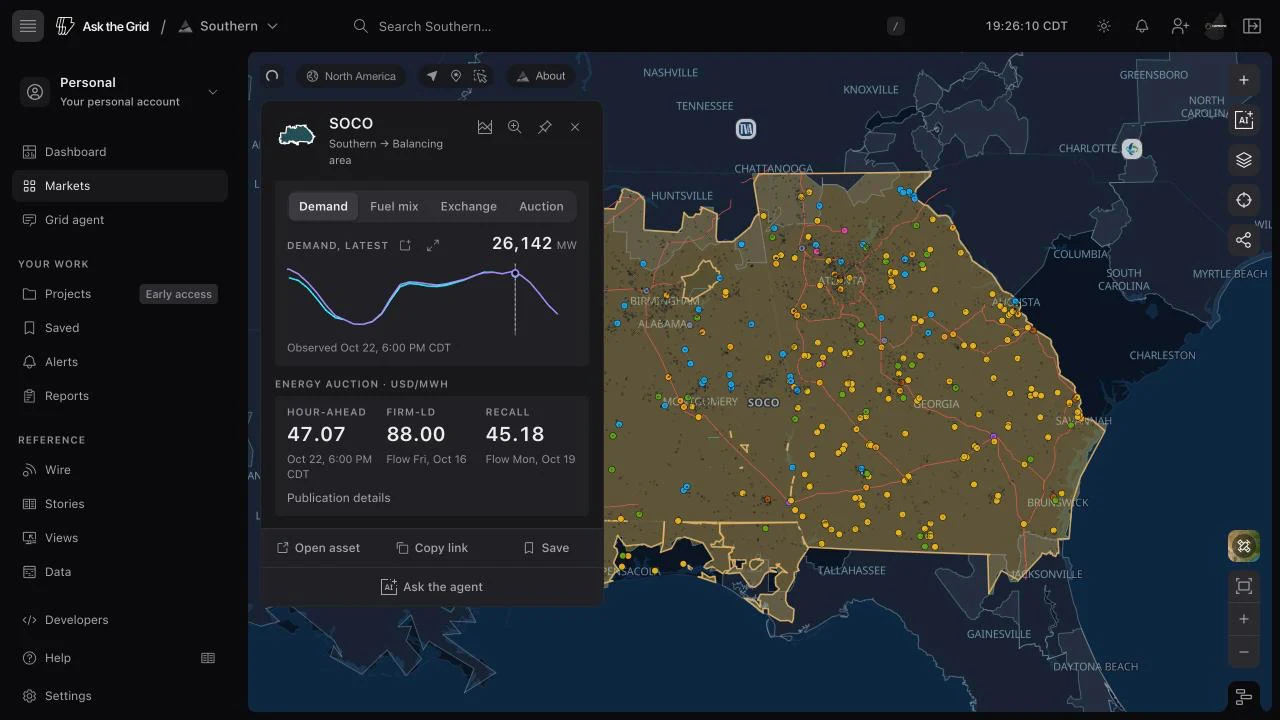
Southern is a native balancing-area map. Its card carries hourly demand and forecast, net generation by fuel, net interchange with each neighbor, and separate histories for the hour-ahead, Firm-LD and Recall auctions. Vogtle, Farley and Hatch add daily NRC unit power histories.
Southern auction prices are regional products: the latest published hour-ahead clearing price and the day-ahead Firm-LD and Recall block prices, in USD/MWh, each with its delivery date or hour. They do not assign a locational price to a utility or plant. The layer is on by default on Southern's own map and can be turned on from Map content on the North America map.