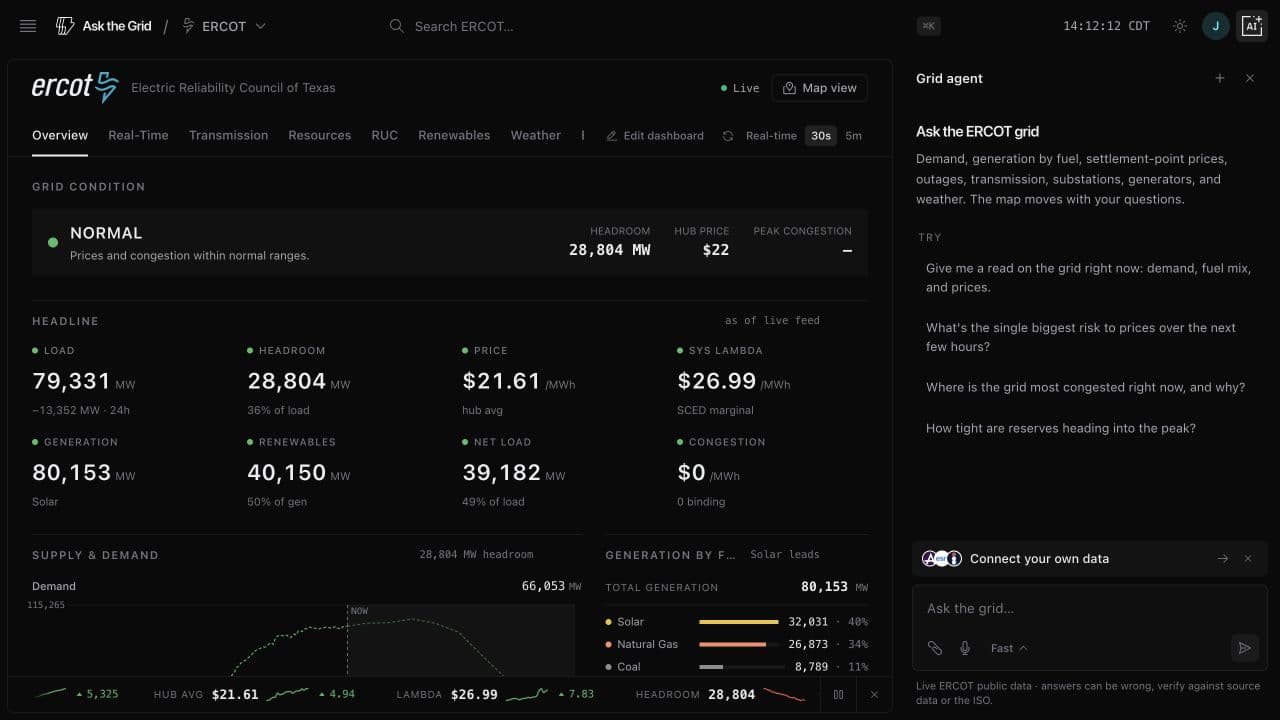
The ERCOT grid radar: a live operations cockpit
A dense, terminal-style radar view of the ERCOT grid — real-time load, prices, congestion, fuel mix, and eight operator desks, all on live data.
Open the radar for a control-room read of ERCOT at a glance: a derived grid condition, headline vitals (load, headroom, hub price, system lambda, net load, congestion), supply against committed capacity, generation by fuel, binding SCED constraints with shadow prices, hub and zone LMPs, DC-tie border prices, and RT-versus-DA basis — plus dedicated desks for Transmission, Resources, RUC, Renewables, and Weather, and a scrolling price ticker along the bottom.
Every number is live ERCOT public data; when a feed is briefly unavailable the widget shows an empty state rather than an estimate. Rearrange the widgets to build your own desk — layouts persist — and hand any widget to the agent to ask why the grid is doing what it's doing. The radar is live for ERCOT today, with more grids to follow.