Start with Ask the Grid
Open a market, follow one live question to its evidence, and set up the account and keyboard controls you will use every day.
Open a live grid- Status
- Live
- Access
- Public research · Free account for workspace
- Reading time
- 12 minutes
- Reviewed
- Sep 24, 2026
- Maintained by
- Product
Ask the Grid is a map-first workspace for the seven organized US power markets and the Bonneville balancing area. It keeps live market conditions, physical infrastructure, forecasts, public source data, and a source-backed grid agent in one place, so an investigation can move from a national view to one market, asset, interval, or cited dataset without changing tools.
Asset and forecast directories, market pages, stories, the first page of the Energy Wire, and the data catalog stay public and shareable. An anonymous browser can sample 2 unique asset or forecast details; a free workspace continues through every detail, opens the interactive maps, Grid Radar, Today, the full Wire, and the grid agent, then keeps Saved views, History, alerts, exports, and preferences together across devices.
On this page
Understand the workspace
The map, timeline, selected assets, and agent share one market and one operating context.
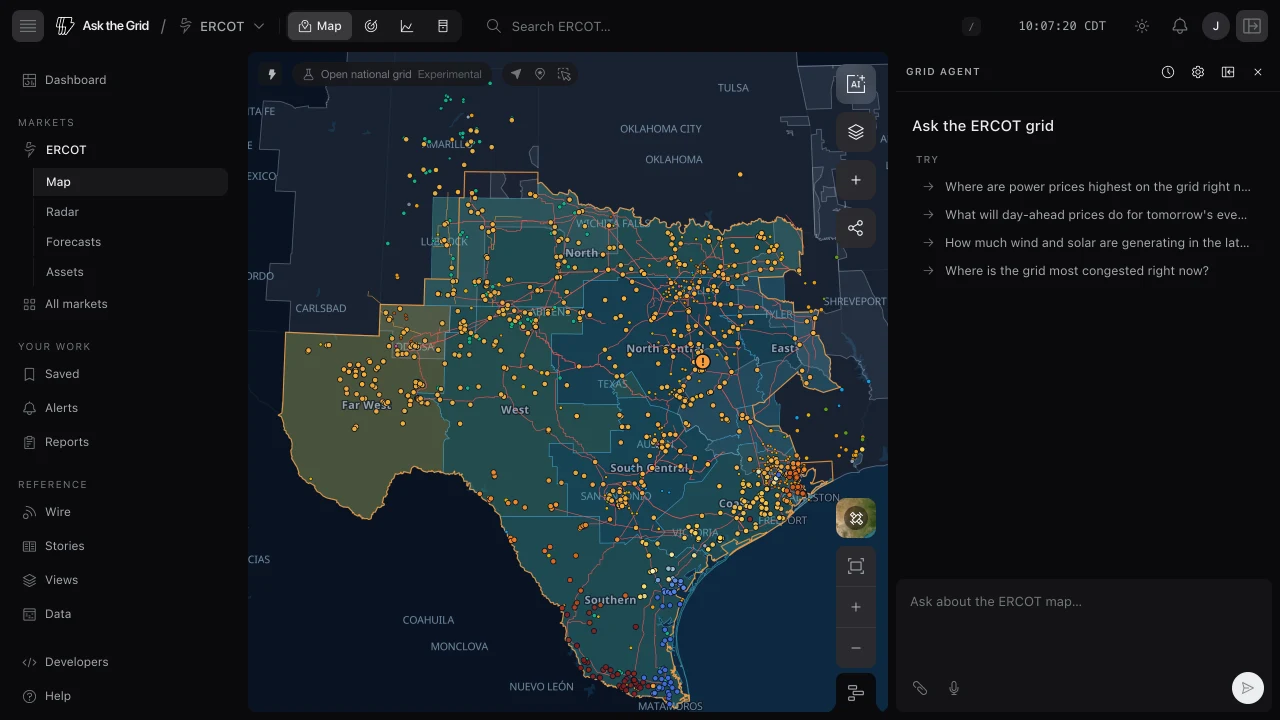
A national map with market-native detail
ERCOT, NYISO, CAISO, PJM, MISO, ISO-NE, SPP, BPA, and Baja California share one layer vocabulary for zones, price nodes, generation, transmission, weather, and other common concepts. Each market still retains its operator names, publication cadence, source links, and the layers its public feeds actually support. Choose United States in the left navigation to see every market on one map.
What stays public
Asset and forecast directories, market pages, stories, the first page of the Energy Wire, Help Center, and the data catalog work without an account. You can sample 2 unique asset or forecast detail pages before creating a free workspace; reloads and return visits to those details do not count again. A free workspace continues through every detail and opens interactive maps, Grid Radar, Today, the full Wire, the grid agent with up to 40 questions per hour, Saved views, History, alerts, embeds, and downloads. Persisted map links remain viewable as read-only shared findings.
Pick and switch markets
Choose a market directly or zoom out to move through the organized grid geographically.
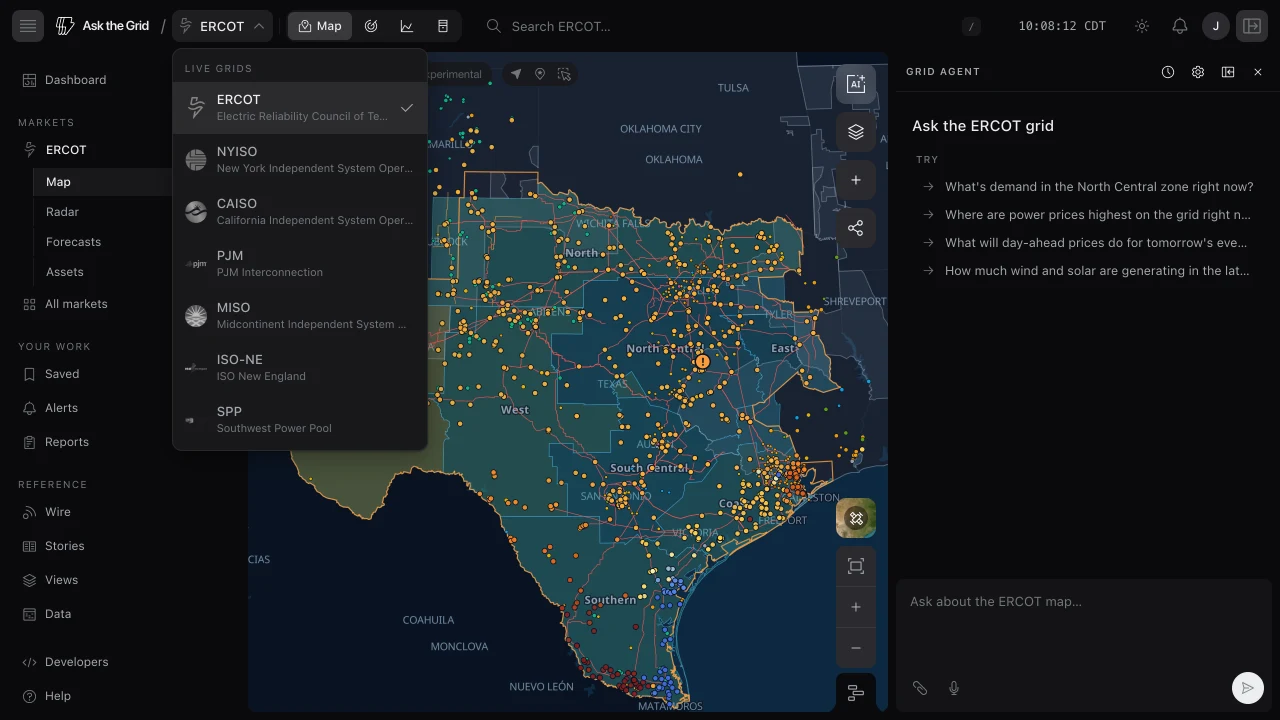
Choose a live grid
Choose a market from the Markets list in the left navigation, All markets, a Today market card, or a permanent market URL. The map opens on that operator with its supported live layers and the agent scoped to the same market.
- 1Choose ERCOT, NYISO, CAISO, PJM, MISO, ISO-NE, SPP, BPA, or Baja California.
- 2Open Map for geographic investigation or Radar for the market's operating desk.
- 3Confirm the active market in the header before comparing values or asking the agent.
Switch without returning home
Zoom out until the neighboring market regions appear, then select another region. The map address, visible market layers, and agent scope move together. Use the market switcher in the header when the destination is already known.
Complete a first investigation
The quickest way to learn the product is to trace one current condition from overview to source.
Follow a live question to its evidence
Start with a condition that matters now, preserve its market and time basis, then narrow the geography before asking for an explanation.
- 1Open Today and choose a ranked finding, or open a live market directly.
- 2Turn on the market, infrastructure, generation, reliability, or weather layer that carries the question.
- 3Select a plant, zone, price node, line, or queue project and read its current card.
- 4Move the timeline one interval or one day to establish a comparison.
- 5Ask the agent a scoped question and open the cited public source or catalog dataset.
- 6Save the view, create an alert, or turn the question into a report only after the scope is correct.
Keep node, hub, zone, and system values distinct; the selected market and location determine what a number means.
Account and settings
Free sign-in opens the interactive workspace and keeps it consistent across devices.
Create a workspace and keep your work
Continue with Google, continue with Microsoft using your work or school account, or use a passwordless email code sent to a permanent address; disposable email addresses are refused. All three run the same flow: it creates a free workspace or signs into an existing one, then returns you to the market or task you were exploring with Saved items, conversations, alerts, and account-level preferences restored. A question you asked the agent before signing in stays visible on the sign-in page and runs as soon as you are in. Microsoft sign-in asks only for your name and address — no directory, calendar, or mailbox access — and some organizations require an administrator to approve any application before staff can use it. If that happens, or if you decline the permission screen, the emailed code works immediately and needs no approval. An address that already has an account keeps that account: sign in the way you first did, or with the emailed code, and everything saved is where you left it.
Use an optional password
If you have set a password, open /login?auth=password to sign in with your email and password. The usual login page keeps Google, Microsoft, and email-code sign-in. Passwords are optional and never required during signup or workspace setup. To set or reset one, open Settings → Account and choose Password options under Security. If your last sign-in was more than ten minutes ago, confirm an email code in settings before entering a password. Existing /account/password links open these settings. Saving a password keeps this browser signed in with a new session and signs out other browsers; it preserves your Google account link, saved work, and existing access. Review accounts use this same flow and receive only their assigned product access.
Answer the guided setup
A new workspace opens a short guided setup before the product. It first asks what brings you here: following prices and congestion, watching plants and projects you are responsible for, keeping an eye on grid conditions, understanding the grid and asking questions, or building with the API. Next it asks which markets you work in; the starred one is where your home opens. When a market you add has a daily house briefing, such as the ERCOT Morning Briefing, that step also offers to email it to you each morning; it stays off unless you turn it on. Watching plants adds a search that saves them as a portfolio on your account. The last step asks what you do, with two optional taps for your role and company. Finishing opens the surface for the job you named: the map for prices or for understanding the grid, Radar for grid conditions, the developer platform for the API, and your dashboard for plants and projects. If you signed up from a specific page, it opens that page instead. On a new account, Skip setup opens the map, where the agent welcomes you. Run setup again from Settings → Advanced → Guided setup; your answers reopen in place and saved assets are left untouched.
Take the tour
The first time a new account opens a map, the agent panel greets it with a welcome and Show me around. Arrive with a question instead, and the agent answers it first, then offers the tour under its answer. The tour takes about a minute and plays on the live map: what the map is showing right now, how to switch layers, open each map tool and pin the ones you use to the dock, how to move the whole map back in time, and how to ask about the grid or about the product. Each scene ends with a button inside the message that moves on, and typing next does the same. Ask anything along the way; the agent answers, and the button to continue returns under its answer. If you leave, the tour keeps its place in this browser, and its last scene puts back the layers you had on. Start or continue it at any time from Get started, from Settings → Advanced → The tour, or from the agent panel's settings.
Work through Get started
New accounts see Get started in the left navigation: take the agent tour, see the grid live on the map and Radar, make it yours by saving something or creating an alert, explore the data catalog, and bring your team. Each row ticks itself once you have done it. The list collapses to its heading, and × closes it for good. Bring your team opens the invite dialog: colleagues get a free account, and each one who starts using Ask the Grid raises your hourly limit for agent questions. In an organization, it invites them as members instead.
Use Today as your starting point
Today opens on a live map of the market you track, or of every market you track at once, with a national view a click away. The card on the map is a briefing written for you from what the page shows, your saved assets and your recent questions. When an answer shows something on the map, it shows it on this map. Below it, a row you can scroll sideways holds the findings and events picked for you and questions to put to the agent, then your saved assets, findings, alerts, what just happened, grid events and the Energy Wire. On your first visit a Start here row names three ways in: see the market on the map, watch it in Radar, or ask the agent. Today & the Energy Wire covers each part in detail.
Use Settings
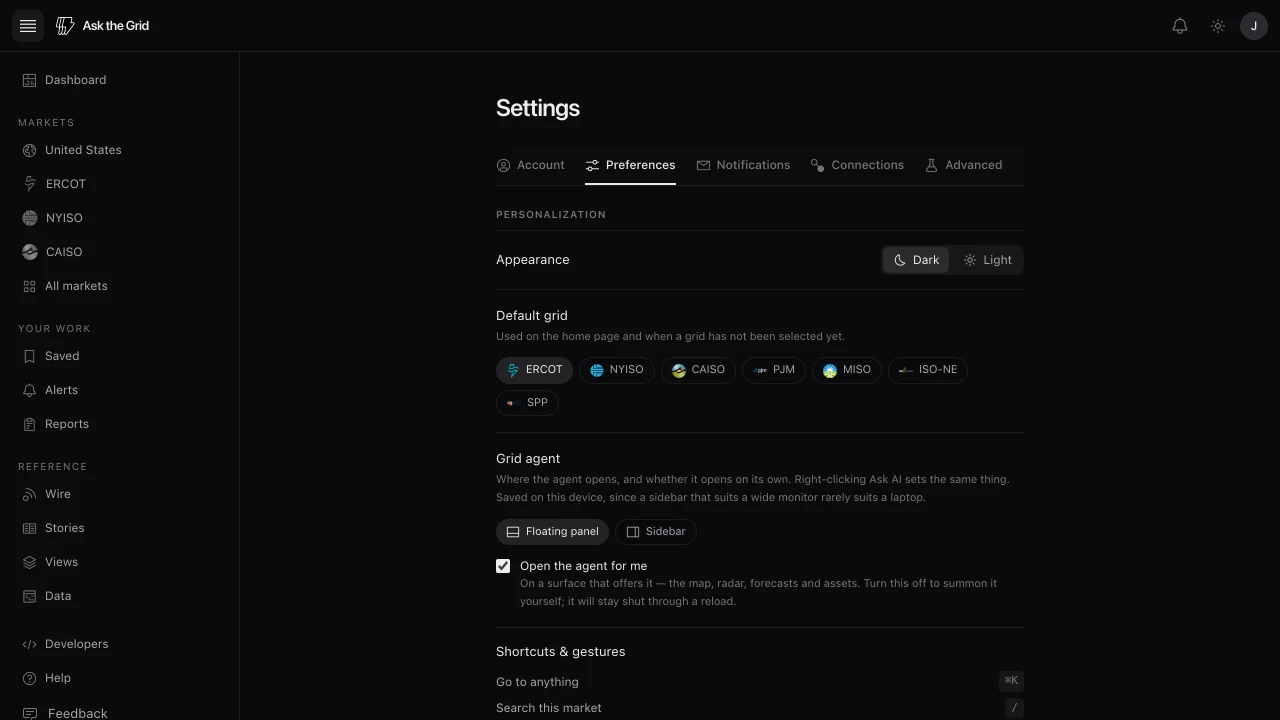
Settings → Organizations lets you select a workspace, manage members and accept invitations. Selecting a workspace does not share existing personal work or change your subscription. Settings has six sections. Account holds your profile photo, personal details, work and organization details, plan, active browser sessions, password options, and account deletion. Click your profile photo or drop an image onto the account header to replace it. HEIC and common image formats are supported, with rotation and zoom before upload. Choose Use photo, then Save changes. Profile photos are public; removing one from your profile does not revoke copies of its image URL. Preferences holds the theme, default grid, keyboard shortcuts, and the grid agent: how it answers you, saved to your account, and where it opens, saved on this device. Notifications has three parts: Destinations, where alerts and shared answers are delivered (account email, the in-app feed, SMS, Slack, and Microsoft Teams); What you receive, which summarizes your alerts and reports with links to manage them and switches Stories and product emails on or off; and All email, with Unsubscribe from all emails, which stops everything except sign-in codes and security notices. The gear in the notification bell opens the same page. Every product email also carries two links: one stops product emails only, the other stops all email. Connections lists connected MCP clients. Advanced holds guided setup, the tour, agent diagnostics, and early-access experiments. You can sign out one browser session or every other session, and security-sensitive actions such as deleting the account can ask you to sign in again. History and team invitations are in the account menu under History and Invites. On smaller screens, use the section picker to move through the same controls.
Know when Enterprise applies
Enterprise workspaces add shared team workspaces, unlimited agent queries, private operational data from systems such as AVEVA PI, Esri ArcGIS Utility Network, and ETRM platforms, SSO, and private-deployment options. Public grid intelligence stays open, and the core interactive workflow remains available on Free.
Keyboard shortcuts
These are the shortcuts the product binds. Press ? inside the product to open the same reference.
⌘K — Go to anything
Open the command palette from any page — markets, surfaces, forecasts, published views and your own work. In a market it also finds that market's nodes, plants and substations; on a radar it lists that cockpit's desks. Ctrl+K works on Windows and Linux.
/ — Search this market
Focus the grid search for the market you are in, without using the command modifier.
⌘L — Open the agent
Open the agent and move focus to its composer.
Tab — Send the search query to the agent
While grid search is open, hand the typed query to the agent for a full answer.
← → — Step the timeline (when open)
Move backward or forward by one available timeline interval while the timeline dock is open.
Esc — Clear selection / close the open panel
Close the active overlay or dock first, then clear the current map selection.
? — Show keyboard shortcuts
Open the in-product shortcut reference.
Shift-drag — Box-select multiple assets on the map
Draw a rectangle around several visible assets to select them together. A free account is required.
Shift-click — Add an asset to the selection
Add or remove one asset without replacing the rest of the current selection. A free account is required.
Did this guide get you unstuck?
One click is enough. No message or account required.