Read the price distribution with Metis 1 Preview
Explore probabilistic nodal forecasts, inspect their issue time and source, and compare completed hours using the model vintages available before delivery.
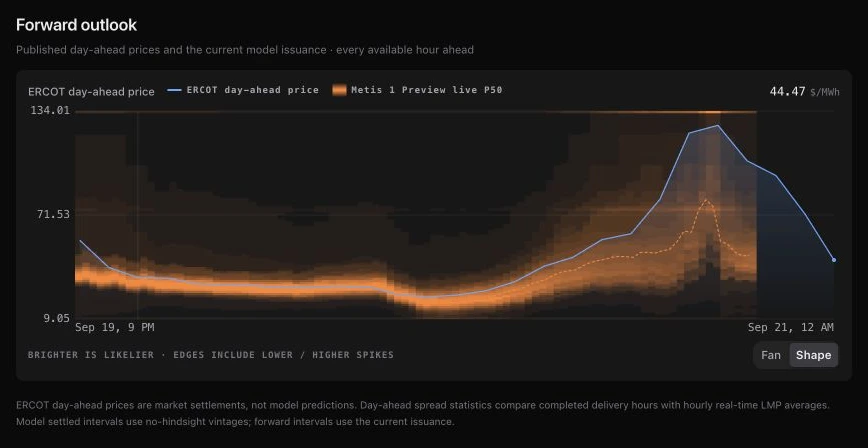
Metis 1 Preview brings a distribution of possible prices into the grid workspace. At supported pricing locations, inspect the forward outlook alongside published day-ahead prices, switch between probability density and nested uncertainty ranges, and open the series details to see which issuance produced the forecast.
The same workspace separates forward research from settlement review. Future intervals use the current model issuance; completed intervals use forecasts available before delivery. Market prices retain their identity as cleared settlements, giving you a consistent basis for reading the outlook and subsequently examining what happened.
Explore the shape of the outlook
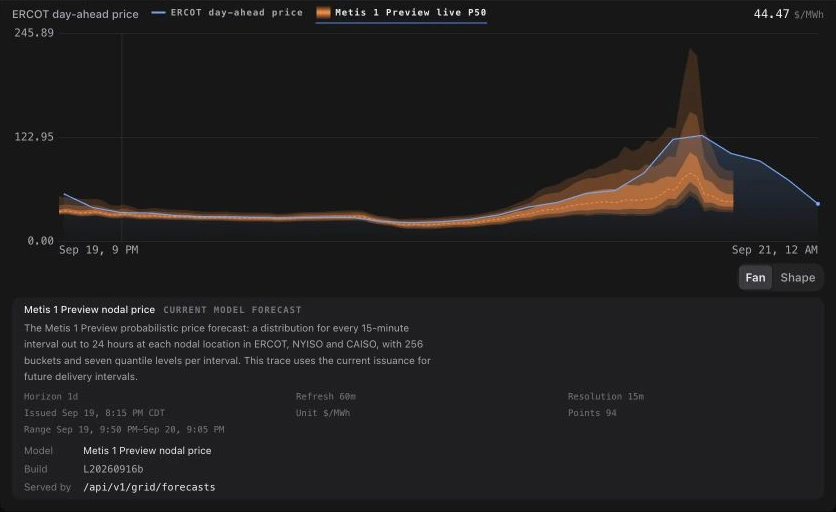
Open a supported pricing location’s Performance section and find Forward outlook. Shape uses density shading to show where the forecast places more probability and where it retains possible lower or higher price outcomes. Fan presents the same uncertainty as nested ranges.
The chart retains the published day-ahead series beside the model. Read the legend and the visible horizon together: the market settlement and model issuance may cover different intervals. Their lines end with their available data.
Keep the vintage attached
Select the model series label to inspect its source details. The panel identifies issue time, model build, units, resolution, refresh cadence, and the interval covered by the trace. In the captured North Hub example, the preview exposes fifteen-minute distributions over a twenty-four-hour horizon.
Forecast access and supported locations follow the preview’s current availability. The developer console provides the model specification and Forecast API workflow for applications using the same forecast system. Check those surfaces for the coverage and access appropriate to your account.
Review the hours that actually settled
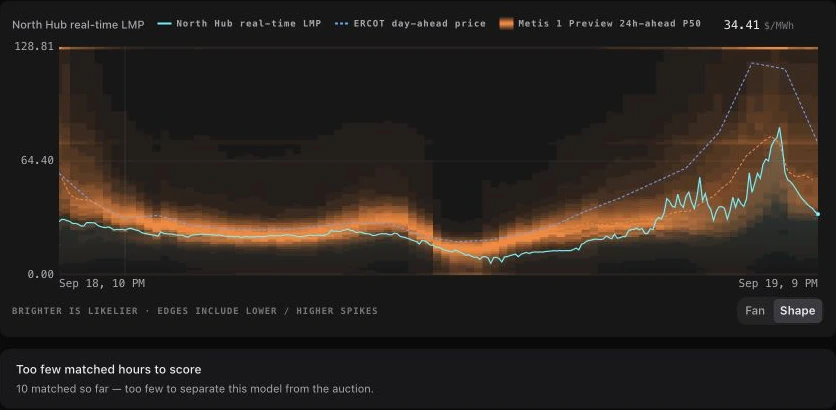
Settlement review aligns observed real-time prices, cleared day-ahead prices, and model forecasts available before delivery. Its trailing window and series labels state the comparison being made, keeping later model updates out of an earlier forecast’s evaluation.
Scoring depends on matched observations. When there are too few matched hours, the page says so and retains the chart for inspection. Use the available sample and the stated vintage basis when interpreting any reported metric.