Forecasts & the archive
Browse the public forecast archive, inspect operator-native horizons and sources, read net load, and compare the vintage available then with what happened later.
- Status
- Live
- Access
- Public archive · 2 detail samples · Free account after
- Reading time
- 14 minutes
- Updated
- Oct 14, 2026
The forecast archive brings demand, net load, price, wind, solar, grid-conditions, outage, and temperature outlooks into one public directory across the organized markets and the Lower 48. The archive stays open; an anonymous browser can sample 2 unique asset or forecast detail pages before creating a free account. A shared page structure makes the products navigable, while issuer, issue cadence, valid horizon, market timezone, units, source, and coverage remain operator-specific.
Historical evaluation preserves the vintage that actually existed at the chosen issue time. Observations, day-ahead market values, operator forecasts, derived net load, and model forecast series remain visibly distinct, so later information does not improve an earlier forecast after the fact.
Metis is Parisi Labs' family of world models for physical systems, starting with energy. Metis 1 Preview is the current generation presented in Ask the Grid for electricity-price forecasting. Each forecast retains its producing source, model version, and issue time. Target resolution, issuance cadence, and Today refresh are separate clocks. In the chart’s forecast details, check issue age and the recorded origin-to-mirror delay before a short-horizon decision; Each forecast retains its producing source, model version, and issue time; the Metis model overview explains the preview's inputs, outputs, and supported markets.
On this page
Forecast access through your organization
Recognize organization access
An organization can give its members access to forecasts for specific settlement points. Choose that organization as your workspace to use its current grants. A licensed forecast shows ‘Access through’ and the organization’s name beside the chart legend, including in Chart Studio.
See what is included
Select the access label to see why you can view the forecast and open the organization’s Included access summary. That summary lists the licensed market nodes and API key access. Your API keys remain individual credentials acting in the organization; membership and current grants determine what each request can read. Open hub forecasts remain available through the open tier.
Browse the forecast archive
Start with the decision—demand, prices, renewables, grid conditions, outages, temperature, or net load—then choose the market and exact published product.
Filter by forecast family
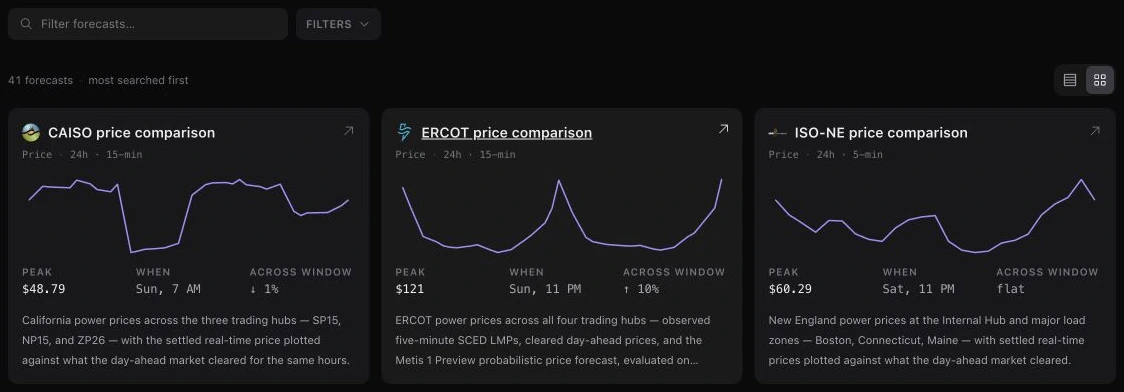
Search the archive, or open Filters to narrow it by type—demand, price, wind, solar, grid conditions, net load, outages, or temperature—and by market. Switch between table and card views; each row's shape, peak, and change across the window summarize the same points drawn in its preview chart, so open the page before using the peak or change in a decision.
- 1Open Forecasts from the market tabs in the header.
- 2Search, or open Filters to choose a type and market.
- 3Open the exact product to confirm issuer, issue time, horizon, timezone, and source.
Use a permanent market archive
A market's Forecasts tab opens the complete forecast set for that operator rather than choosing one product to represent it. Bookmark that route when the recurring job begins with one market and several forecast families.
Read national load and net load
Treat the national view as an assembly
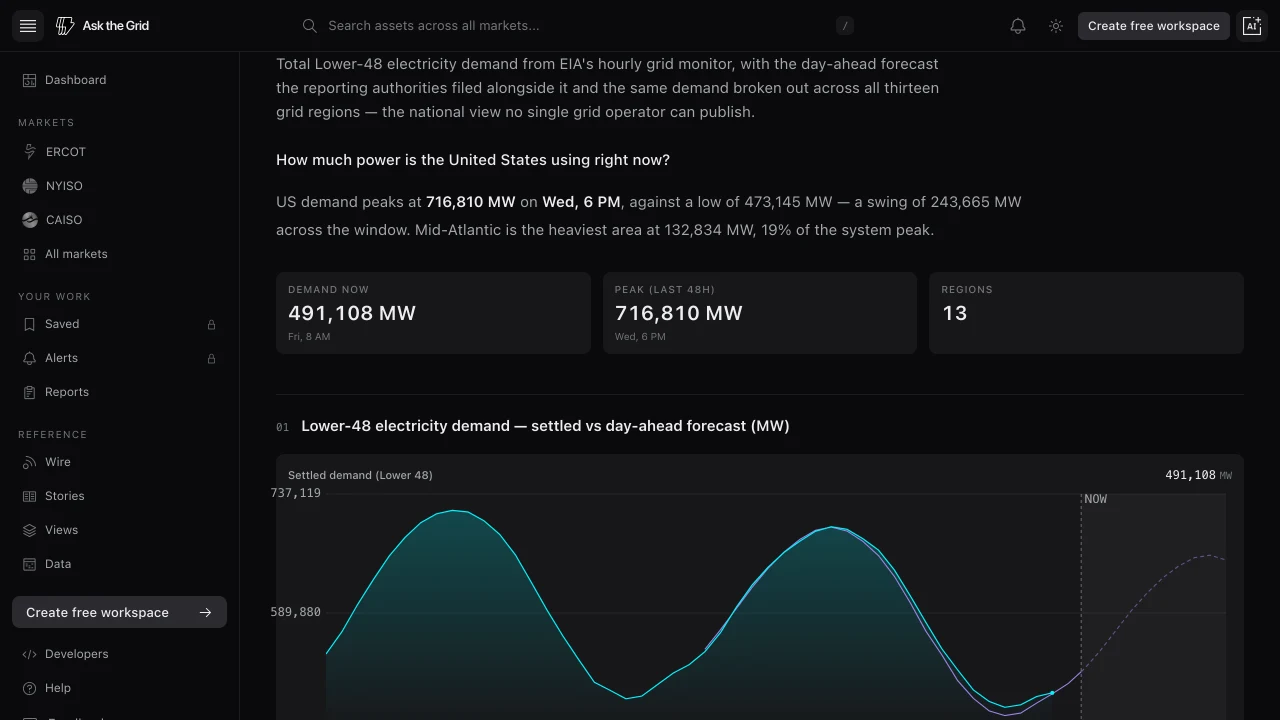
US grid load combines EIA's Lower-48 hourly demand with the day-ahead forecasts filed by balancing authorities and a thirteen-region breakdown. Not every authority files a forecast, so the day-ahead line covers a reporting subset and reads below total demand. It is a national view of several reporting systems, not a forecast issued by one ISO or balancing authority.
Check every net-load input
Net load subtracts the published wind and solar forecasts from published demand. The page plots demand, wind, solar, and the derived result together so the calculation can be checked. The series runs only as far as all three published inputs overlap and is recomputed when any of them is republished.
Net load is a calculated forecast series; it is not the operator's label unless the source itself publishes that product.
Read forecast charts
Observed, day-ahead, and model series
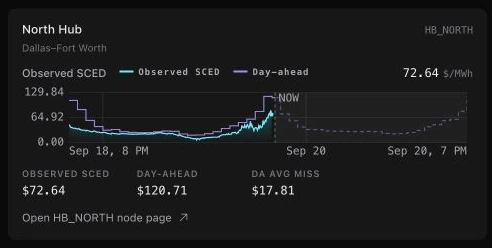
Forecast-capable charts keep realized values beside the available forward-looking sources. The legend names each series, and the line treatment separates observed data from forecasts.
Know where the future begins
A visible time split marks the boundary between realized history and the forward horizon. The current-time marker stays pinned to the realized series instead of appearing twice.
Inspect and zoom
Hover for the timestamp and value, use the legend to show or hide a source, and drag horizontally across a chart to zoom into a smaller interval. Double-click or use Reset to return to the full window.
Reset an expanded chart
At the top right of an expanded chart, beside Close, a row names everything you have changed: a past window, a longer span, a pinned time or forecast run, a zoom, or hidden lines. Each has its own × to clear just that. Reset view clears all of them at once and returns the chart to live, one day, with nothing pinned or zoomed. Double-click the plot, or press R, to do the same. Esc resets a changed chart first and closes it on the next press. Closing the chart also resets its view; a pinned forecast run stays on the map card, with Clear beside it.
Link, at the bottom of an expanded chart, copies a link that keeps its window, span, zoom, and pinned run, so the person you send it to opens the same view.
Compare a historical forecast
See what the model knew then
Signed in, a settlement point the model covers anchors its forecast to the run issued at or before the map time. Move the timeline into the past to load that original run and place the real-time prices that later settled beside it. The open tier includes ERCOT trading hubs and load zones and CAISO trading hubs. Individually granted or organization-licensed locations can also be replayed; broad Enterprise access opens every covered node.
- 1Sign in, then select an ERCOT trading hub or load zone, or a CAISO trading hub, on the map.
- 2Move the timeline back to the forecast issue time you want to review.
- 3Compare the historical forecast with the realized prices that followed.
- 4Reset to live to return to the current forecast run.
The historical view does not blend later information into the original forecast.
Draw one past run on a map chart
Map charts start with the current run from now forward. Click before now to pin the run issued most recently at that moment; click after now to pin the current run. Run issued identifies its date and time in the expanded chart. Hover for its P05–P95 range: readings use the pinned run within its horizon and the current run beyond it.
- 1Select a price node the model covers, then click the chart, or expand it and click there.
- 2Hover the run's horizon to compare its range with the prices that settled.
- 3Use Earlier run and Later run to step through vintages. Clear the run with × on its chip, Reset view, or Clear on the card.
Choose which past forecast to draw
In a node page’s settlement review, Day ahead draws each settled hour from the newest run issued before that day’s day-ahead auction closed: the forecast a day-ahead bidder could have used, on the auction’s own information deadline. Latest uses the newest run issued before that interval. Both use the current run after now; captions name the historical lead. Switch to Latest to inspect late revisions. The comparison with the auction below the chart always scores the Day ahead reading, over the last week, on the build serving now. It also says how often the model called which side of the cleared price real-time would settle on, the call a day-ahead position is paid on. The same hour yesterday sits beside them as the floor any forecast should clear. Open Hours before delivery for a second table that reads the model one and six hours before delivery against what you would otherwise hold then: the cleared day-ahead price, the last hour, the same hour yesterday and, in ERCOT, ERCOT's own indicative price an hour out.
- 1Open the settlement review on a node page.
- 2Select Day ahead or Latest beside Fan and Shape.
- 3Hover a settled interval: the readout shows the issue time of the run that drew it.
Your choice is remembered in this browser and applies to every forecast chart.
Replay a forecast page
On forecast pages that compare more than one forecaster, the track record section jumps to Now, 6h ago, 24h ago, 3d ago, or 7d ago. Each choice re-renders every forecast as it was published at that moment, beside what actually settled. On price pages, Metis 1 Preview is one of those forecasters when you are signed in; signed out, the page shows the operator and market forecasts and a Create free account prompt under the chart.
Read the scorecard
How each forecast has done ranks each forecaster by its average miss against settled values; a quantile score appears only for forecasts that publish quantiles. Check the basis line under the scorecard: a day-ahead basis freezes each forecast as it stood 24 hours ago and scores every hour that has settled since, while a latest-vintage basis scores the most recent publication, which benefits from later information. On price pages the scorecard covers the last week, with Metis 1 Preview read as it stood when each day’s auction closed. The comparison with the auction above it scores the model on its whole distribution against the strongest of three forms of the auction: as cleared, with its running bias removed, and dressed with the spread of its own earlier errors. It names a leader only after seven complete operating days on one model build, and it shows the record whichever side is ahead.
Read the forecast shape and annotations
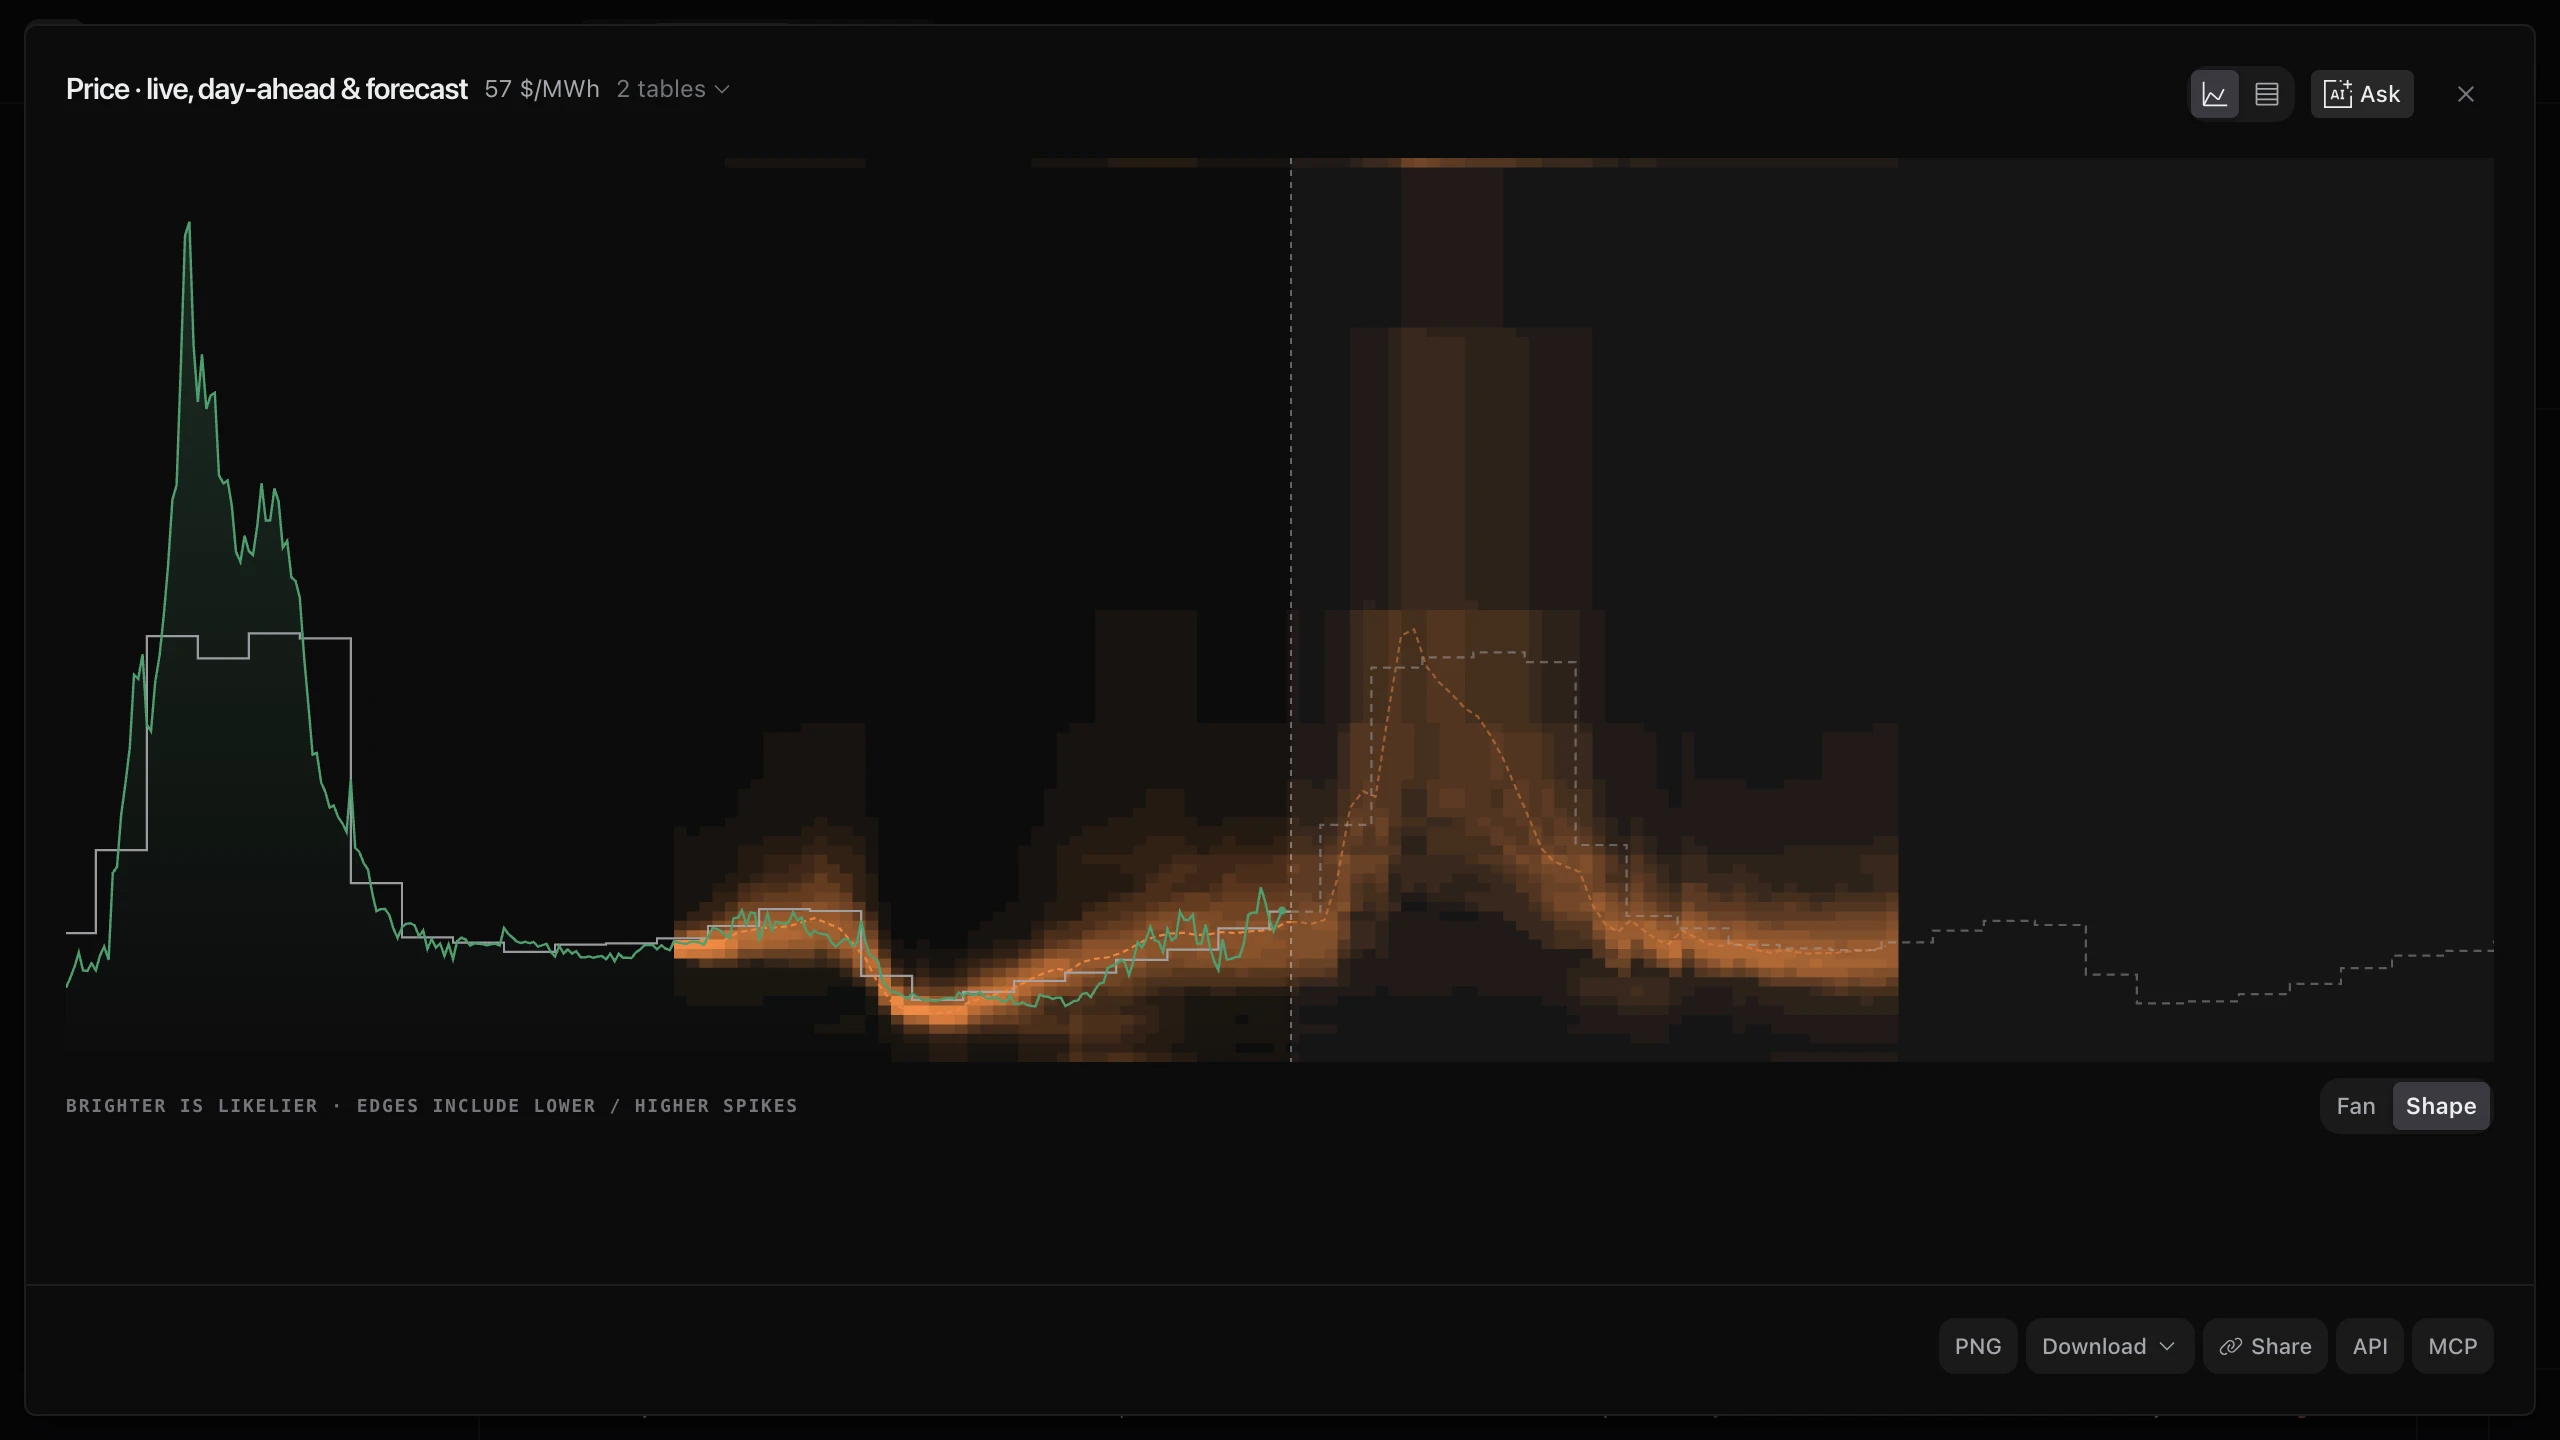
Select Shape to see probability density: brighter areas are likelier, and separate bright areas show several likely price ranges. Where the full distribution is unavailable, Shape uses published quantiles. Fan shows nested ranges; hover over a price for its exceedance probability. In an expanded chart, Signals marks node events, the strongest median peak, and the widest P10–P90 spread. Coincident signals share a marker. Hover or focus for details, select to pin, or turn Signals off.
Open model details
Select the info control beside a model series in the chart legend to review its description, horizon, refresh cadence, resolution, and issue time, with a link to the model's page. A Metis 1 Preview run reaches 48 hours ahead, and its intervals lengthen with lead: five minutes for the first two hours, fifteen minutes for the next two, and hourly after that.
Inspect and export the plotted data
Open a price chart in Chart Studio and switch to Data for the values behind its displayed series. The table and CSV keep timestamps, units, forecast ranges and issue times where the series supplies them. Access to a forecast location is checked before the series is loaded; the table reflects the forecast you can view. Choose CSV to download the values, PNG for a branded image, or API and MCP for a request for the same series. Keep the issue time and delivery time with exported forecasts so a later run is not mistaken for the vintage originally reviewed.
Model forecast series
Keep model and market series distinct
Model series appear on live cards, node pages, price forecast pages, and Radar beside, never in place of, operator forecasts, day-ahead market values, or observed outcomes. Use the series info in the chart legend for issue time, horizon, and refresh cadence before comparing it with another source.
See what informs a node, then choose your next check
On a supported node's map card or asset page, open Where Metis is looking to see what informs that node, as Metis learned it: the weather, load, generation and other nodes it moves with, ranked by share. Informed by lists what the node leans on; Informs lists the nodes that lean on it. Grid conditions covers nearby prices, weather, load, and regional and system conditions; Prices only covers neighbouring nodes and day-ahead series. Choose Any horizon or a lead-time range, then select a related node to continue the investigation. Show on map in the Here panel opens the same X-ray lens on the map, and the agent can open, repoint or close it when you ask. Shares describe what a node moves with, not what causes its price: use them to choose the next chart to open, and ask the agent to check current conditions.
Who sees model forecasts
Metis 1 Preview forecasts prices across US power markets, and needs a signed-in account. The CAISO run includes covered nodes in BPA's Western Energy Imbalance Market territory; the BPA map reads that run for its price nodes and forecast volatility layer. The agent can read those node forecasts and rank BPA nodes by uncertainty, upside or downside; a BPA ranking stays within BPA settlement points rather than including the whole Western market. Ask for a particular delivery window, such as tomorrow from 6 to 10 PM Pacific, to rank only that period. The answer reports when the selected run ends; partial coverage cannot establish the ranking for the rest of the evening. BPAT classification identifies a settlement point in the balancing area, not ownership of physical equipment. A free account sees the model at ERCOT's trading hubs and load zones and at CAISO's trading hubs. NYISO has no free locations: every NYISO point the model covers is a generator. PJM has no free locations either; its forecasts are read by pricing node and scored against PJM's hourly real-time price. At any other settlement point the forecast shows as a locked notice with Get this forecast, which asks us for that location. Additional locations require an individual grant, an organization licence or broad Enterprise access. API-key approval lets you create credentials; the key reads the locations its owner can access in its organization and does not unlock every node. Signed out, pages show a Create free account prompt where the forecast would be.
On a map card, the forecast is its own Price forecast section under Price detail: open it for the next 24 hours' P50 high and low and the typical P10–P90 range, or for how to get the forecast at that node. On node and forecast pages, dismiss a prompt with its close button and it shrinks to one line for 14 days.
Ask why the model expects a price
Expand a map location’s chart, right-click the model in Shape or Fan, and choose Why this forecast? The agent uses that interval, run, and price band to compare probability, earlier runs, market-wide changes, and recent error at the same lead. It checks day-ahead, demand, renewables, outages, and weather published before the run. These connections are the agent’s interpretation; the model does not report its reasons. Choose Attach to question to add the interval to your next question instead.
The agent reads the forecast at the same locations your plan includes.
Know when the model calls a spike
Radar and Today raise a forecast finding when Metis 1 Preview's median puts a location past its market's extreme real-time price line, or below its negative-price line, while the location's own price is still on the near side of it. Read a forecast finding, in Today & the Energy Wire, explains how it is judged.
Read about Metis 1 Preview
Metis 1 Preview is the Energy Foundational System Model. Its page covers what it forecasts, its inputs, and its limitations. On any chart or API response, the forecast's own source details name the model, coverage, interval, and issue time.
Historical forecasts keep the model version recorded when they were issued.
Check how the model has scored
Forecast accuracy at askthegrid.com/forecasts/accuracy scores every published forecast against what settled over the last 24 hours, with one section each for price, demand, wind, solar, and grid conditions. Price lists markets against forecasters: the day-ahead auction first, as the reference, then a column for Metis 1 Preview with its score over the last week, read as it stood when each day's auction closed, and an Against the auction column that names a leader once seven complete operating days have settled on one build. The other sections rank each market's forecast by error, the total miss as a share of the total actual, beside its average miss and bias in the grid's own unit. Forecasts that are never scored, such as net load and outage schedules, are listed at the end with the reason. Signed out, Metis 1 Preview's cells read Sign in to see; signed in, the price section also shows how often its p10-p90 range contained the real-time price over the same week, on the build serving now.
A band that is built to contain 80% of outcomes and contains far fewer is too narrow, and one that contains far more is too wide. The page names that gap beside each hit rate rather than leaving you to work it out.
Did this guide get you unstuck?
One click is enough. No message or account required.