Modeled line ratings across every US power market
A new opt-in experiment screens overhead transmission lines with a temperature-adjusted conductor estimate across all seven organized US power markets.
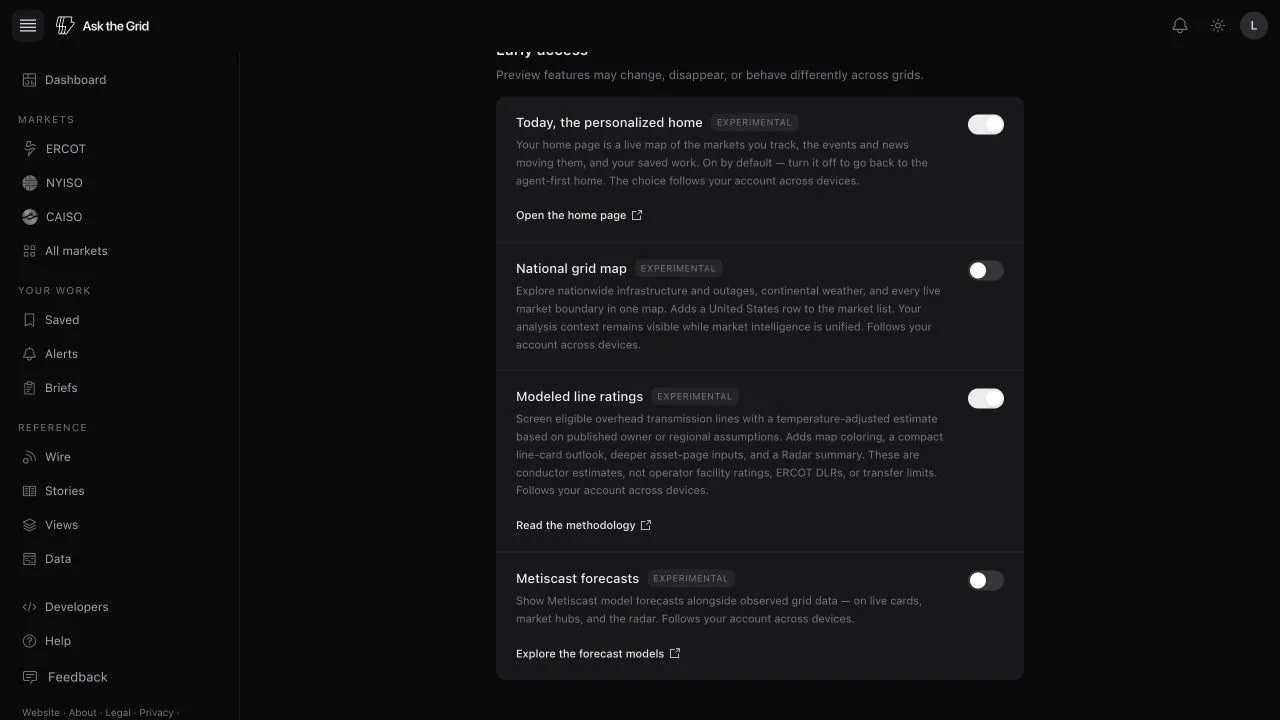
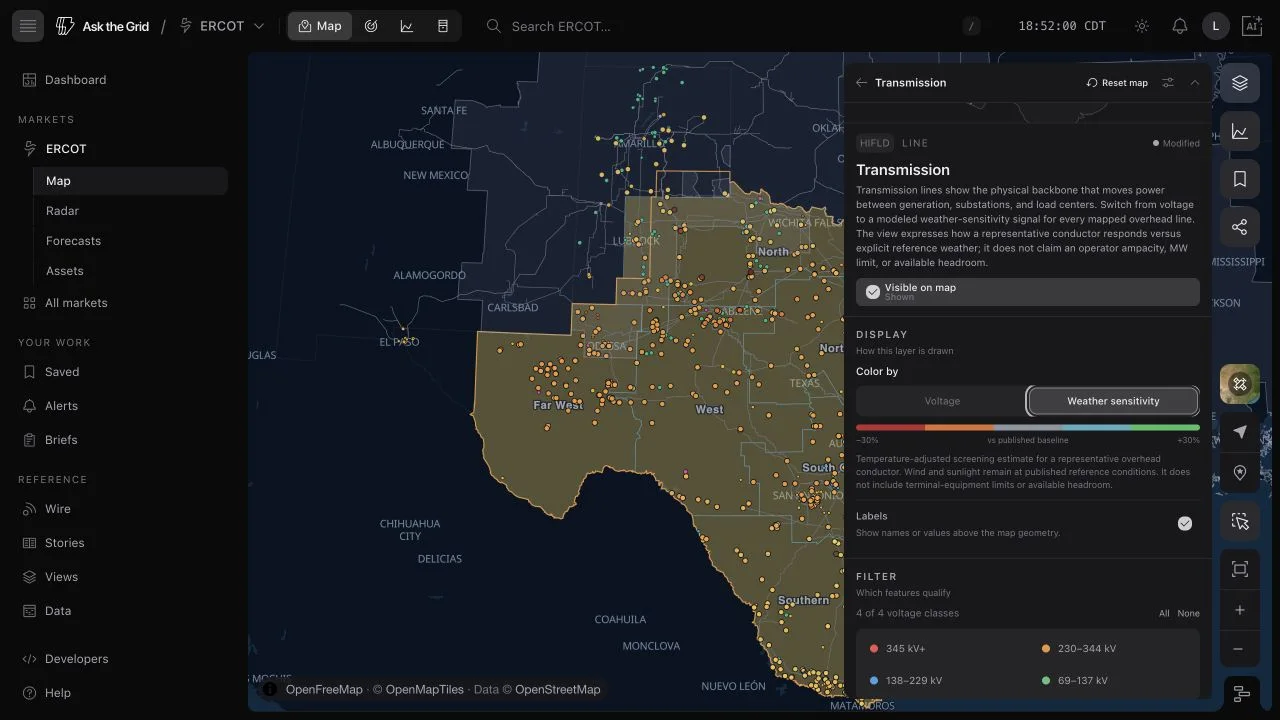
Enable Modeled line ratings in Settings → Advanced. Then open Transmission on any ISO map—or the national map—and switch Color by to Weather sensitivity. Eligible overhead AC lines are colored by the modeled change in conductor current from a published owner or regional baseline. The shared timeline replays historical weather and continues through the available forecast.
The estimate changes hourly air temperature while holding wind and sunlight at the profile baseline, following the structure ERCOT uses for temperature-adjusted ratings. It stops rising below an equipment floor calibrated against the temperature-rating tables Texas transmission owners submit to ERCOT, because a real facility is limited by its terminal equipment as much as by its conductor, and that equipment does not care how cold the air is. A scheduled validation run compares fixed forecast vintages with realized Texas station weather and ERCOT's public zone forecast. Route-weather lead bands are used only after they beat the ERCOT temperature benchmark and keep modeled-rating overstatement within 0.1 percentage point of ERCOT's rate; failed or missing bands fall back automatically. We deliberately do not expose a full-weather DLR estimate: it still requires a line-matched operator benchmark.
Select a line for a 72-hour outlook and the inputs behind the result. Its asset page shows the limiting route sample, applied air temperature, fixed reference wind and sunlight, published assumption profile, representative conductor, reference conditions, and model version. Radar summarizes the estimates across the market inventory.
These are screening estimates, not operator facility ratings. The equipment floor is a calibrated stand-in for terminal-equipment limits, not a record of any particular facility's equipment; public line geometry still does not include the actual conductor, sag and clearance, relays, or transformers. A modeled increase also does not establish additional transfer capacity or available headroom.
Choose the experiment explicitly
The experiment is off by default and follows the signed-in account across devices. Enabling it reveals the transmission map control, line-card extension, asset-page analysis, and Radar summary together; disabling it removes those surfaces again.
The public changelog and methodology remain readable without opting in, so anyone can understand the release before deciding whether to add the analytical surfaces to their workspace.
Screen every eligible overhead line
Weather sensitivity is available for every voltage class in ERCOT, CAISO, NYISO, PJM, MISO, SPP, and ISO-NE, plus the national map. Underground facilities and DC ties are excluded because the conductor heat-balance model does not describe them.
The map uses the full inventory for modeling while preserving zoom-dependent line visibility, so dense lower-voltage networks do not overwhelm a national or regional view.
Read the selected line without leaving the map
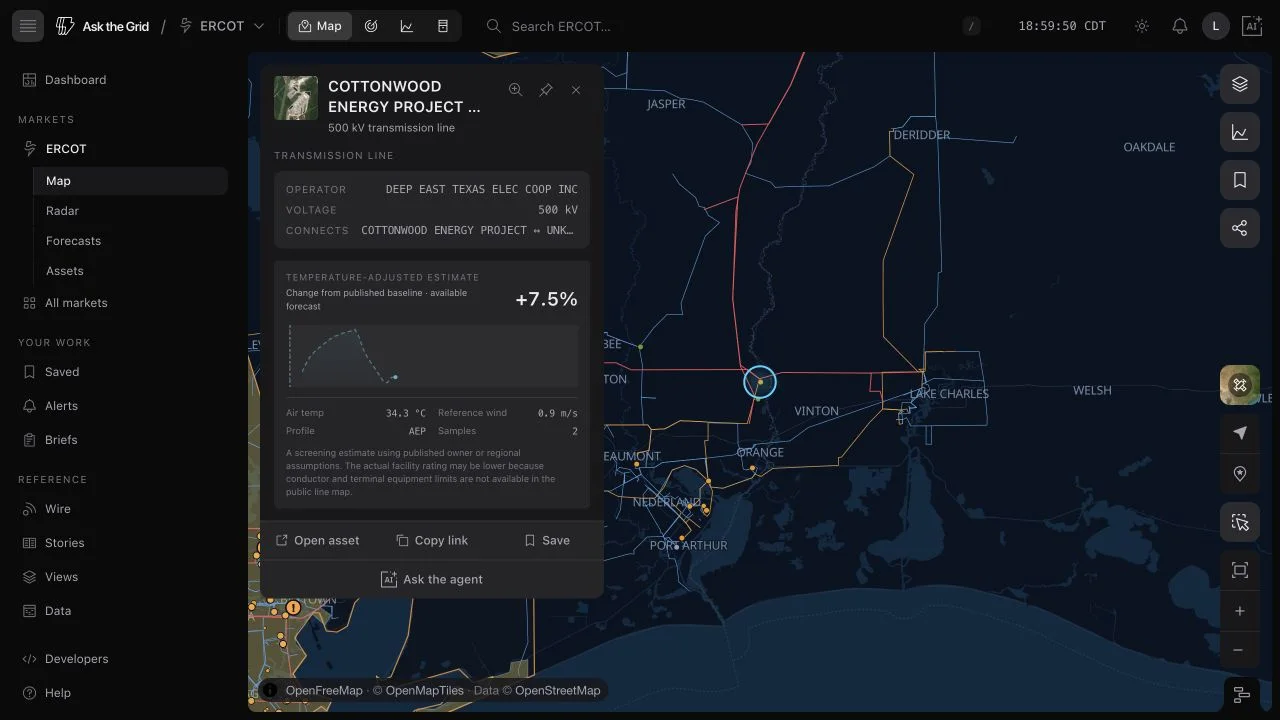
The compact line card shows the selected-hour percentage, the available outlook, air temperature, fixed reference wind, assumption profile, and route sample count. Its copy names the comparison as a screening estimate rather than presenting it as an operator facility rating.
The shared map timeline controls the selected hour, so the card and line colors move together when replaying history or inspecting the forecast edge.
Continue into a durable line record
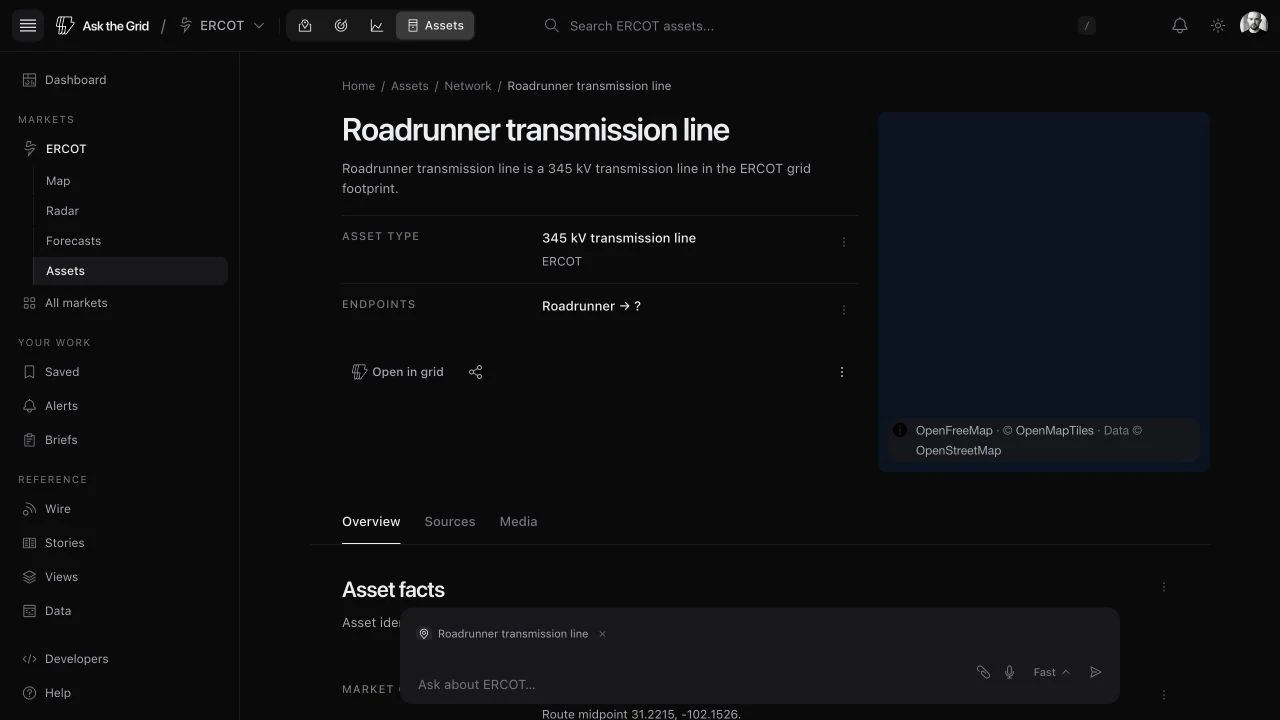
Open asset carries the market identity with the line, avoiding collisions when different ISOs use the same source identifier. The resulting page preserves the mapped route, endpoints, voltage, owner or operator, source record, and a link back to the exact grid selection.
That connection makes the model an extension of the existing asset system, not a separate analytical dead end.
Inspect how the estimate was formed
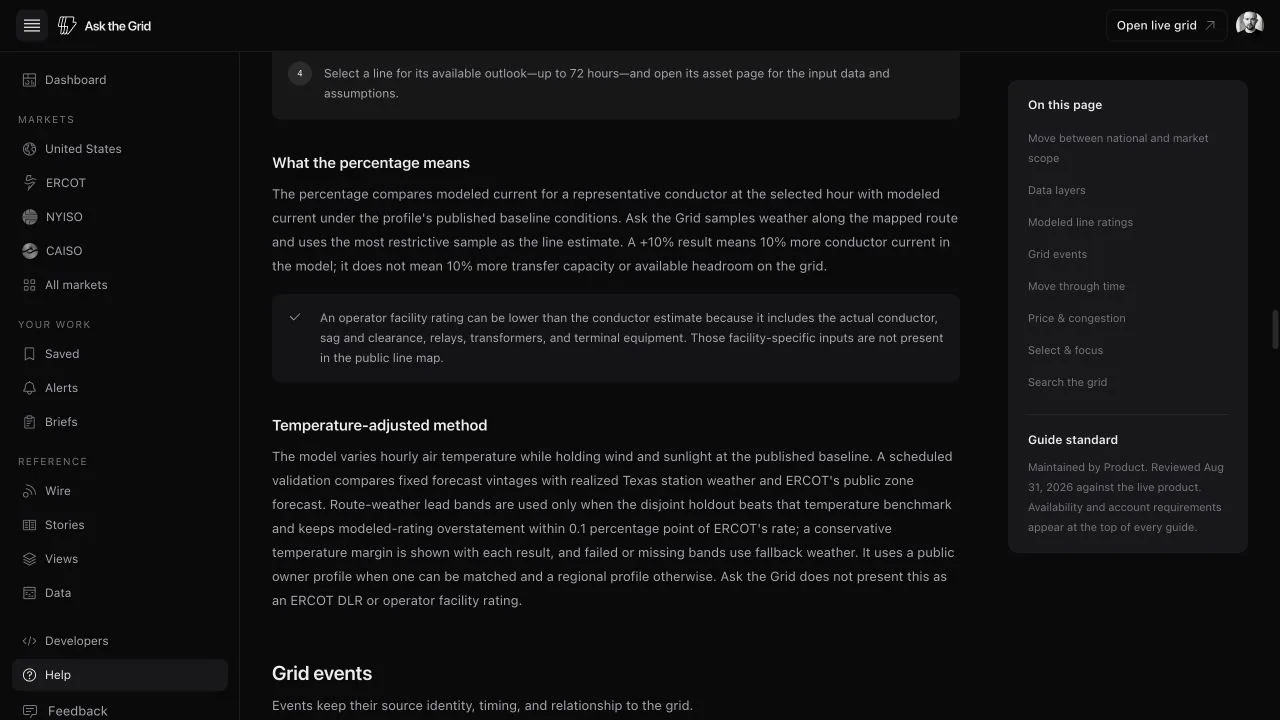
The deeper asset section explains what the percentage means, how the route samples feed the IEEE 738 heat balance, which sample limits the result, and why the result is not additional transfer capability. Applied and reference inputs sit beside the chart rather than behind an unlabeled model score.
The page also names the published profile, representative voltage and conductor, maximum conductor temperature, model version, and methodology links. Missing public equipment detail remains visible as a real limit on interpretation.
Cold weather stops paying at the equipment floor
A bare conductor keeps gaining capacity as the air cools. A transmission facility does not: its rating is the lesser of the conductor and the terminal equipment at each end, and switches, relays, and current transformers do not become more capable in a cold snap. The temperature-rating tables Texas transmission owners submit to ERCOT show exactly that shape—they gain almost nothing below roughly 65 °F, and about a third are flat across that whole range.
Each assumption profile now carries an equipment floor fitted to those submitted tables, and the modeled estimate stops rising once the air drops past it. Texas owners with enough submitted tables get their own floor; every other profile, in Texas and in the six other markets, uses the pooled Texas fit. A line's asset page names its floor and says whether the floor or the weather set the hour you are looking at.
The practical effect is on cold hours, overnight periods, and winter, where the uncapped conductor calculation is most optimistic and where a reader is most likely to be hunting for headroom. Summer afternoons, when lines are closest to binding, are unchanged.
Move from one line to the market distribution
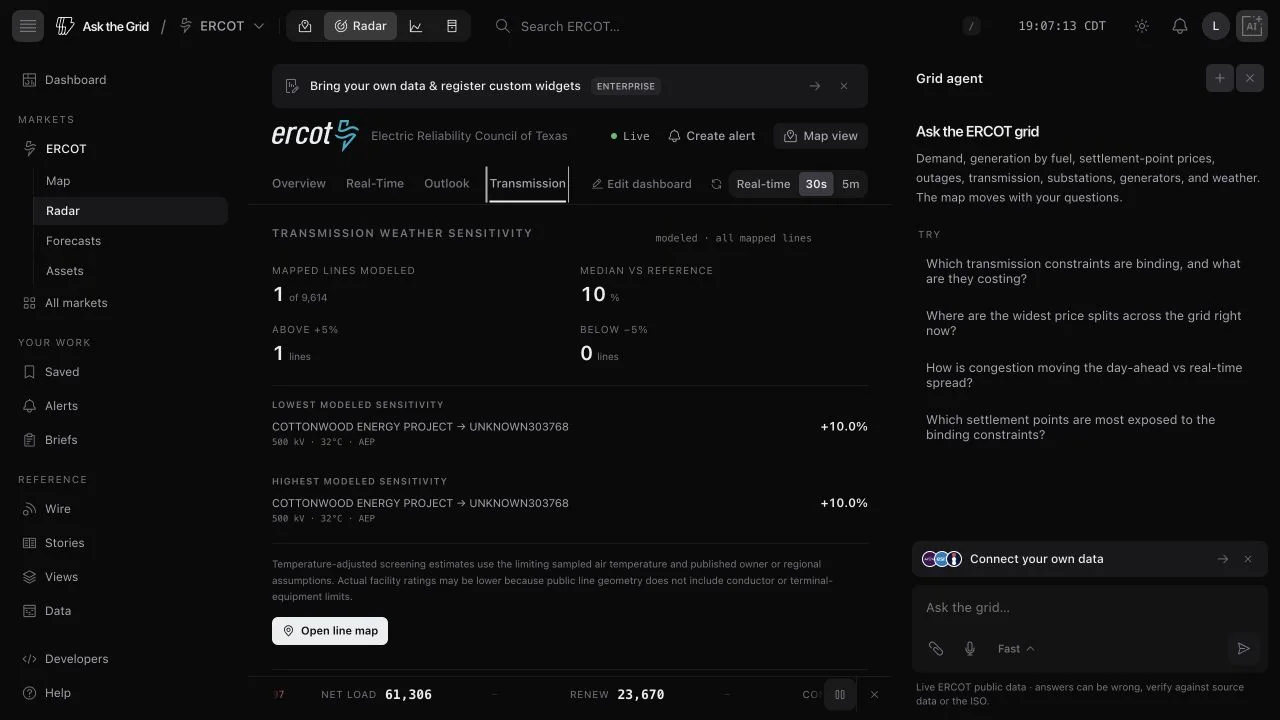
The Transmission desk in Radar summarizes modeled coverage, the median change from reference conditions, both tails, and the lines with the highest and lowest estimated sensitivity. It uses the same materialized hourly output as the map and asset pages.
This market-wide view is intended for screening and investigation: select an outlier, open the line map, then inspect the line record and its assumptions before drawing an operational conclusion.