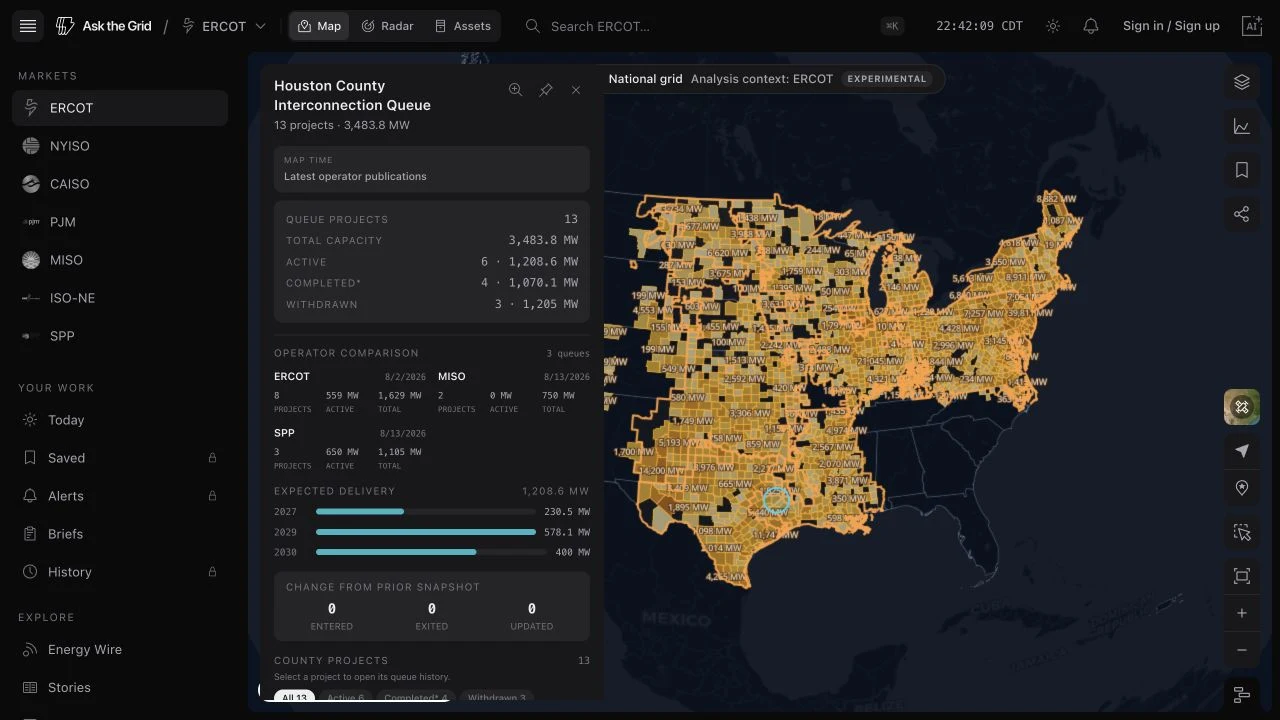
All seven interconnection queues share one map
Official queue publications from ERCOT, CAISO, ISO-NE, MISO, NYISO, PJM, and SPP can be compared nationally, then opened as operator-specific county and project records.
The Interconnection queue layer combines every supported organized market without collapsing their sources or native records. County capacity, project counts, technologies, and normalized active, completed, and withdrawn statuses provide a national comparison; publication dates, operator names, queue IDs, and project histories remain market-specific.
Coverage is the seven organized US markets supported by Ask the Grid. Areas outside those footprints—including much of the Southeast and Arizona—require additional utility or balancing-authority sources before they can appear. Requested queue capacity is not a forecast of what will be built, and an operator status is not independent proof of commercial operation.
Compare the official queues nationally
The national layer shades counties by requested capacity and keeps counties shared by several market footprints intact. Opening one compares publication date, project count, active capacity, and total requested capacity for each operator side by side.
Project rows retain their native market and queue ID, so the next step always opens the correct operator record.
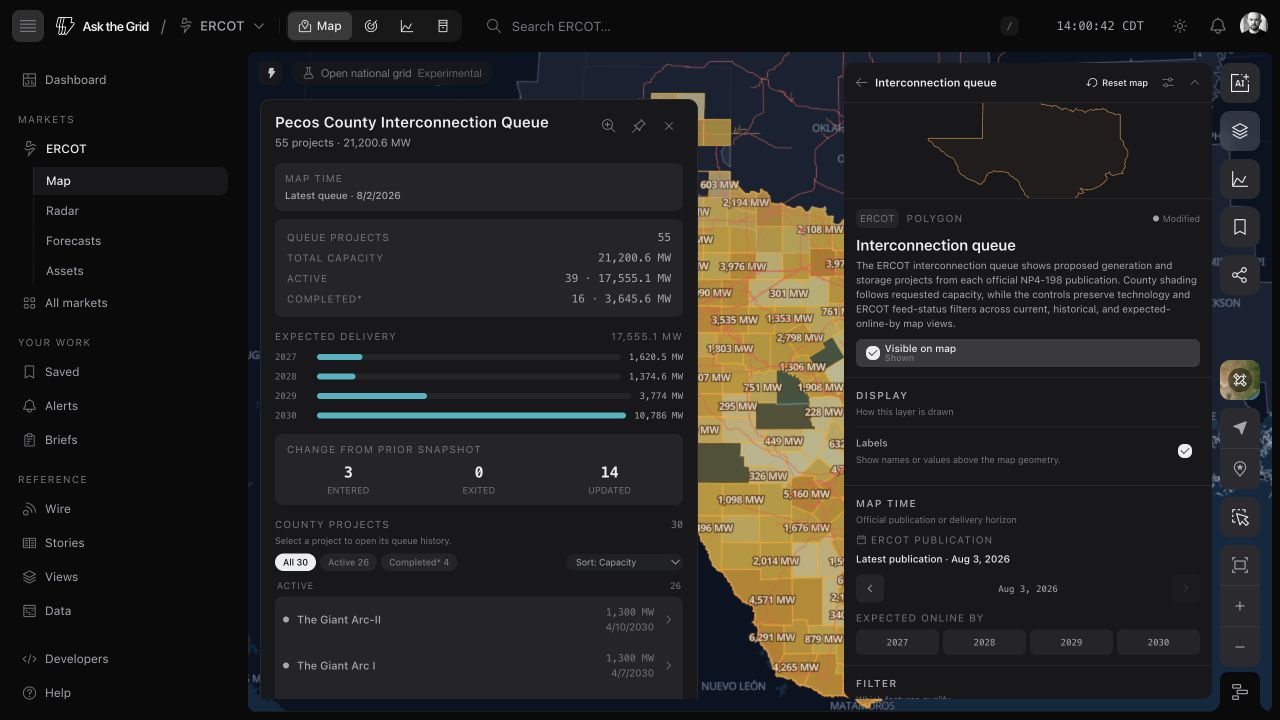
Replay the publication that existed at the time
ERCOT's detailed workflow follows map time: move backward to the queue publication available then, between adjacent snapshots, or forward to active projects whose proposed completion date falls inside a chosen horizon. County totals keep that meaning beside the result.
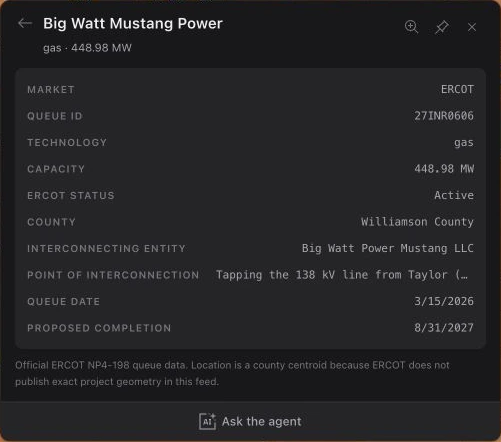
Inspect the native project history
Individual records preserve queue ID, developer, requested MW, technology, point of interconnection, status, proposed dates, and changes across official publications. County-centroid placement remains explicit because the source does not publish exact project geometry.