Interconnection queues
Compare supported operator queues across the US and Mexico, then inspect a county, project, and its history.
Open the public queue view- Status
- Live
- Access
- Public queue Views · Free account for the interactive map
- Reading time
- 14 minutes
- Updated
- Oct 14, 2026
The all-market interconnection layer combines official queue publications from ERCOT, CAISO, NYISO, PJM, MISO, SPP, ISO-NE, BPA, and CENACE. Shared county capacity, project counts, technologies, and normalized active, completed, and withdrawn groupings make geographic comparison possible; operator, publication date, queue ID, native status, and project history remain attached to the source record.
A queue is a development process, not an operating-fleet forecast. Requested MW is not installed, accredited, deliverable, approved, or likely-to-complete capacity. Proposed dates and operator statuses must be read as fields from the stated publication, with exact project geometry shown only when the source supports it.
On this page
Compare every supported queue
Use national scope to compare geography and published queue scale before opening an operator-native record.
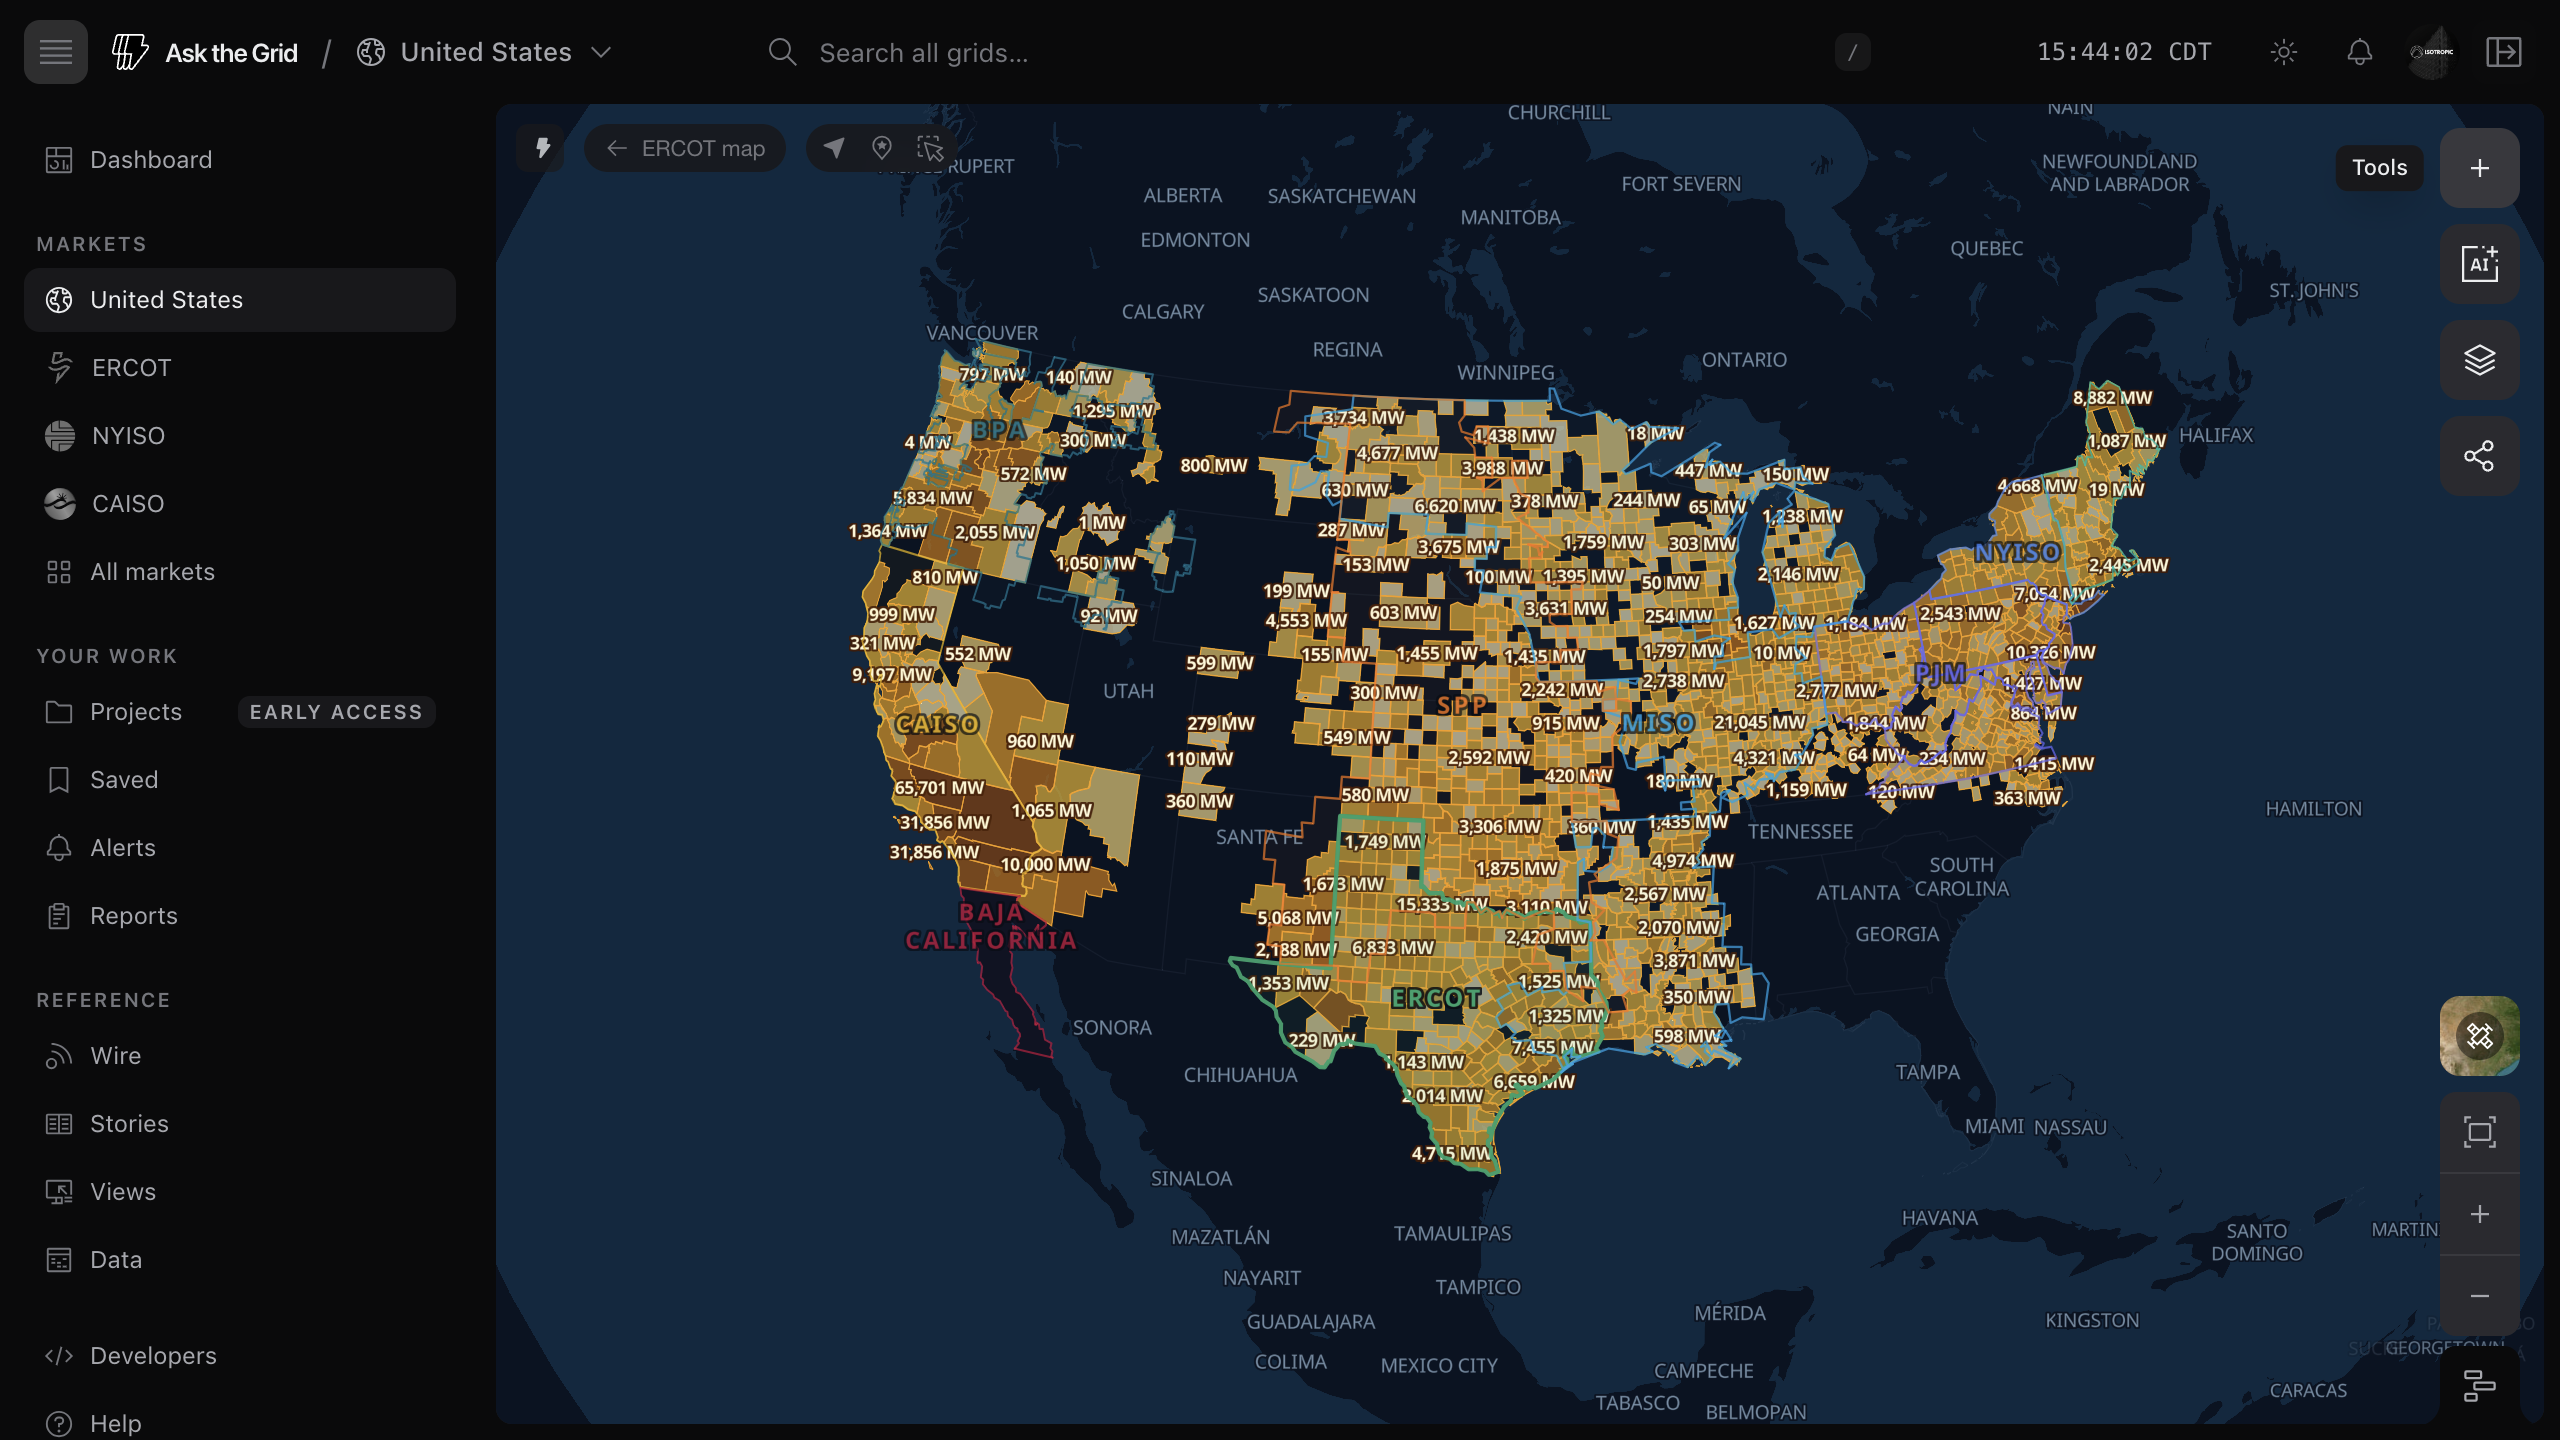
Turn on the national queue
Open Map content, turn on Interconnection queue, and open the national grid to see every supported publication together. County shading summarizes requested capacity under the active technology and status filters. The interactive map opens with a free account; the public queue Views open without one.
- 1Open the market switcher in the header and choose North America, or select North America in any market map's top-left corner.
- 2Open Map content and, under Infrastructure, turn on Interconnection queue.
- 3Filter by technology or normalized status only when the comparison requires it.
- 4Select a county to compare the operator publications present there.
Keep overlapping markets separate
A county can intersect more than one organized-market footprint. The county card's operator comparison lists each operator's publication date, project count, active requested capacity, and total requested capacity separately, then routes each project row to its native queue record.
Know the coverage boundary
The layer covers the supported US operator queues and CENACE’s generation interconnection requests in Mexico. Areas outside the supported publications require additional utility or balancing-authority evidence and do not become zero-capacity counties merely because they are absent. BPA's line and load requests are a separate queue that the layer does not draw; ask the agent for them.
Configure an operator view
Enter one market when the workflow depends on its publication controls, native statuses, or project fields.
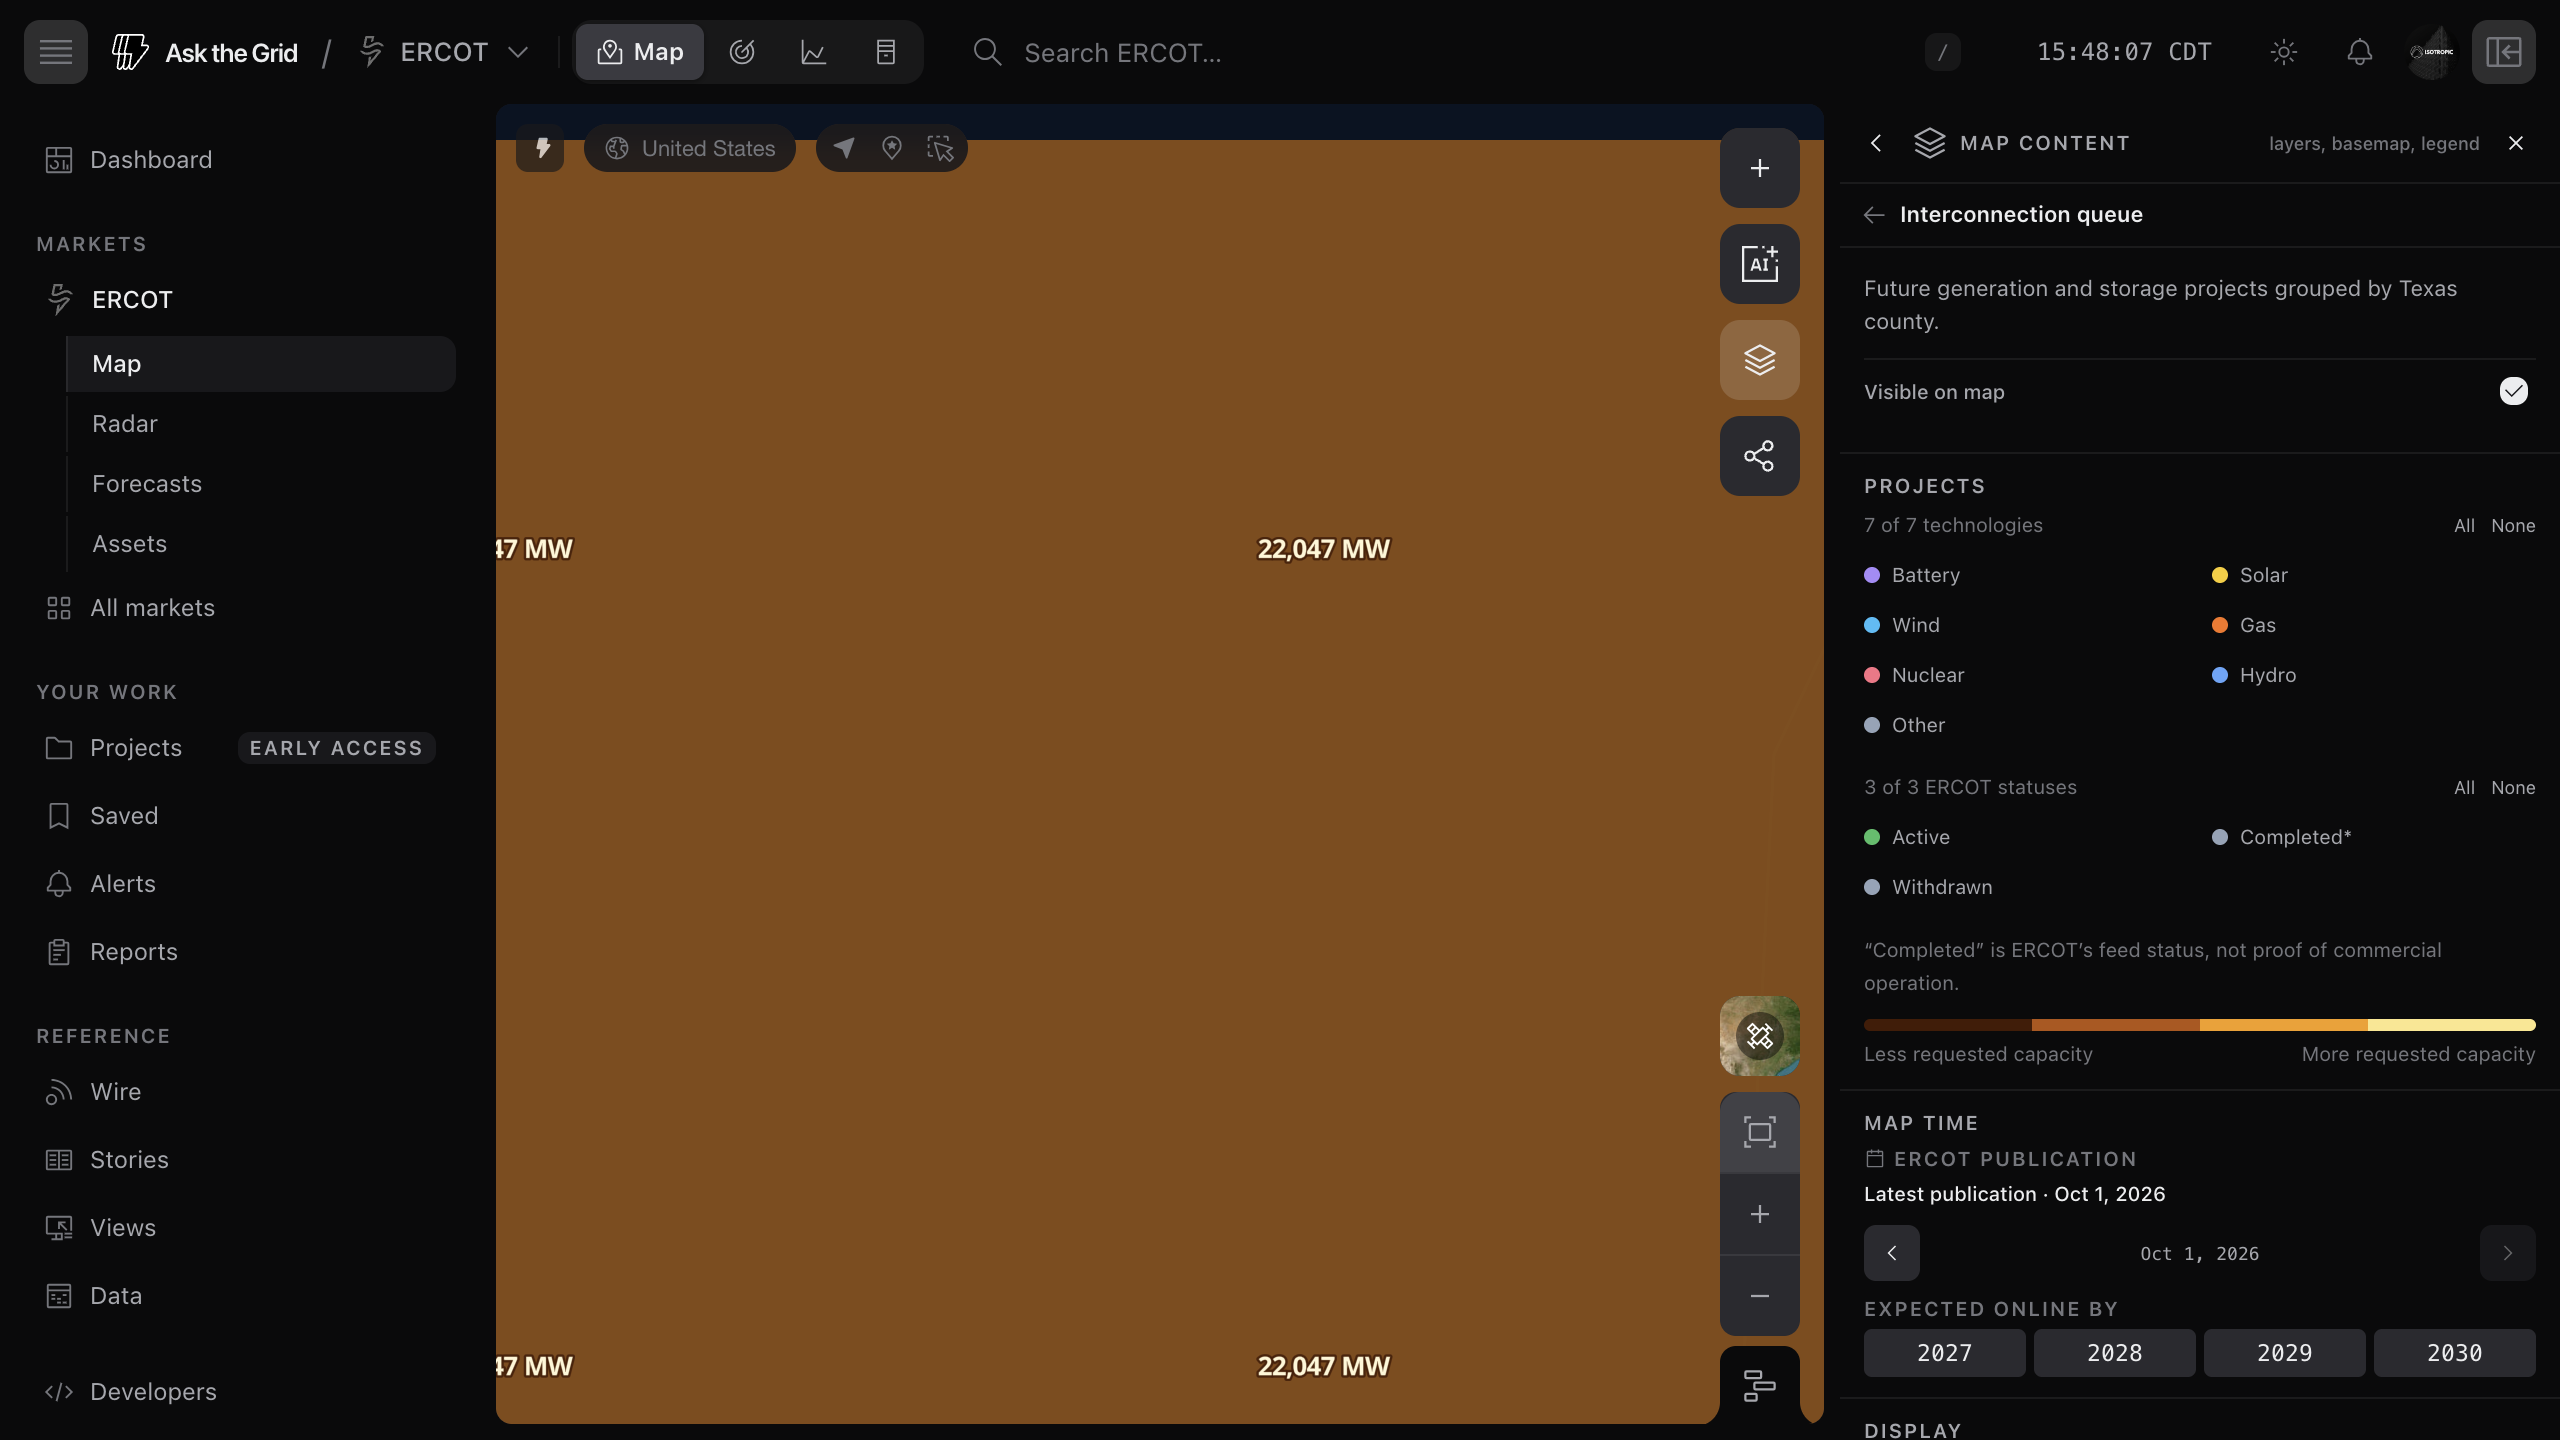
Preserve operator-native status
The national layer filters on normalized statuses for discovery, while a single market's layer filters on that operator's own feed statuses, and the project card retains the exact status published by the operator. Use the native value and publication date when describing one project.
Replay the available publication
The map replays past queue publications for ERCOT: move the map clock into the past to load the publication available then. Other markets show their latest publication. Do not use a later snapshot to describe what was knowable at an earlier date.
Use delivery horizons as schedules of intent
ERCOT, MISO, SPP, BPA, and CENACE publish proposed completion dates for some or all projects, so an Expected online by horizon can show active projects whose proposed date falls inside that window. It is a filter over published developer or operator dates, not a forecast that those projects will reach commercial operation.
Move from county to project
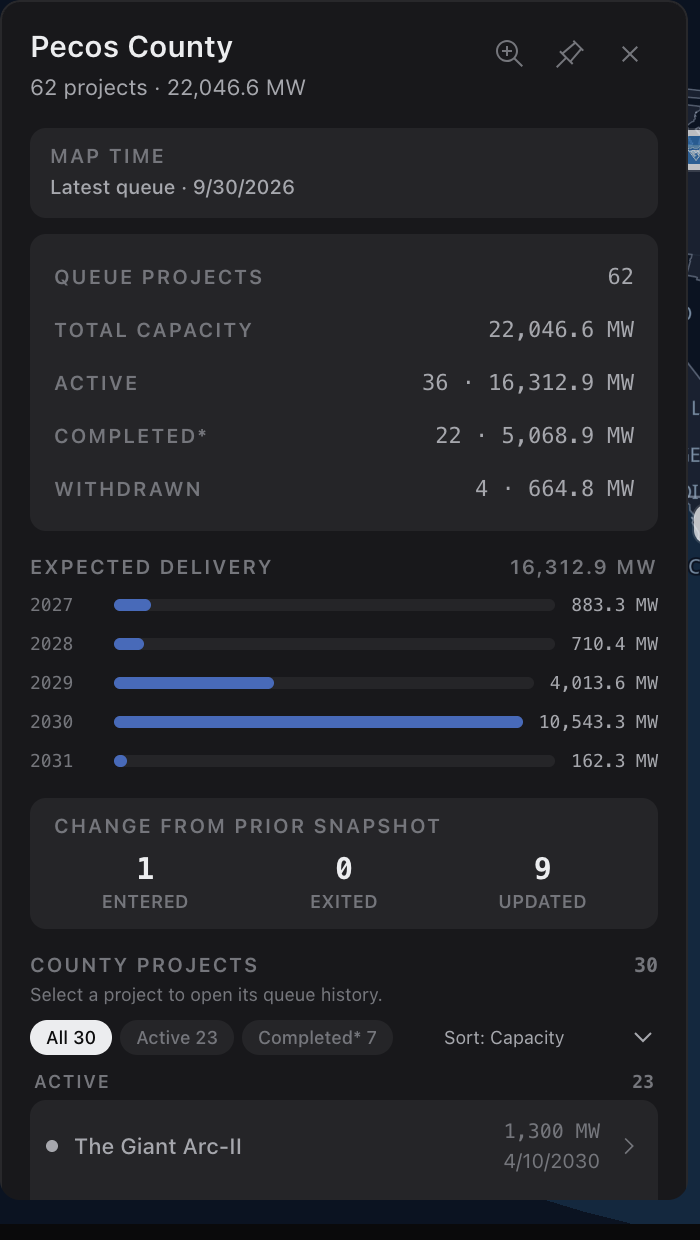
Read the county aggregate
The county card separates project count, requested MW, publication date, delivery cohorts, and changes from the prior publication where those measures are available. Read the map-time label before comparing counties or screenshots.
Open the native project row
Select a project from the county list to open its queue ID, interconnecting entity, technology, requested capacity, status, county, point of interconnection, queue date, proposed completion date, and other market-published fields such as transmission owner.
- 1Select a shaded county.
- 2Confirm the operator, publication date, and active filters.
- 3Open one project row.
- 4Use the back arrow to return to the county card.
Open an application record
Choose Open application record for the source-backed status, capacity, parties, interconnection details, and retained reports. Expand Snapshot history to compare publications. Platform search also finds records without map coordinates by name, request ID, parties, or point of interconnection. Proposed dates remain proposals; an application is distinct from a physical facility.
Ask about the selected record
Use Ask the agent about this on the selected county or project and ask a precise question such as which active battery projects match the current county filters or what changed across publications. Check the publication dates and source records cited in its answer.
Inspect project history
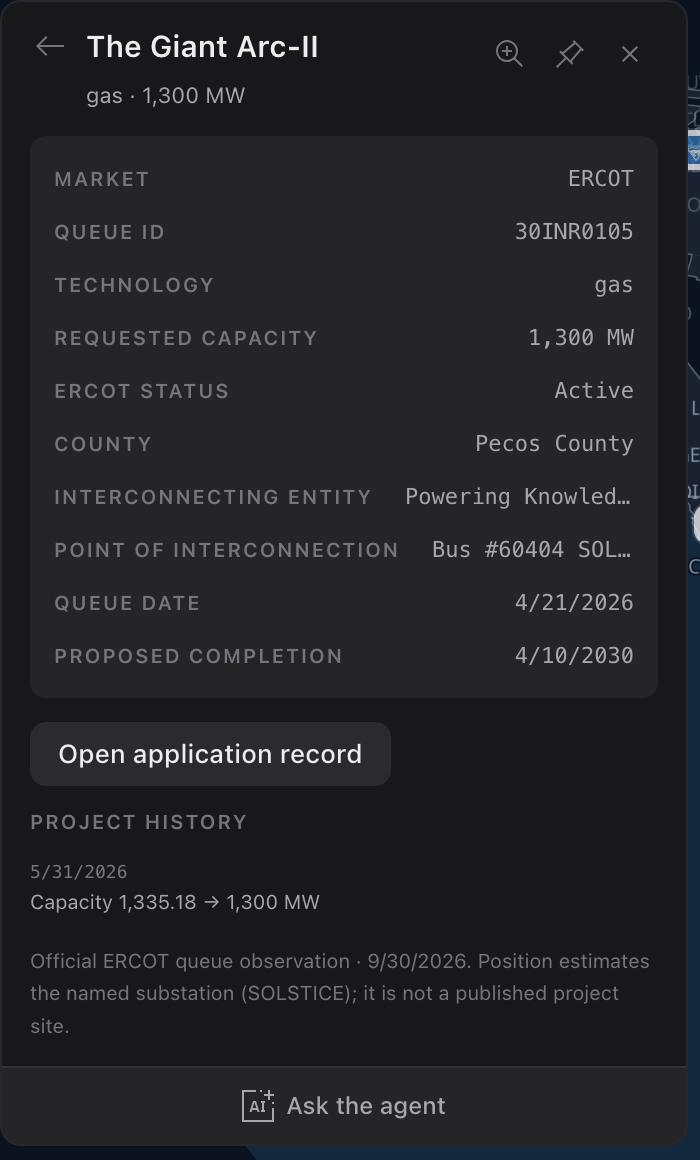
Compare official snapshots
Choose Open application record on a project card to read its retained snapshot and Snapshot history. The stable queue ID connects publications and changes in status, requested capacity, proposed dates, and other reported fields. A missing project in one publication requires source-specific interpretation; it is not automatically proof of withdrawal or completion.
Use location evidence at its real precision
Some queues provide detailed points of interconnection or project locations; others support only a county or another approximate geography. A county centroid is a navigation anchor, not exact project geometry or evidence of thermal headroom, feasibility, or study outcome.
Interpret queue values correctly
Requested MW is not operating capacity
Queue capacity measures an interconnection request under the source publication. It does not establish construction, commissioning, commercial operation, accreditation, deliverability, available transmission, or the probability of completion.
Dates and statuses need attribution
Write that the operator publication lists a proposed date or status. Completed can describe a queue-process state without independently proving that the facility is online, and a proposed in-service date remains reported rather than observed.
Compare like with like
Before ranking markets or counties, align publication dates, status inclusion, technology filters, treatment of uprates or withdrawals, and whether the measure is project count or requested MW. A larger queue is not automatically a stronger development pipeline.
Screen a distribution site in PG&E's territory
Below the transmission queues, PG&E publishes its distribution grid feeder by feeder. Read it on the map to see where a smaller project could connect before anyone files.
Check what fits at a point
Right-click a point in PG&E's territory on the CAISO map and choose What's here. The Distribution block names the nearest feeder and its substation, counts the line sections within 5 km that PG&E's analysis says can take your project without upgrades, and gives the nearest one that does. Set the size in MW and choose generation, solar, storage or load. Storage has to fit both ways, so a section counts only when both its charging and discharging room clear the size.
- 1Open the CAISO map and turn on DER hosting capacity in Map content.
- 2Right-click the site and choose What's here.
- 3In Distribution, set the project size and kind, then read what fits and what is already queued at the substation.
Check the substation before you commit
Zoomed in, the hosting capacity layer draws PG&E's distribution substations. Click one, or its name in the Distribution block, for a card with its feeders' hosting capacity, each bank's forecast loading against its rating and any shortfall over the next five years, and the active requests in PG&E's Wholesale Distribution Tariff queue at that substation, matched by name. Open Load profile to see low and high modeled load for a representative day in the selected month; choose a feeder to see its published shape.
Inspect a line section's hourly study
At close zoom, click an individual PG&E line section. Connected to identifies its feeder and parent substation; open the substation from that row. Open Generation hosting profile to compare PG&E's 10th and 90th percentile loading scenarios by hour for the selected month. These are planning scenarios, not live flow or immediately available capacity.
Know what the screen does not say
Hosting capacity is PG&E's screening analysis at the date shown, not an interconnection study or a reservation. Sections on one feeder share its capacity, so two projects on the same feeder cannot both count on the same figure.
Did this guide get you unstuck?
One click is enough. No message or account required.