Seven live markets become one national grid map
ERCOT, CAISO, NYISO, PJM, SPP, MISO, and ISO-NE now share one map vocabulary, national infrastructure and weather layers, market-native detail, and a common timeline.
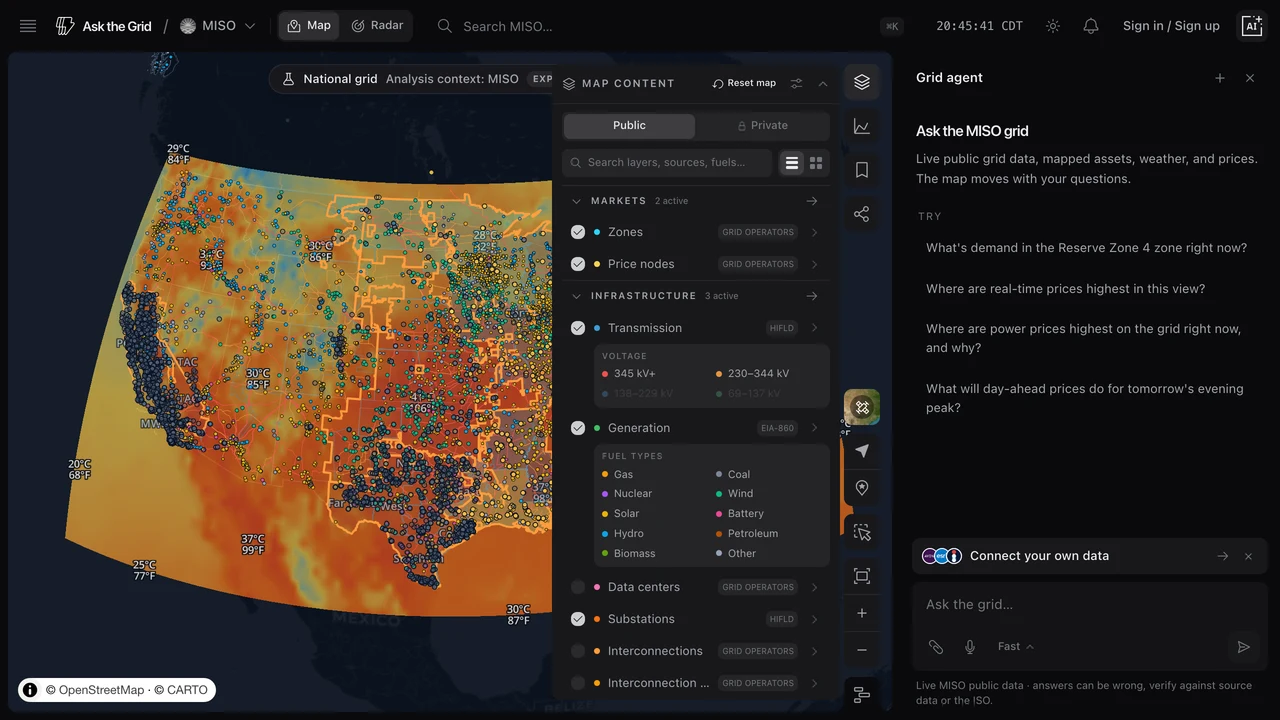
Ask the Grid's map grew market by market—from ERCOT to New York, PJM, SPP, MISO, and finally ISO New England—until every organized US power market had its own live geographic workspace. The national map is the second step: it shows those seven footprints together and resolves equivalent operator concepts into one discoverable layer system.
The unification does not erase market boundaries. Operator-native names, source links, settlement locations, constraints, and publication cadences remain attached to each layer. Physical generation, transmission, substations, customer outages, and continental weather extend beyond ISO borders where national sources support them.
One national layer vocabulary
Zones, load zones, TAC demand areas, and local resource zones resolve to Zones. LMP nodes, LBMP nodes, PNodes, and settlement points resolve to Price nodes. The common controls reduce navigation cost while each detail view retains its operator terminology and source.
EIA-860 generation and HIFLD transmission and substations render nationally, ODIN customer outages render from its county feed, and temperature, precipitation, cloud, wind, and GOES lightning use their continental footprints. Exact ISO boundaries remain visible as the operating-market context.
Beyond ISO footprints: Bonneville and the ties between grids
The workspace now includes Bonneville's balancing area alongside the seven organized markets. BPA keeps its own hydro-system Radar and map evidence; the prices at its WEIM locations are published by CAISO. A balancing area is not presented as an eighth ISO market.
Interfaces keeps each price-bearing location attached to the operator that publishes it. Supported tie-flow arrows show the direction of power movement and use published limits where available. BPA's Regional transmission layer can color transfer-cut lines by loading, preserving the distinction between an operator's reported interface and a mapped physical line.
The central and Great Plains markets join
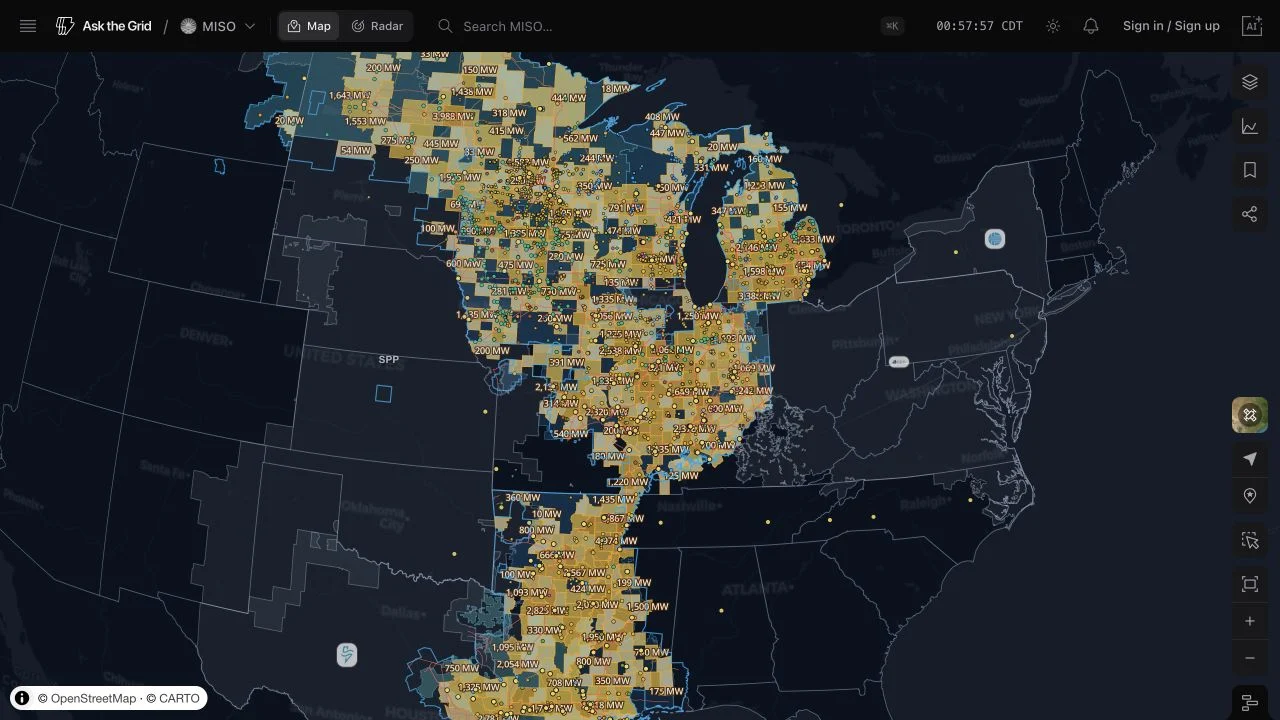
MISO added its operator footprint, local resource zones, geolocated settlement points, generation, transmission, substations, weather, and interconnection queue. SPP added its own public geography, live prices, load, fuel mix, renewable forecasts, ancillary clears, and binding constraints.
The product omits signals a market does not publish in a compatible form rather than copying another operator's widgets into an empty shell.
ISO New England completes the seven-market map
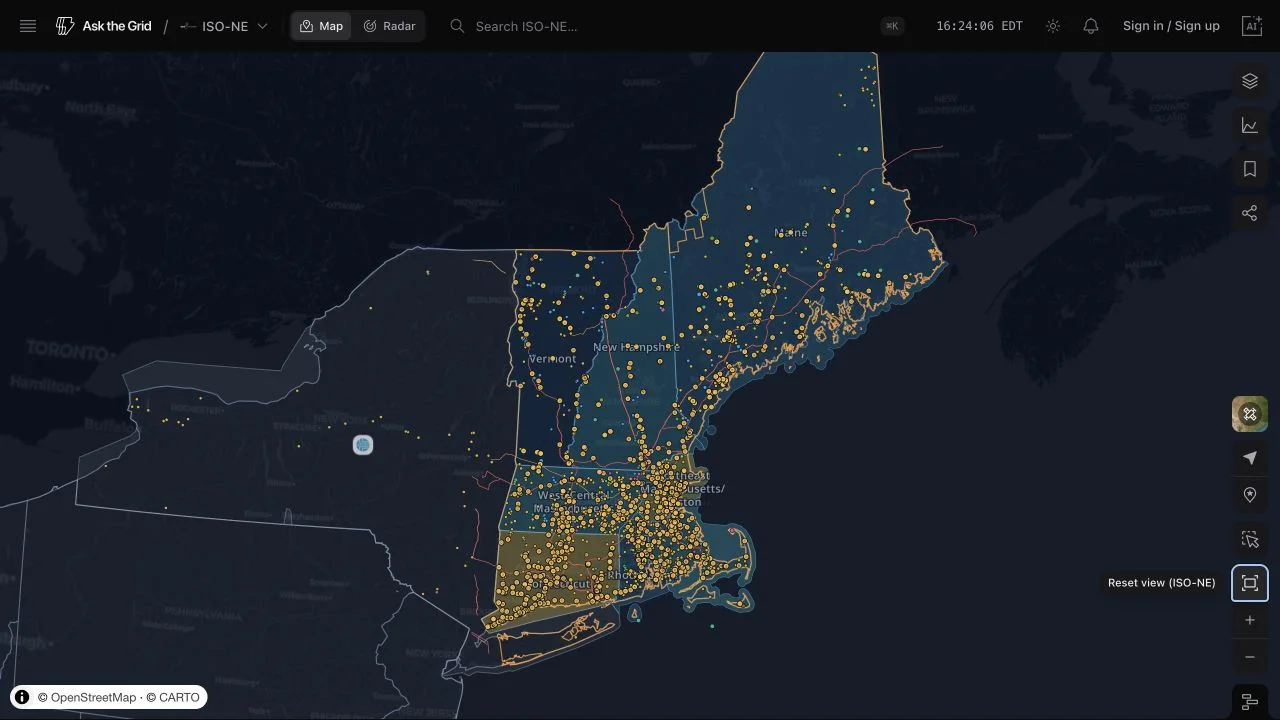
ISO-NE added the Internal Hub, eight load zones, 1,137 active physical PNodes, generation, transmission, substations, utility territories, its interconnection queue, and nationwide weather overlays across six states.
Its Radar and dedicated agent scope follow the same rule as the map: only signals backed by compatible New England feeds appear.
Market launches remain operator-specific
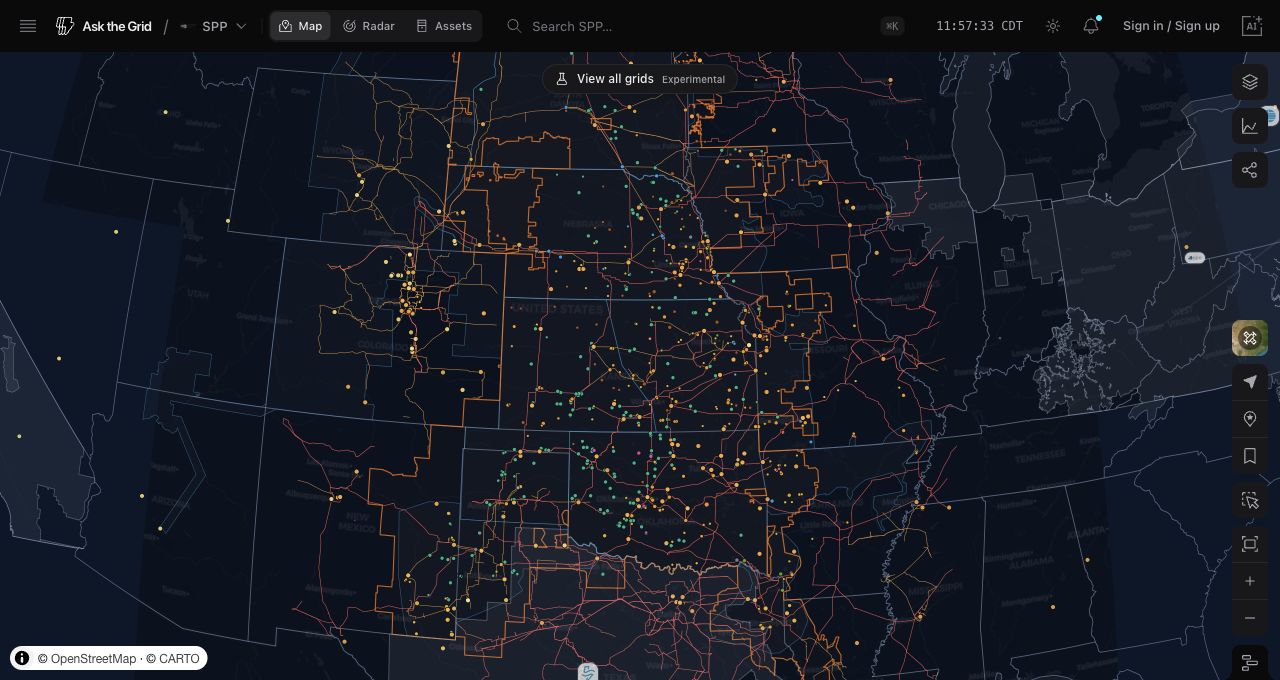
PJM and NYISO established the multi-market map before the national view. SPP then brought the same navigation model to the Great Plains without treating its feed set as a generic copy of another ISO.
Neighboring markets remain visible as quiet geographic regions, so moving between grids is a map action while the selected market keeps the explicit agent and analysis boundary.
A common timeline connects the layers
The map timeline opens beneath the workspace, steps by day, and can compare several series across the same window. Sunrise and sunset markers support solar context, while the available forecast edge extends the view beyond the latest observation without presenting forecast data as settled history.
