Feature
PJM is live
The largest US grid operator is now on the map, with live demand, prices, and a seven-day forecast.
#PJM#Live grid#Prices
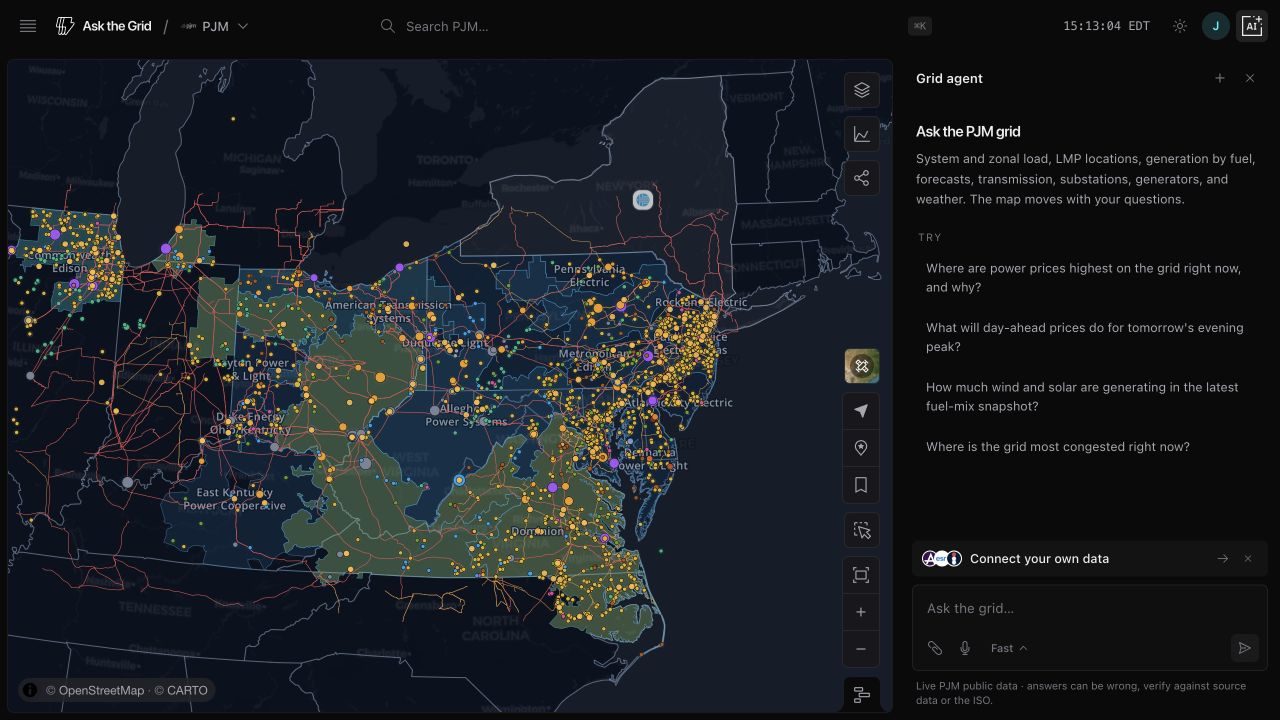
PJM joins ERCOT, NYISO, and CAISO as a fully live grid. Open the PJM map to see demand, generation, and locational prices across the footprint, including trading hubs and external interfaces as priced nodes.
The agent knows PJM too, so you can ask about load, prices, and what is driving them the same way you do on every other grid.
Keep the market context when moving from geography to a number. A hub, an external interface and an individual pricing node retain their own identities, while the source timestamps show which operating interval the current reading describes. The selected PJM scope follows the investigation into the agent.