TVA brings the Tennessee Valley into the live grid
A dedicated TVA map and Radar connect system demand and generation with reservoir observations, release schedules and nuclear operating evidence.
The Tennessee Valley has its own live map and operating desk. TVA joins the geographic workspace with its generation fleet, rivers and transmission context, while Radar gathers the public evidence for demand, generation, reservoirs and the operating condition of the nuclear fleet.
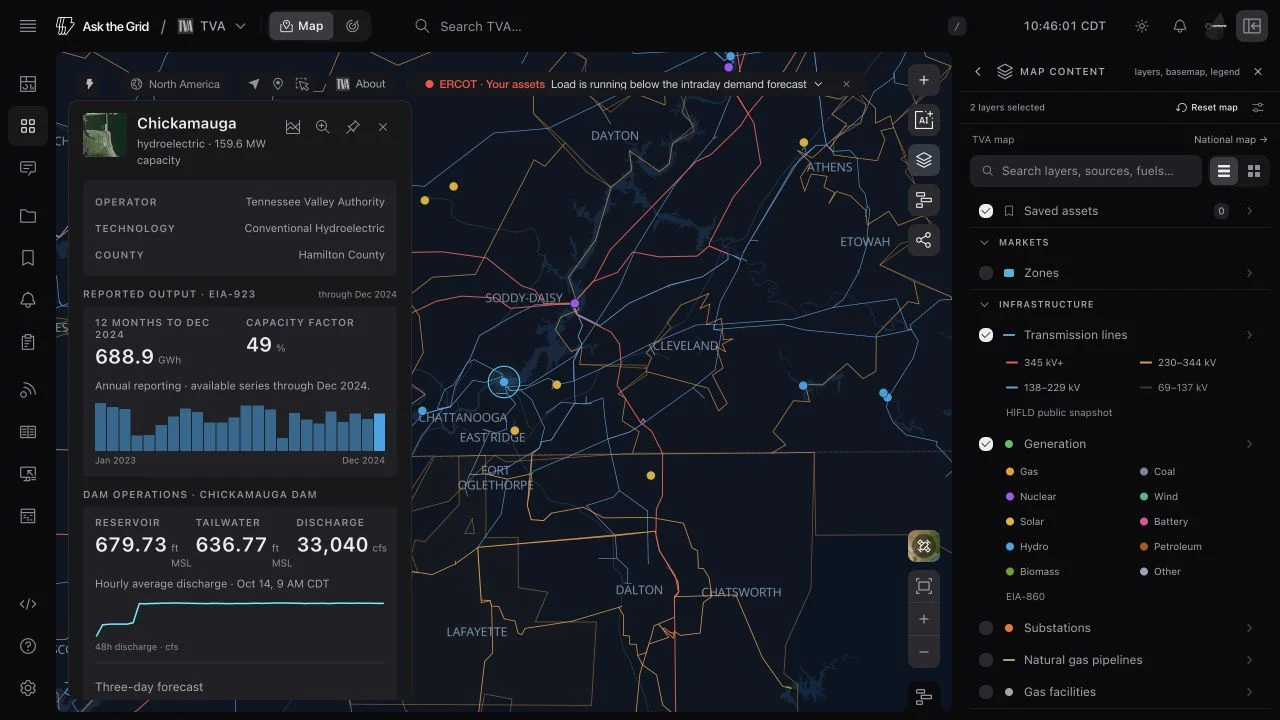
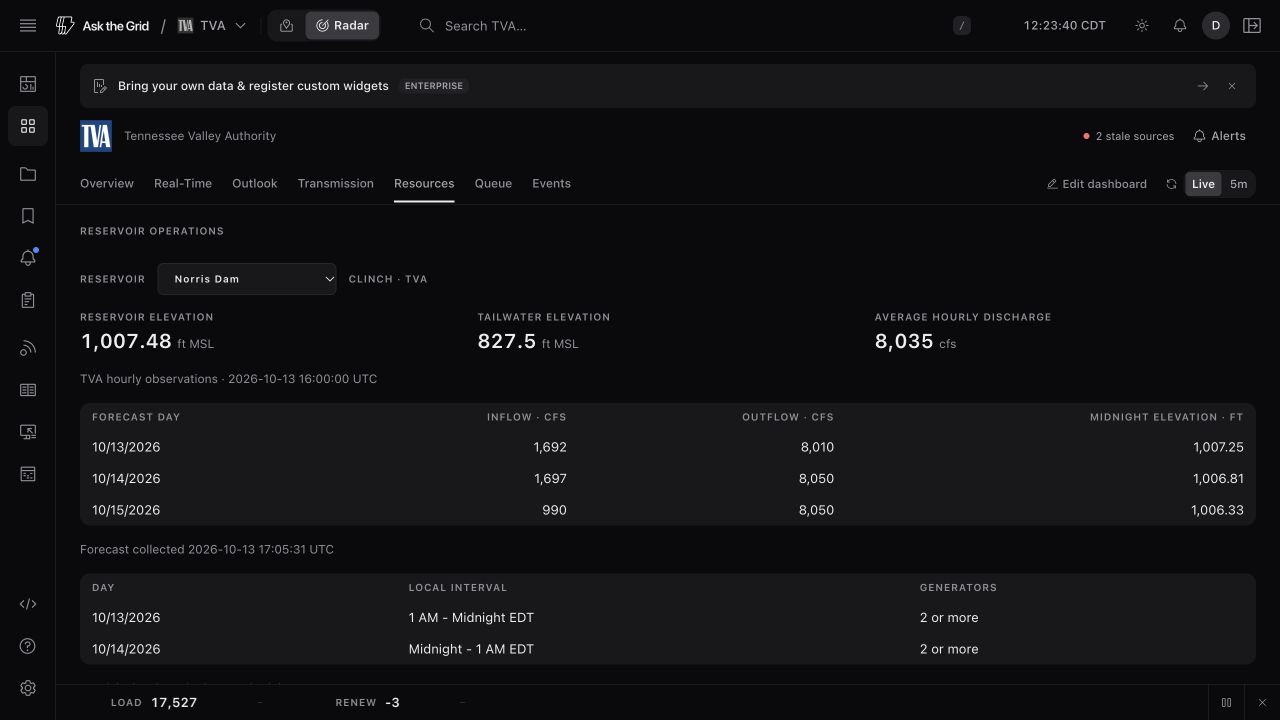
Water is part of this grid's operating picture. A hydro plant can carry the dam's reservoir elevation, tailwater and discharge alongside reported generation, while the reservoir desk preserves TVA's forecasts and release schedules. The map, Radar and grid agent keep those source clocks and units with the question.
Explore the TVA footprint
Open TVA from the grid selector for its dedicated map. Generation, rivers and bulk transmission provide a regional starting point, and selected plants retain their published identities. TVA is a utility balancing area; its operating evidence is presented in those terms.
Follow reservoirs and generation releases
TVA LakeInfo supplies reservoir and tailwater elevations in feet above mean sea level and hourly average discharge in cubic feet per second. The reservoir desk includes published inflow, outflow and elevation forecasts, generation release intervals and notices. A selected hydro plant brings the dam operations and nearby river readings into its own card.
Keep each operating source attached
Radar combines TVA operating publications with daily NRC reactor status. Reactor power is percent of rated thermal power, with the report date shown. Queue requests and transmission publications keep their publisher and publication context, rather than inheriting another market's price or reserve assumptions.