Read the utility serving a site, down to its distribution evidence
Nationwide utility territories connect a place to the utility serving it, with utility-published outages and PG&E distribution hosting capacity where available.
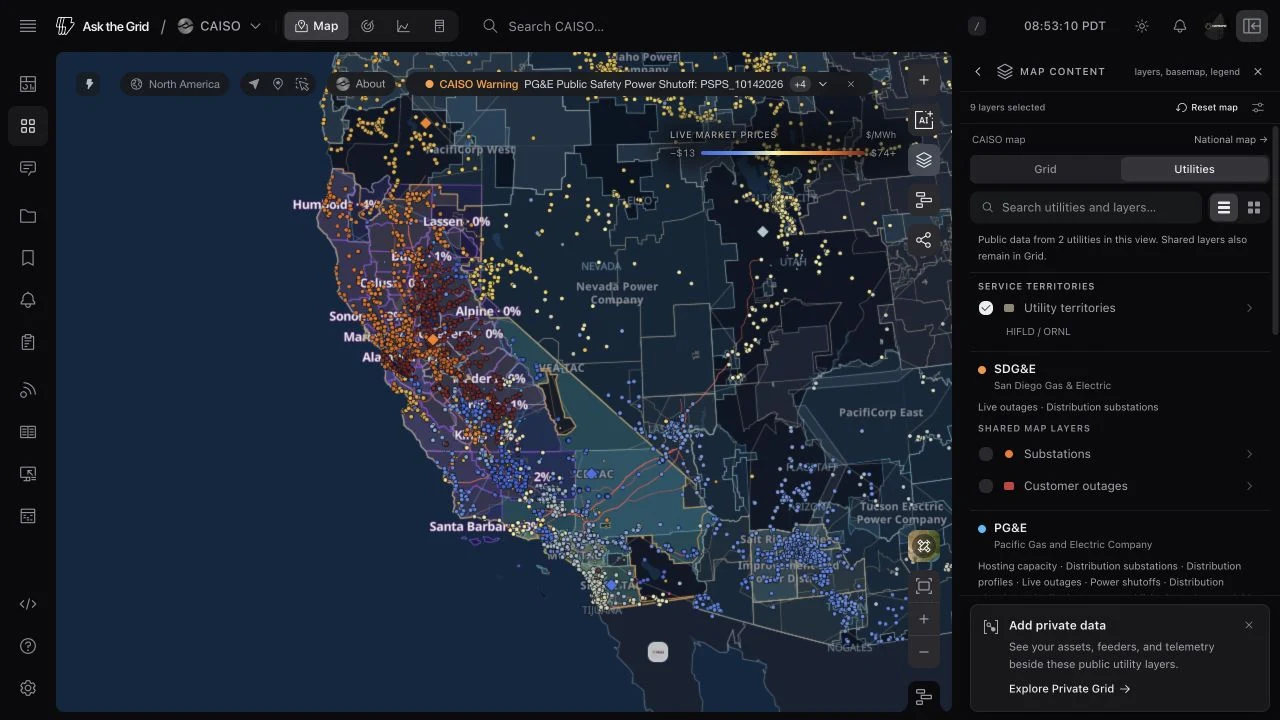
A site starts with the utility that serves it. Utility territories puts the US electric retail service territories reported to EIA on the map, including the Southeast and Hawaiʻi as well as places inside an organized power market. Select a territory or ask What's here at a point to identify the utility and its published service context.
Utility-native data adds a closer view where its publisher makes it available. PG&E's California distribution analysis brings hosting capacity, substations and feeder context into the same investigation as utility outages and national infrastructure. Each reading stays attached to the utility that published it.
Identify the utility at a point
Territory cards identify ownership, customer and retail-sales figures and the grid context. Overlapping service areas remain visible: a city utility or cooperative can sit inside the outline of a larger utility. What's here lists the utilities serving the selected point.
Read utility-published outages
Supported utility feeds add their own outage locations and areas to the customer-outage layer. PG&E's published Public Safety Power Shutoff footprints carry that utility's evidence alongside the shared grid layers. These feeds show their latest map publication rather than pretending to reconstruct every historic timeline hour.
Inspect distribution hosting capacity
PG&E hosting-capacity analysis distinguishes DER, battery charging and battery discharging. County shading summarizes the share of distribution sections that can take a 1 MW project without upgrades; it does not add overlapping feeder capacities. Zoom in to inspect substations and the utility's feeder, bank-loading and queued-connection evidence.