Stories
Data-driven stories from the US power grid — events like demand peaks and winter storms, told with an interactive map and the numbers behind them.

The April 2025 ERCOT Price Spike
No heat, no freeze, no outage declared, and load barely above 45 gigawatts. For about ninety minutes before dawn the ERCOT real-time price spiked nearly seventyfold and collapsed, set not by a crisis but by a thin maintenance calendar, a wind forecast that missed, and a windless hour before the sun came up. Walk the spike interval by interval.
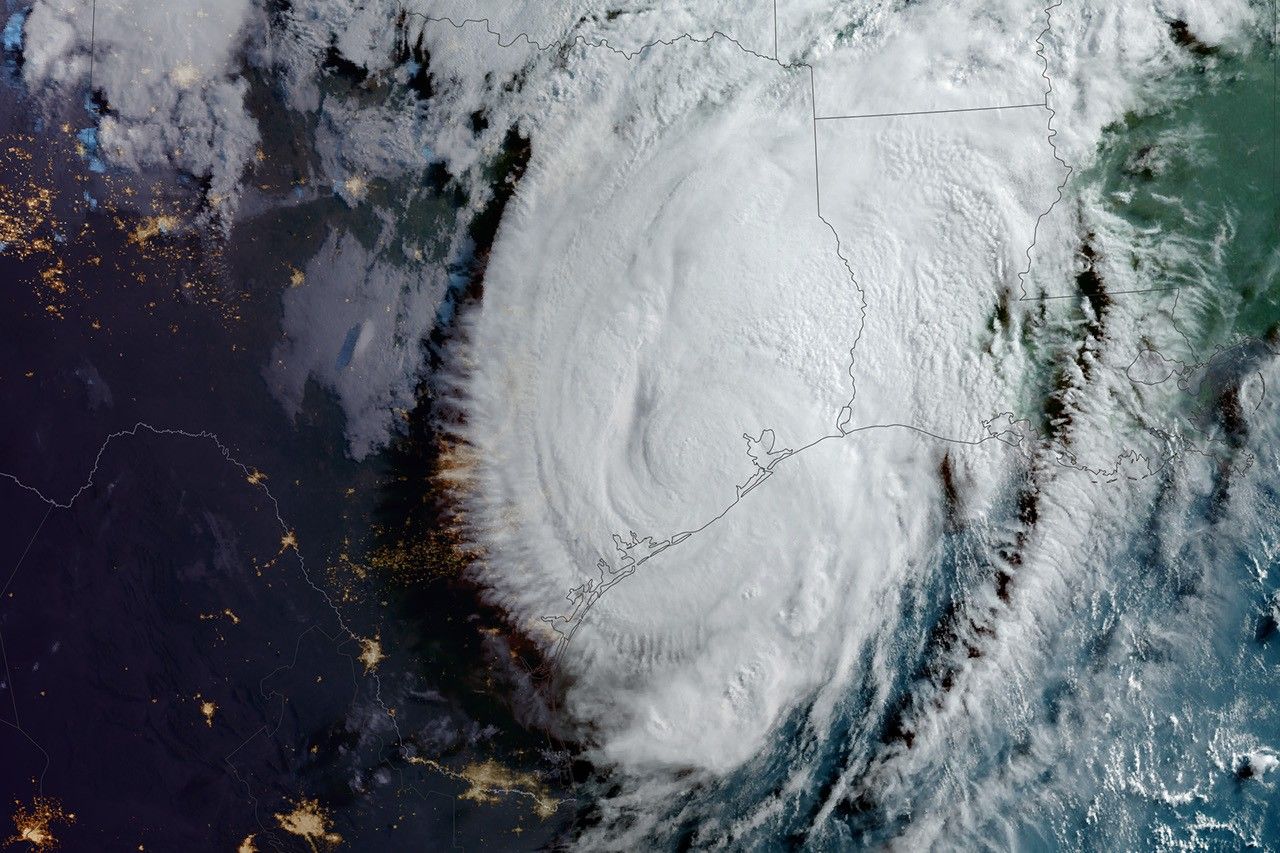
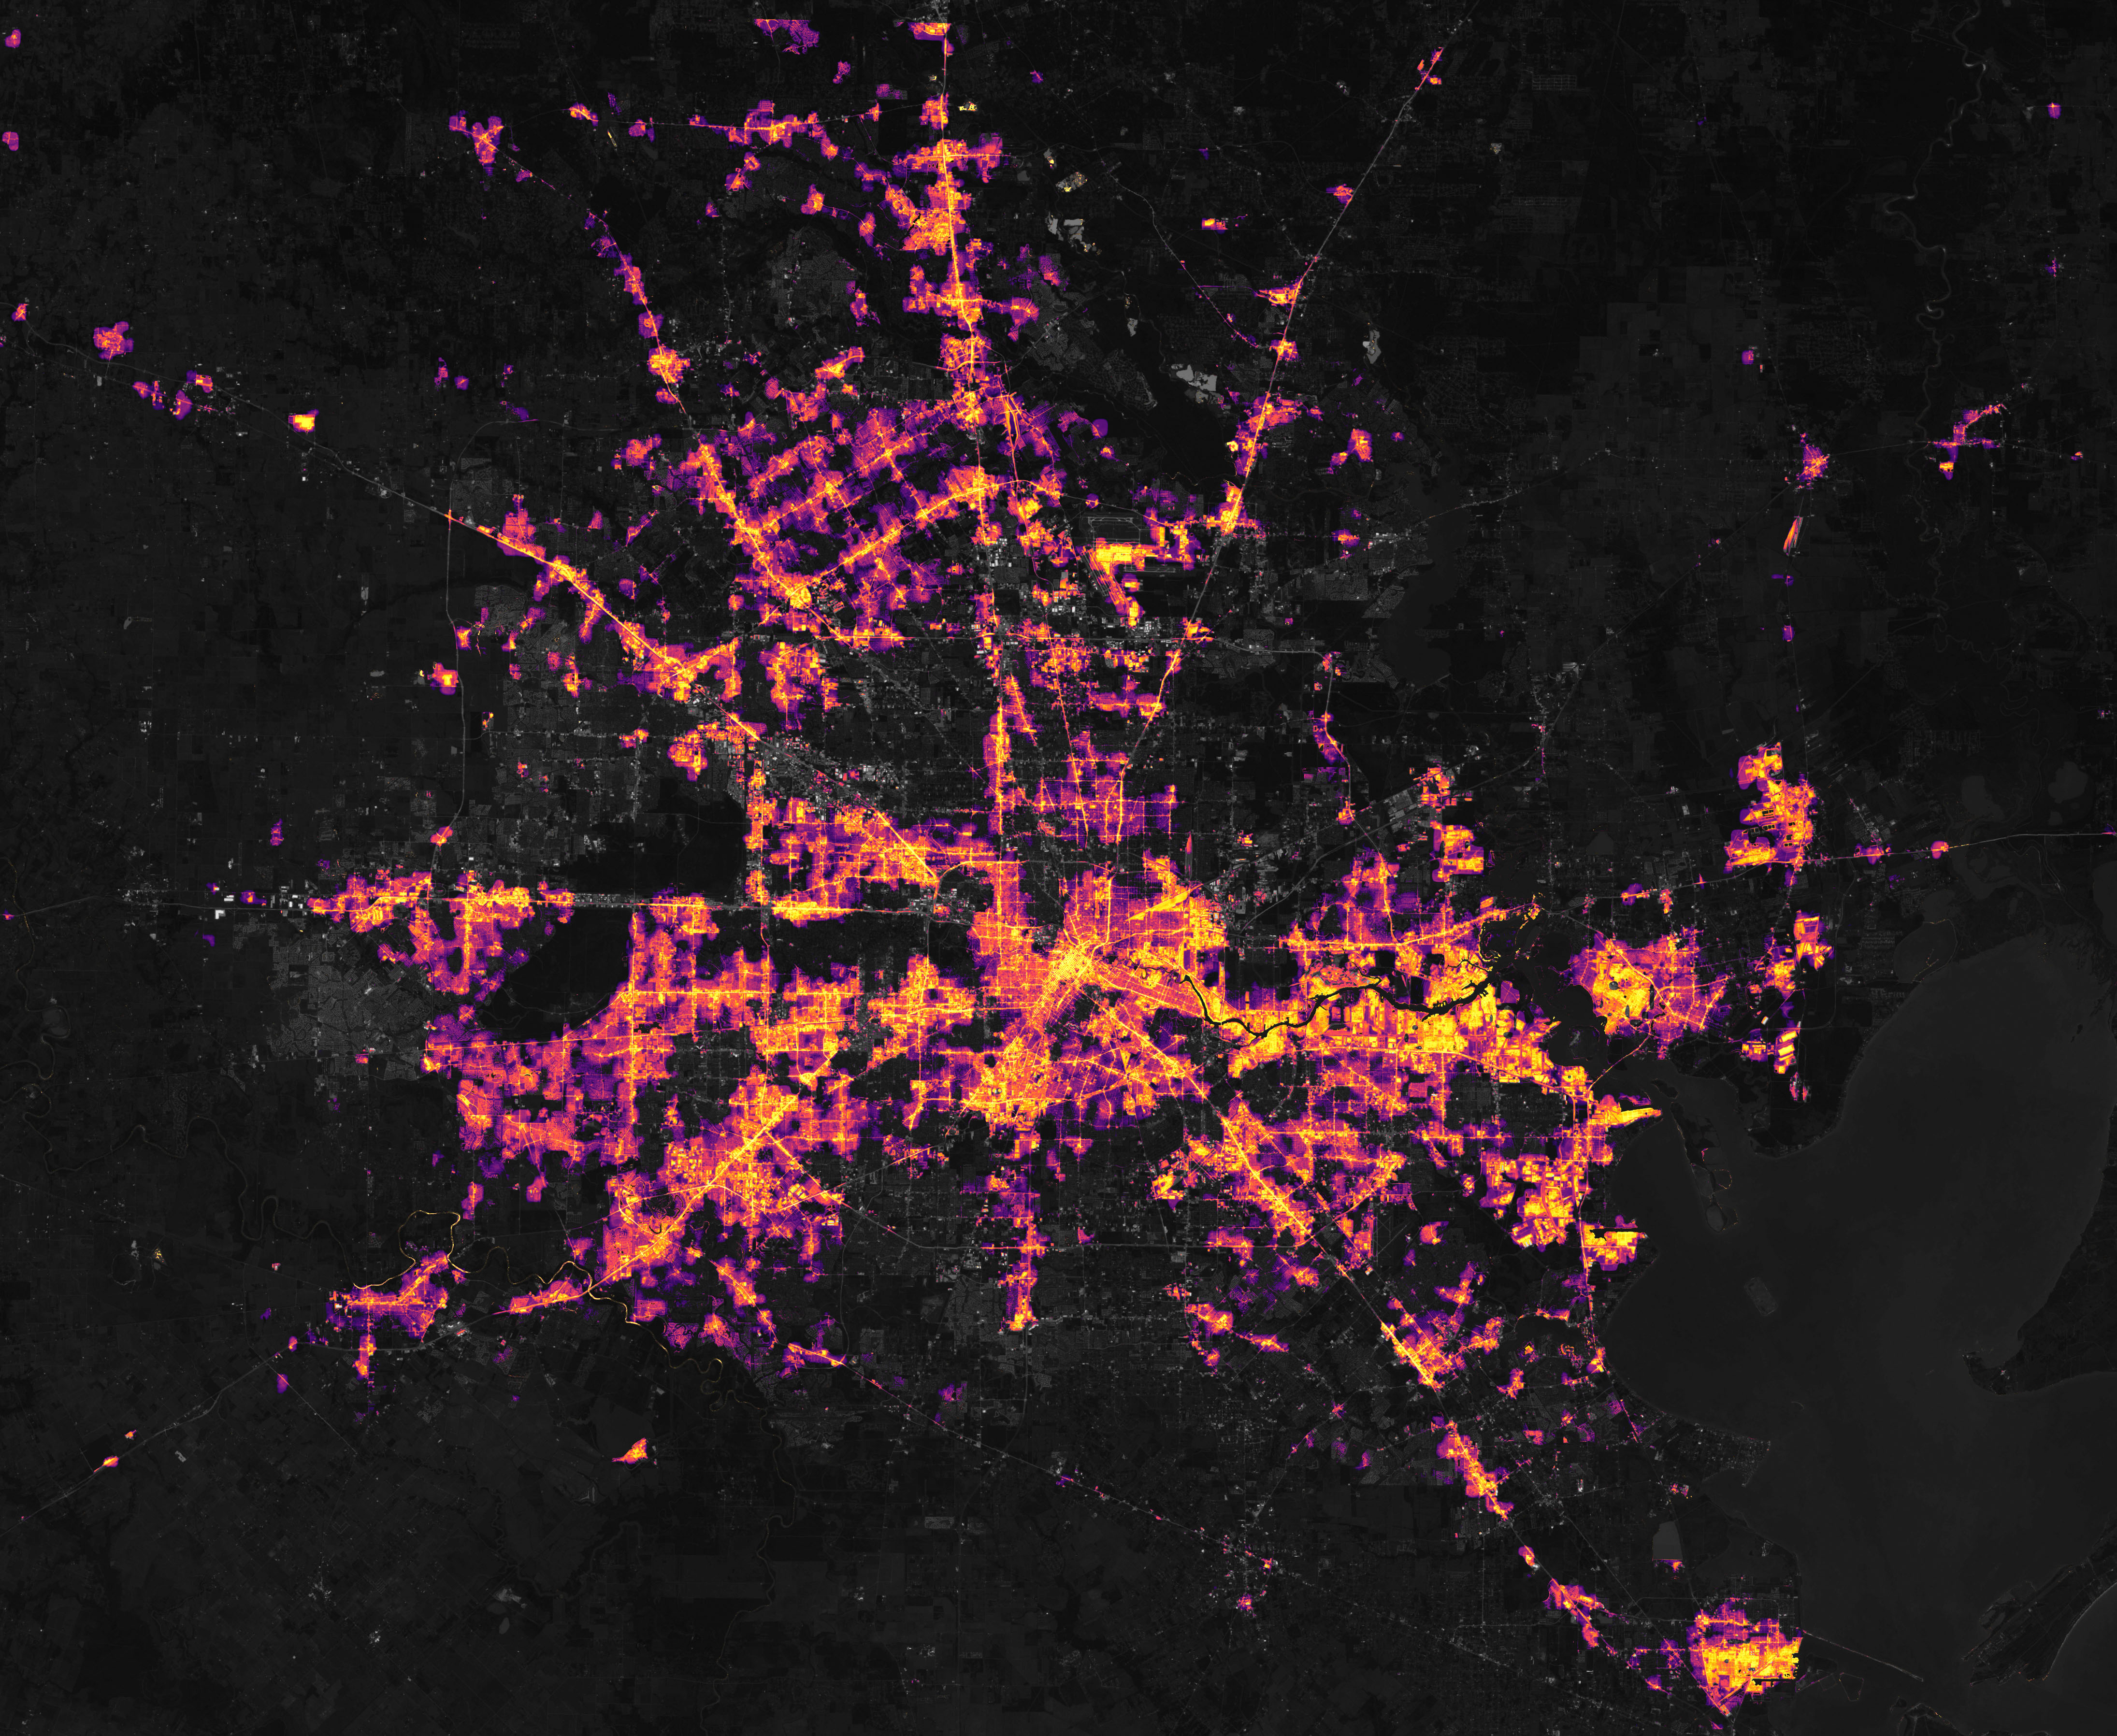
Hurricane Beryl: The 2024 Houston Blackout
Hurricane Beryl was the inverse of a heat wave: one city's demand collapsed, the price fell through the floor, and the lights stayed off for nine days into a 106-degree heat index that killed mostly the old. Walk the outage hour by hour, then read what the grid cannot show you.

The 2024 Solar Eclipse and the Texas Grid
The April 2024 eclipse cut ERCOT solar output by more than 90 percent in the span of a single hour, a supply shock the size of a small country's grid, perfectly predictable, planned for a week ahead, and absorbed without an emergency. Watch the mirror image of solar collapsing and gas rising on celestial time.
Winter Storm Uri: The 2021 Texas Grid Collapse
Winter Storm Uri drove ERCOT demand to an all-time winter peak while more than a thousand generating units froze offline. Walk the four days that nearly took the grid down, in the live data that recorded every hour of it.