Hurricane Beryl: The 2024 Houston Blackout
July 8, 2024. A category 1 hurricane cut power to 2.2 million people, and on the grid you can watch one city's demand fall away while the rest of Texas held steady.
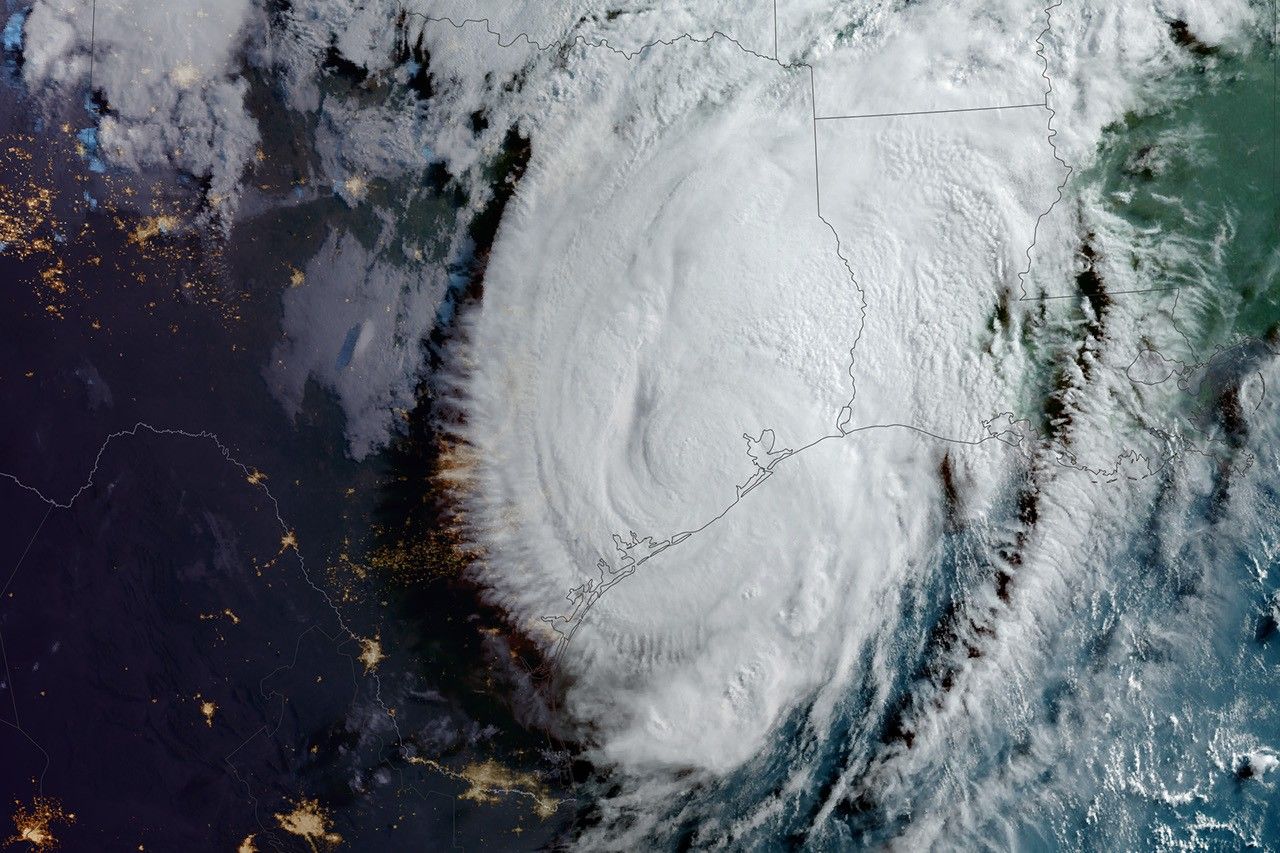
Beryl did most of its damage in Houston as a comparatively weak storm. By the time it reached Texas its peak intensity was already behind it. A week earlier, out over the Caribbean Sea, it had become the earliest category 5 hurricane ever recorded in the Atlantic basin, peaking at 145 knots on July 2, an intensity the tropics usually do not reach until deep into the season. Then it did what most storms do over cooler water and land: it weakened. When its eye crossed the coast near Matagorda at 3:40 a.m. local time on July 8, the National Hurricane Center clocked maximum sustained winds of 80 knots, roughly 92 mph, just shy of category 2, the kind of storm the Gulf Coast sees most summers.

What it carried inland was wind, not water. The storm's center passed over the western side of the Houston metropolitan area through the late morning of the 8th, weakening to a tropical storm as it crossed the nation's fourth-largest city, and its gusts were strong enough to snap transmission structures and drop limbs across thousands of distribution lines at once. This distinction defines everything that follows, and it is worth fixing in mind before the data starts: the Houston blackout was a physical failure of poles and wires inside CenterPoint Energy's distribution network, not a shortage of power on the wider grid. ERCOT, the market that runs the Texas grid, had electricity to spare that morning. What it did not have, in Houston, was a way to deliver it. By mid-morning the damage was done, and the largest metro in Texas began dropping off the grid in real time.
Press play and watch the , the band around Houston and the Gulf, lose demand through the morning of the 8th while the rest of the state holds its ordinary summer rhythm. The cloud mass is the storm; the color fading from the coast is the city losing its grid.
The grid fell out from under one city#
Demand is the clearest measure of the outage, and on the morning of July 8 Houston's fell sharply. At 9 a.m. UTC the was pulling 11,571 MW, a normal summer morning. Eight hours later it was at 4,935 MW, the lowest reading of the whole event, recorded at noon local time (ercot.system_load). More than half the region's electricity demand had not fallen because people stopped wanting it. It had been cut off, because 2.2 million CenterPoint customers, roughly 80 percent of the utility's Houston-area meters, no longer had a grid to draw from. Nearly 2.8 million customers across southeastern Texas went offline in total, and close to 3 million people lost power statewide, in what the utility's own history records as its widest outage to date.
The sign that this was an outage and not the weather is the line beside it. A heat wave pushes every zone up together; load climbs across the whole state as air conditioners strain. A hurricane that knocks out wires takes one city and leaves the rest untouched. Over the same eight hours that Houston's demand dropped, North Texas, the Dallas-Fort Worth load, ran its ordinary daily curve. Dallas is the control group, unchanged throughout.
The weather record explains the timing. ERA5 reanalysis over the Houston and Matagorda coast (open_meteo.era5_grid) shows the wind peaking near 28 m/s at landfall in the early hours of the 8th, then easing. The demand trough comes hours later, around noon. That lag is the signature of a distribution failure: the wind does the damage at dawn, and the meters keep dropping offline through the morning as the network fails and crews have not yet begun to restore it.
The price fell through the floor#
When a region loses generation, the price spikes; that was Winter Storm Uri, when the whole ERCOT grid sat at its $9,000 ceiling. When a region loses its load, the opposite happens: there is suddenly far more power available than there is demand to use it. Through the afternoon of the 8th, as Houston sat dark in 95-degree heat, the Houston hub price fell below the North hub for the first time all week, averaged $8.04 for the day, and at 1:20 p.m. local touched negative $37.69 per megawatt-hour (ercot.lmp_by_settlement_point). For those minutes the price of electricity in the fourth-largest city in the country was below zero. The market was, in effect, paying to dispose of power that two million darkened meters could no longer absorb.

What the price chart registers as a number, a satellite registered as an absence of light. NASA's Black Marble instrument, which maps nighttime lights from orbit, captured the outage from space: a comparison of Houston on July 5 against July 9 shows the city's familiar grid of light extinguished across whole neighborhoods. On the ground, people inside that darkness could not readily find out when it would end. CenterPoint's online outage tracker had been knocked offline by a separate May 2024 derecho and was still down when Beryl hit, so for days customers had no official way to see where power was out or when it might return. The blackout was both literal and informational.
Why the wind stopped too#
There is one more counterintuitive detail in the data, and it is a useful lesson in how grids meet weather. The wind that took the lines down also shut down the wind farms. A utility-scale turbine feathers its blades and stops generating above roughly 25 metres per second to avoid mechanical damage, so as Beryl's gusts peaked along the coast, the coastal wind fleet (ercot.wind_generation_geo) did the opposite of what a windy day would suggest. Output fell from about 1,800 MW overnight to 108 MW by late afternoon, bottoming out at the same hours the storm was strongest. The wind was not too weak to generate. It was too strong. On the windiest day of the summer, the coast's largest weather-driven resource went quiet because the wind was highest.
Nine days in the dark#
The wind was gone by the evening of the 8th, but the lights were not yet coming back. Restoring a heavily damaged distribution network is slow, manual, pole-by-pole work, and it was happening under a quick return of dangerous heat. Two days after landfall more than a million customers were still out. The Coast zone's daily peak demand, a fair proxy for how much of the city was reconnected, did not return to normal for nine days. Drag the scrubber below across July 9, then read the recovery off the table beneath it: Dallas holds 22 to 26 GW the entire time while the Coast recovers.
| Date | Coast peak MW | Dallas peak MW | Coast vs normal |
|---|---|---|---|
| Jul 5 | 21,524 | 24,562 | normal |
| Jul 7 | 15,231 | 23,765 | -29% |
| Jul 8 | 14,466 | 23,027 | landfall |
| Jul 9 | 11,666 | 22,740 | -46% |
| Jul 11 | 13,797 | 24,854 | -36% |
| Jul 13 | 15,233 | 23,647 | -29% |
| Jul 15 | 19,306 | 26,055 | -10% |
| Jul 16 | 20,542 | 25,802 | recovered |
Each row in that table is a day, and every day the gap stayed open was a day measured in something the grid does not record. The slow climb from the Jul 9 trough back to a recovered Coast on Jul 16 is, read plainly, an engineering curve. Read against what was happening inside those homes, it is the duration of the emergency.
The heat that followed#
The grid data ends when the power comes back. The effects of the storm did not. Beryl came ashore in July, and the days that followed brought a heat wave to a city where more than a million people still had no air conditioning, with heat advisories and a heat index reaching about 106 degrees. This is the central gap in the event: the hurricane itself was survivable, a weakening category 1 that most of the coast came through. What caused most of the deaths was the aftermath, the extended heat and loss of power that followed, and it fell hardest on those least able to escape it.
Hurricane Beryl was ultimately blamed for at least 44 deaths in the Houston area, and 75 percent of the victims were 60 or older. Of the 34 deaths the National Hurricane Center classified as indirectly caused by the storm, all 34 occurred in Texas, and 14 were heat-induced hyperthermia caused by the widespread electrical outages. The agency documented one death when an outage made a breathing machine fail, and two more from carbon monoxide poisoning as residents ran generators for relief. Harris County Public Health logged 553 heat-related illness encounters in the single week of July 9 to 15 as the city went without power. Behind the numbers are individual cases. Pamela Jarrett, 64, who used a wheelchair and relied on a feeding tube, died on her fourth day without electricity at her home in Spring, just north of Houston. Some Houston seniors went without power for as long as six days.
“It's so hard to know that she's gone right now because this wasn't supposed to happen to her.”
This is the part of a grid failure that the instruments above cannot reach, and it is the part that matters most. A demand curve can show that a city lost half its load for nine days. It cannot show a 64-year-old woman dying of heat in her own home four days after a storm that, by the standard of Gulf Coast hurricanes, was a moderate one. The human toll is what makes the outage significant.
“If I just tell you 200 people died, it doesn't tell you that story of what went wrong for these people.”
The grid that held#
It is worth being precise about what failed, because the simple story is the wrong one. The blackout was not a Texas grid that ran out of power. The wider ERCOT system had a strong summer. Even as Houston went dark from physical line damage, the broader grid met the season's record electricity demand of 85,559 MW on August 20, 2024 without a single conservation appeal, compared with the 11 conservation calls of the summer before. The failure was local and physical: trees, poles, and wires inside one utility's distribution network, in a service territory whose outage tracker had been down since May. The supply was there. The delivery was not.
“We've had a very different experience operating the ERCOT grid this summer.”
Who answers for it#
By the time the Coast was whole again, the storm had become a political issue. On July 14, Governor Greg Abbott publicly reprimanded CenterPoint and gave the utility until July 31 to deliver a plan to cut hazardous vegetation, prepare for storms, and pre-stage crews. The Public Utility Commission of Texas opened a formal investigation into the company's preparation and response, and on November 21, 2024 released an investigative report recommending more than a dozen fixes to emergency plans, communications, vegetation management, and infrastructure. The question that has followed Texas grid failures since 2021, who is responsible for keeping the lights on, now attached to a new utility.
“The failure of power companies to provide power to their customers is unacceptable. CenterPoint has repeatedly failed to deliver power to its customers.”
The damage the storm itself did was substantial. The NOAA National Centers for Environmental Information put Beryl's U.S. property damage at $7.2 billion, and the Texas Department of Emergency Management counted 239 buildings destroyed and 2,555 damaged in the state. But the lasting story of Beryl is not the wind. It is the nine days that came after a survivable storm, the 106-degree heat index over darkened homes, and the 44 mostly elderly people who did not live to see their power restored. The grid can show the outage in a single clean line. The rest of it, the reason the outage mattered, lies in the gap between when the wind stopped and when the lights came back.
Everything above is the same live ERCOT data behind Ask the Grid. The figures come from ercot.system_load, ercot.lmp_by_settlement_point, ercot.wind_generation_geo and open_meteo.era5_grid. Open ERCOT on the main map and scrub the week of July 8, 2024 yourself.