Winter Storm Uri: The 2021 Texas Grid Collapse
February 2021. A grid built for 110F summers met minus 29C, 246 people died, and the interconnection came within four minutes and 37 seconds of an uncontrolled blackout that could have taken weeks to recover from. Here is what happened, hour by hour.
At the start of the second week of February 2021, it looked like an ordinary cold snap. Forecasters had been warning for days that an Arctic air mass was about to spill out of the plains, but Texas is a summer-peaking grid: its reliability planning, its plant winterization, and its operating assumptions about peak stress are all built around 110F afternoons in August, not ice. The cold arrived as forecast, and then it did the thing the system was least prepared for. It stayed for days.
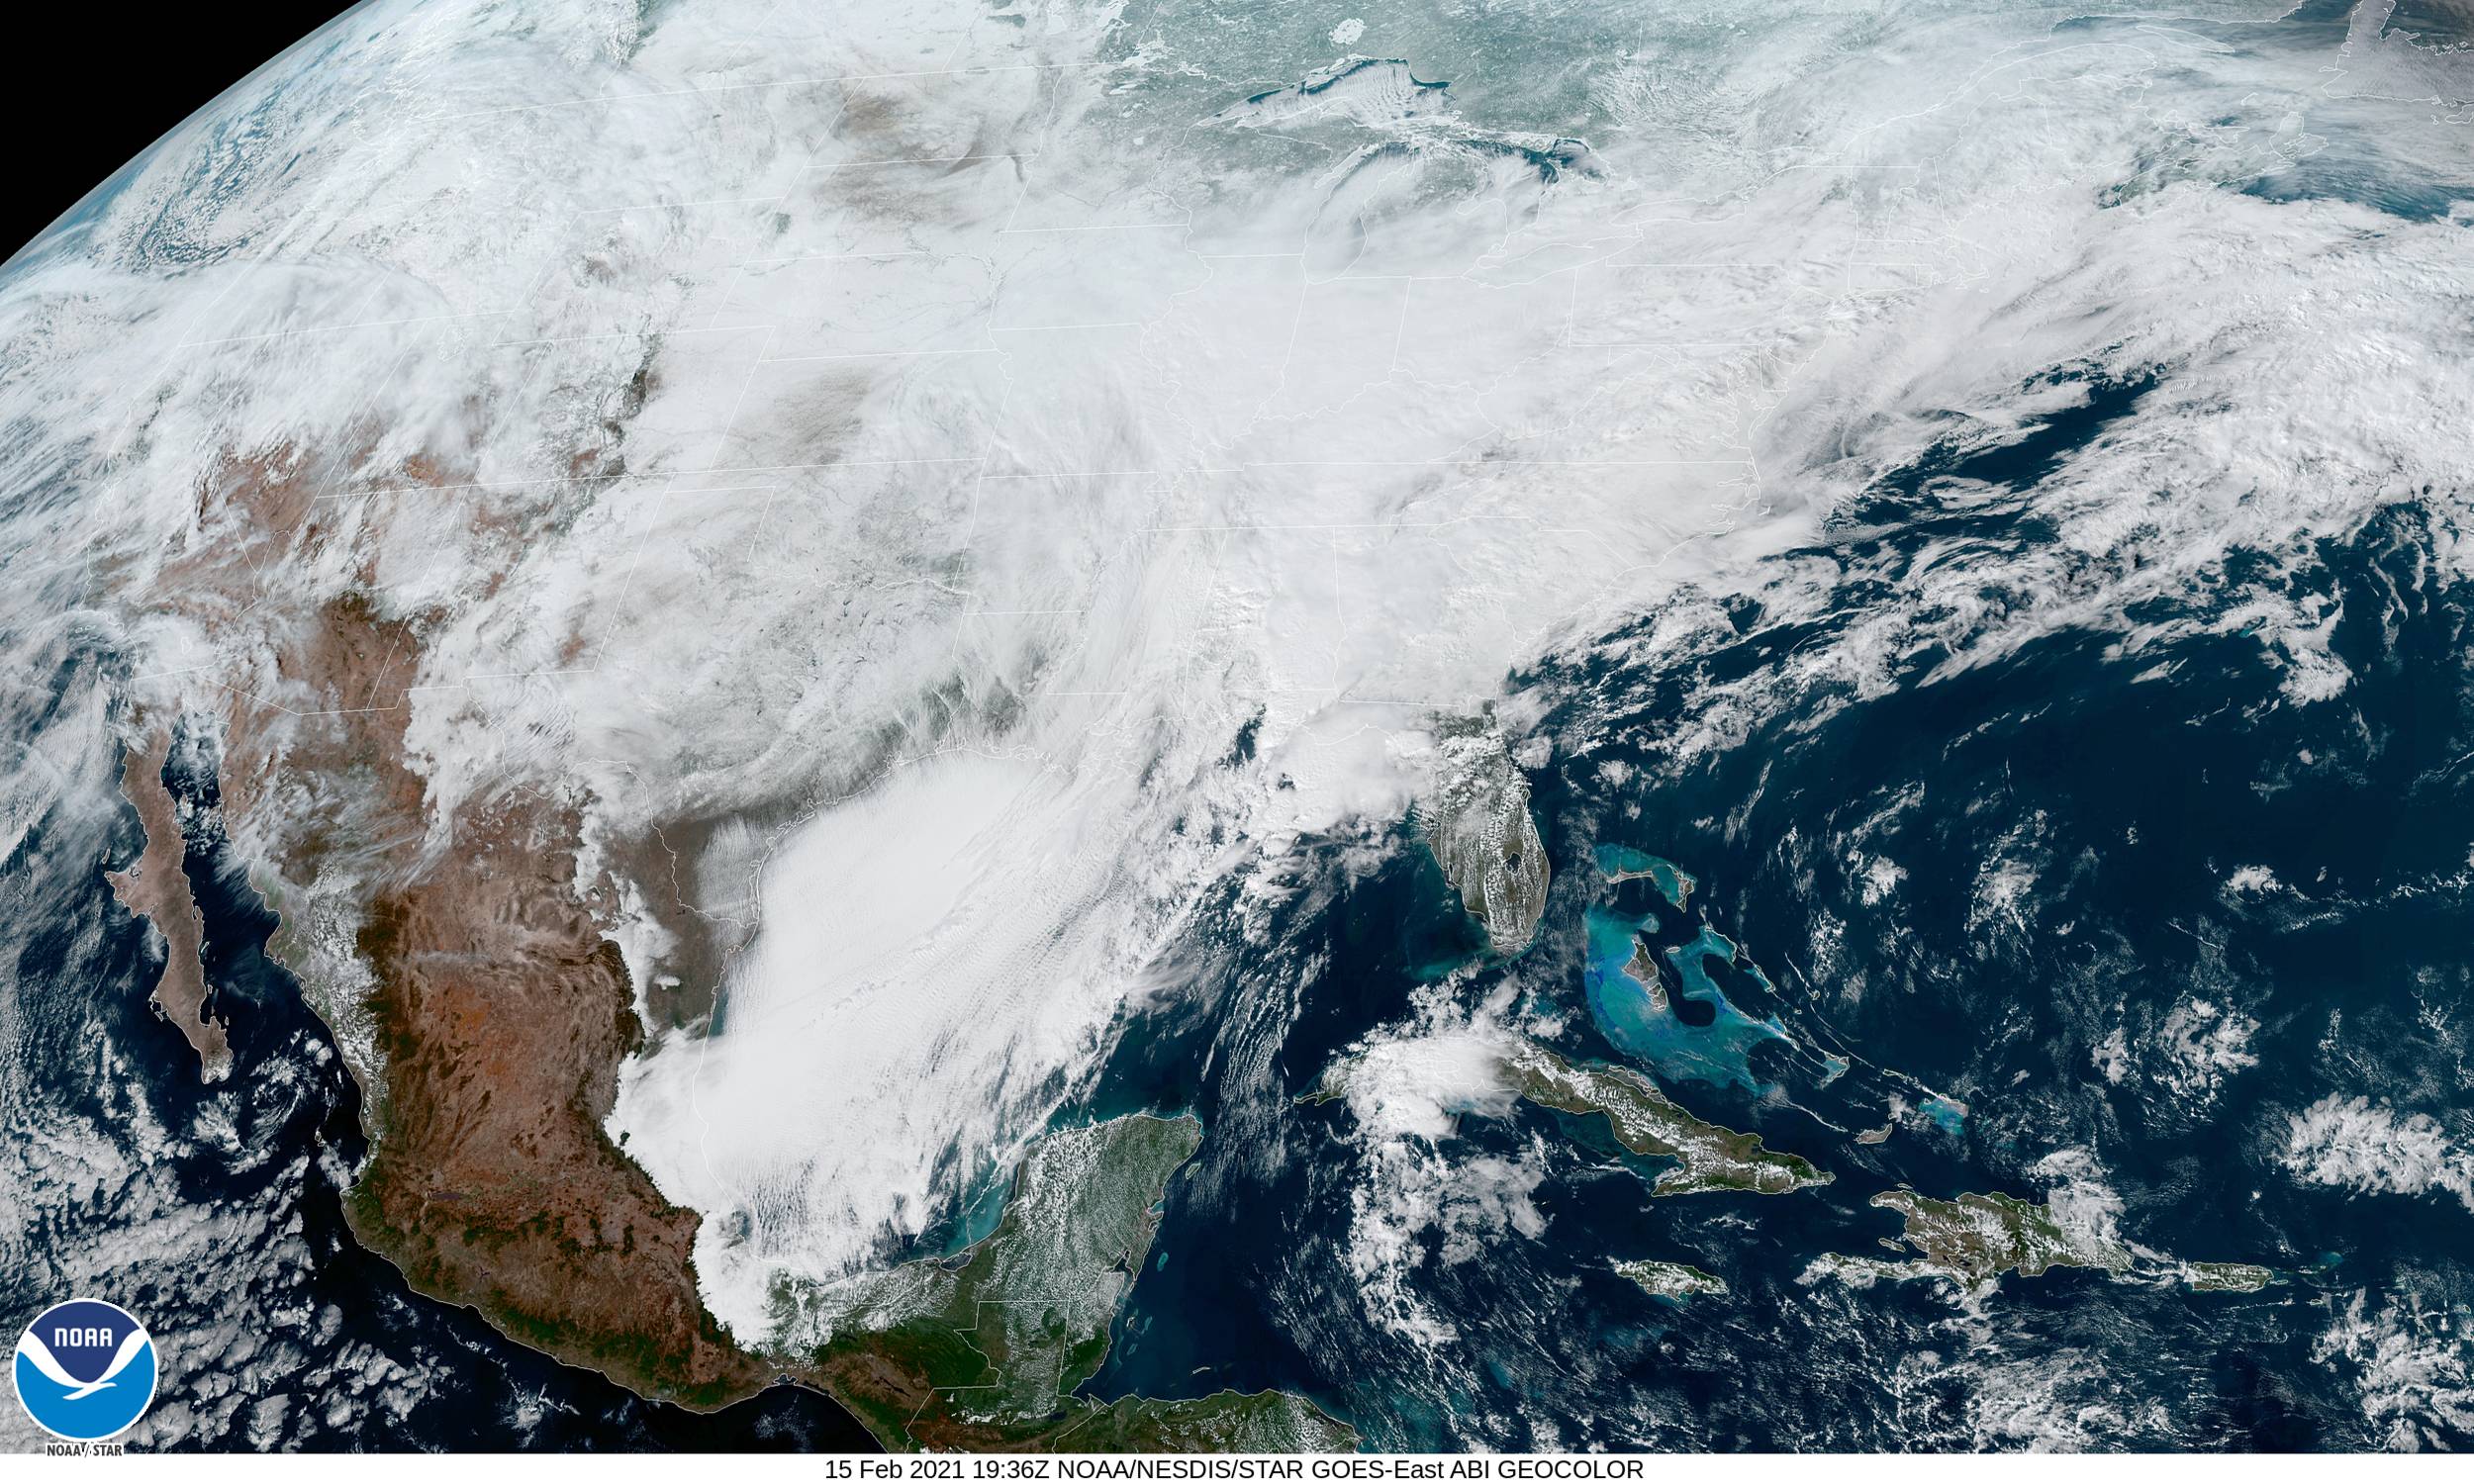
On a satellite map the system looks unremarkable: a pale lobe of cloud sliding down the middle of the country. On the ground it was a deep polar outbreak that led the National Weather Service to put all 254 Texas counties under a winter storm warning at the same time, a statewide alert it rarely issues. Dallas/Fort Worth fell to minus 2F on February 16, the coldest reading in North Texas in 72 years. For a stretch of that week, Dallas, Austin, Houston and San Antonio were each colder than Anchorage, Alaska.
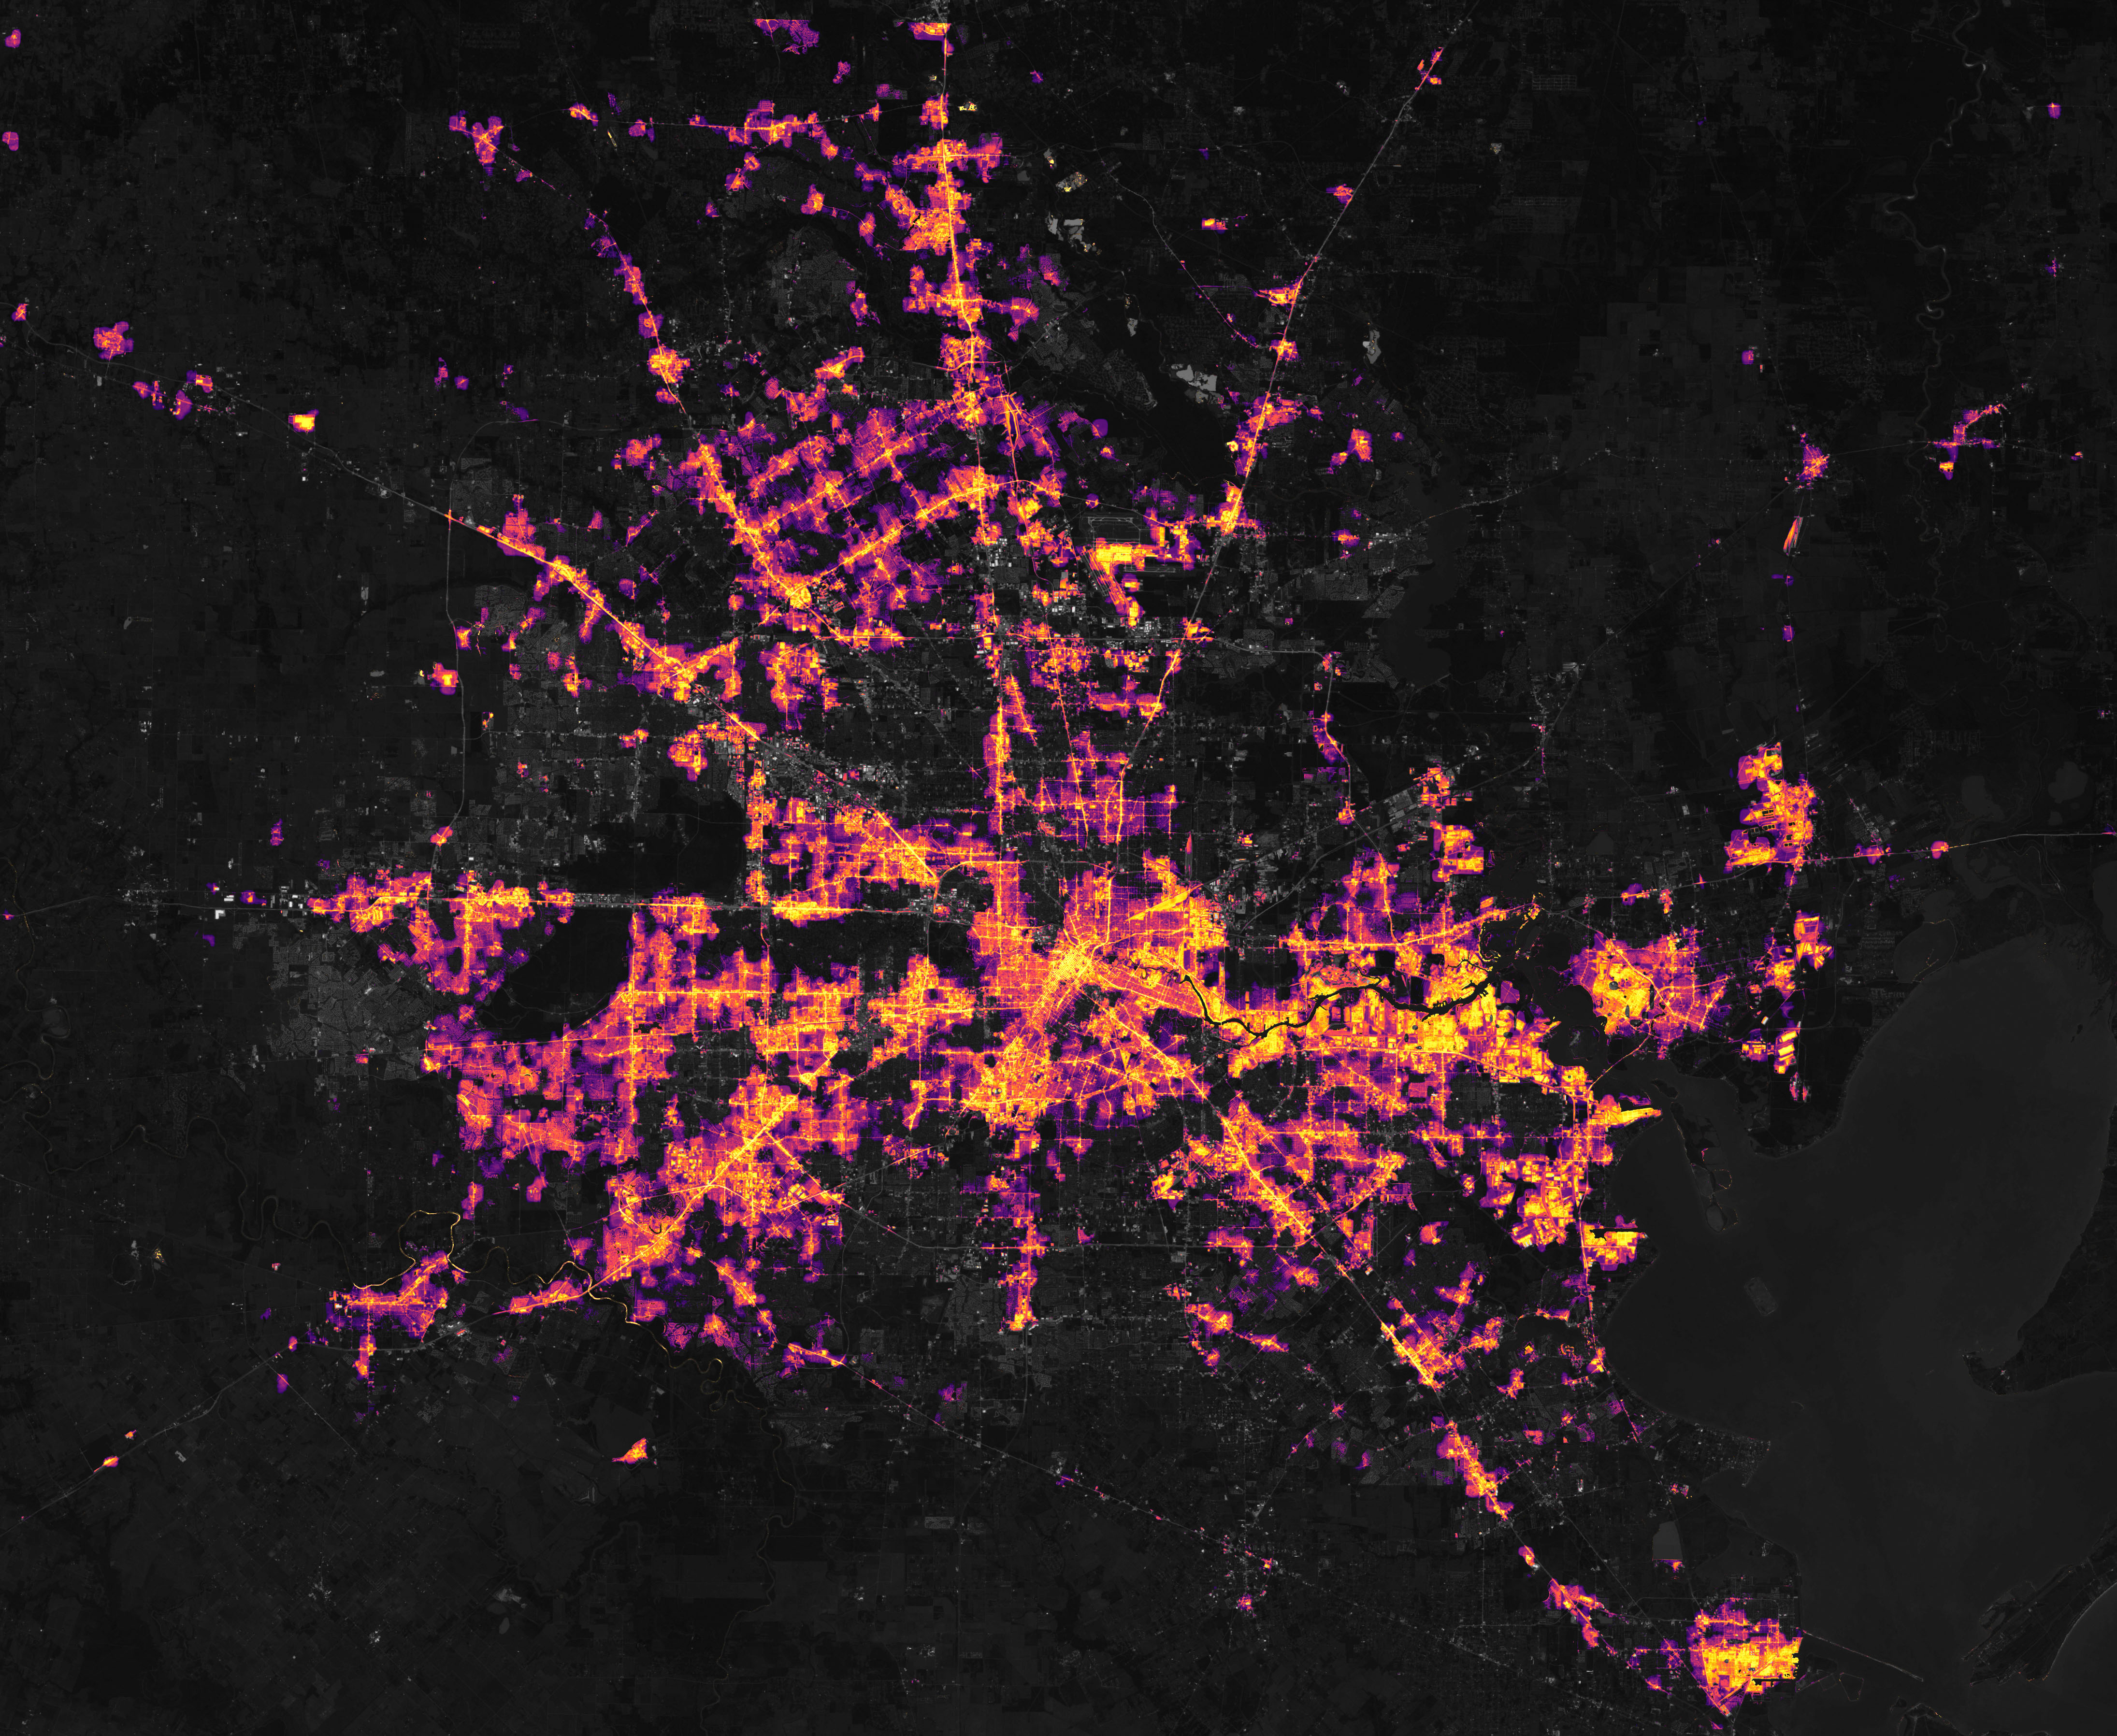
The image shows a metro of more than seven million people, photographed from orbit during the outages. NASA released it alongside a frame of the same ground nine days earlier, fully lit. The storm had a continental footprint: a single system that blanketed the central and eastern United States and pushed hard freeze warnings as far south as the Rio Grande Valley, which rarely freezes.
It moved down the Panhandle on the 13th, Amarillo already at minus 16C, and over the next 48 hours it slid southeast across the state. Heating demand rose across Texas at once. Demand climbed through the night of the 14th to 69,222 MW, the most electricity ERCOT had ever been asked to deliver in winter, and it was still rising when supply gave way before it could peak. The map below is the ERCOT record for those four days. Press play to step through the storm hour by hour.
Demand met a wall it could not serve#
Two things failed at the same time. Demand ran well above the day-ahead forecast as heating load built up, and supply fell in the cold as gas wellheads froze, instrument lines iced over, and units tripped offline. The two failures compounded each other: each megawatt of generation that dropped out left the remaining plants working harder in conditions they were not built for, and each degree the temperature fell added load the system could no longer cover. The served-demand series (ercot.system_load) against the day-ahead forecast (ercot.load_forecast) shows the gap opening below. That shaded gap is the part of Texas that was disconnected to keep the rest of the grid stable. Even around Houston, which rarely freezes, went sub-zero.
The supply side was large in scale. When the federal regulators finished their inquiry, they documented more than a thousand generating units failing thousands of separate times across the region, taking roughly 61,800 MW of capacity off the grid at the peak of the outages, on the same days demand reached a record.
The report clarified a point the public debate had blurred. In the days after the storm, a common explanation was frozen wind turbines, and turbines did freeze. But the federal investigators found the largest share of lost capacity came from the thermal fleet, not wind, and that a single upstream failure sat beneath most of it: the natural gas system. Frozen wellheads and freeze-offs, plus power losses at the wellheads and gathering facilities that themselves depended on the grid, drove Texas gas production down by roughly 45 percent while gas-fired plants were carrying much of the state's load. The fuel system and the power grid failed together, each contributing to the other's decline.
“The root cause of most generating-unit outages was the cold weather itself (freezing of plant equipment and components, and natural gas fuel supply issues), and the large majority of these failures were preventable.”
One piece of the generation story can be shown directly from the live record, and it puts the wind argument in context. Wind output did fall sharply as turbines iced and feathered, but the more useful number is the available wind capacity declining beside the actual output (ercot.wind_generation_geo). It was a real loss, but not the whole loss. Set against the tens of thousands of megawatts the thermal and gas fleet shed, the wind decline below was a contributing factor in a much larger failure, not the primary cause.
Four minutes from the brink#
At 1:20 a.m. on February 15, with frequency falling as supply dropped away, ERCOT declared Energy Emergency Alert 3 and ordered firm load shed. Cutting demand was the remaining option between a controlled blackout and an uncontrolled one, and the difference between the two matters. A controlled blackout is rolling outages: disruptive, and dangerous in a deep freeze, but recoverable. An uncontrolled one is set by the physics of the grid rather than the operators, with protective relays tripping in a cascade as frequency collapses, generators islanding to protect themselves, and an interconnection that has to be rebuilt from a near-zero state.
ERCOT later detailed how close that second outcome came. As units fell off, system frequency dropped below 59.4 Hz, the threshold that, if it had held there for nine minutes, would have triggered an automatic statewide blackout. The grid sat under that line for 4 minutes and 37 seconds. Recovery from such a blackout, a so-called black start, would not have been measured in hours but in weeks, and possibly months, with much of Texas without power in the cold.
“That is the thing that we cannot allow to happen. Because if we have a blackout of the system, the system is out for an indeterminate amount of time. We may still be here today talking about when is the power going to come back on if we had let the system get into that condition.”
The blackout was avoided, but rotating outages, which began at 1:25 a.m. on February 15, stopped rotating. There was so little generation that the outages could not be cycled neighborhood to neighborhood the way the plan assumed; for millions of households the power went out and stayed out. At the peak, more than 4.5 million Texas homes and businesses were without power, some of them for as long as four days, in a week when the inside of an unheated house could fall below freezing.
What it cost in lives#
This is the part the load chart cannot show. The Texas Department of State Health Services put the official death toll at 246 people across 77 counties, from infants to a 102-year-old, most of them from hypothermia. A later statistical analysis by BuzzFeed News estimated the true figure may have reached around 702, once excess deaths the official tally missed are counted. Either number places Uri among the deadliest weather disasters in modern Texas history.
Much of that harm came from people trying to stay warm in homes that had lost power, running cars and gas generators for heat and causing hundreds of carbon-monoxide poisonings across the state. That harm came from the loss of power rather than the weather directly, which is part of what a grid failure of this scale means: the effects do not stop at the substation but reach into the homes that depend on it.
The effects extended from heat to water. As pipes burst and treatment plants lost power, boil-water notices reached roughly 14.5 million Texans across 1,105 public water systems between February 15 and 19. For several days a large share of the state had neither reliable heat nor safe tap water, the two problems overlapping in the same cold homes.
On the market, the ceiling held#
As the grid shed firm load, the Public Utility Commission ordered prices held at the system-wide offer cap. For roughly four days, the price of power in Texas sat at $9,000/MWh (ercot.lmp_by_settlement_point), about two hundred times a normal winter price of $25 to $50, whether or not that price was clearing any new supply. The scale of the resulting charges was large: by one accounting of ERCOT settlement data, the cost of electricity on February 16 alone came to about $10.3 billion. ERCOT's own independent market monitor, Potomac Economics, later concluded the commission's directive kept prices at the cap for about 32 hours longer than market conditions alone warranted, which it valued at $16 billion in additional charges.
“Prices were held above competitive levels for the 32 hours after load shed ended, resulting in $16 billion in additional costs to ERCOT's market.”
The $9,000 energy cap was not the highest price in Texas that week. In the market for operating reserves (ercot.as_prices), the standby capacity ERCOT pays to keep on hand in case it is suddenly needed, the responsive-reserve price rose past the energy cap to $25,674/MWh on February 17, because there was almost no reserve left for it to clear against. As the available reserve approaches zero, the price of holding it rises sharply.
By the numbers#
| Date | Min temp C | Peak served MW | Forecast MW | Load shed MW | HB_NORTH avg $ |
|---|---|---|---|---|---|
| Feb 13 | -15.8 | 63,686 | 63,721 | 0 | 1,716 |
| Feb 14 | -24.5 | 65,974 | 66,115 | 0 | 1,465 |
| Feb 15 | -26.7 | 69,222 | 78,993 | 9,771 | 5,451 |
| Feb 16 | -29.1 | 46,855 | 79,861 | 33,006 | 3,971 |
| Feb 17 | -18.9 | 46,322 | 56,813 | 10,490 | 2,513 |
| Feb 18 | -20.5 | 55,426 | 49,301 | 0 | 862 |
The bills did not go away#
The thaw came on the 20th and demand normalized; the HB_NORTH price fell back to $392 (ercot.lmp_by_settlement_point). The financial effects, however, outlasted the weather. Electric cooperatives that had bought power at the cap faced bills they could not pay. Brazos Electric, the state's oldest and largest co-op, filed for bankruptcy within two weeks, and the dispute over who should bear the $16 billion in overcharges continued through the legislature and the courts for years.
The total cost, beyond the wholesale market, was far larger. The Texas Comptroller and University of Houston researchers put storm losses in the range of $80 billion to as much as $295 billion, which would make Uri the costliest disaster in Texas history. The accountability extended beyond money as well. ERCOT's CEO, Bill Magness, was removed by the board; the chair of the Public Utility Commission resigned; and the lieutenant governor summarized his view of the agencies in a widely quoted line.
“In short, they hoped for the best instead of planning for the worst.”
What changed after#
The formal review arrived in November 2021, when FERC and NERC released their final report: 28 recommendations, built around two changes the system had resisted for years. Generators would have to be winterized, as a requirement rather than a suggestion, and the natural gas and electric systems, which Uri showed behave as one system in a cold snap, would have to coordinate more closely than the arrangement that failed in February. Texas followed with its own winterization mandates and inspection regime. These changes can only be fully tested by the next storm.
“Extreme weather events, such as the one in February 2021, are unfortunately becoming more commonplace and the electricity ecosystem needs to come together to plan for and prepare to operate under more extreme, longer duration, and wide area weather events.”
That is the note Uri ends on. The storm was not a one-off that cannot recur; it was the kind of wide-area, long-duration event the people who run the grid now expect to see more often, not less. Everything above, every hour of demand, every price spike, every degree of the freeze, is drawn from the same live ERCOT data behind Ask the Grid. The record captured the worst four days the Texas grid has had, and it will capture the next ones too. Open ERCOT on the main map and scrub the week of February 15, 2021 yourself.