Canada and Mexico join the grid
Alberta, Ontario, Québec and Mexico are live beside the US grids, each with its own map and Radar, its own currency and clock, and a North America view that holds all thirteen.
Power does not stop at the border, and the workspace no longer does either. Alberta (AESO), Ontario (IESO), Québec (Hydro-Québec) and Mexico (CENACE) are live in Ask the Grid, each with its own map and Radar and each answerable by the grid agent. Choose one from the grid switcher, where grids are listed by country, or open the North America view to see all thirteen at once.
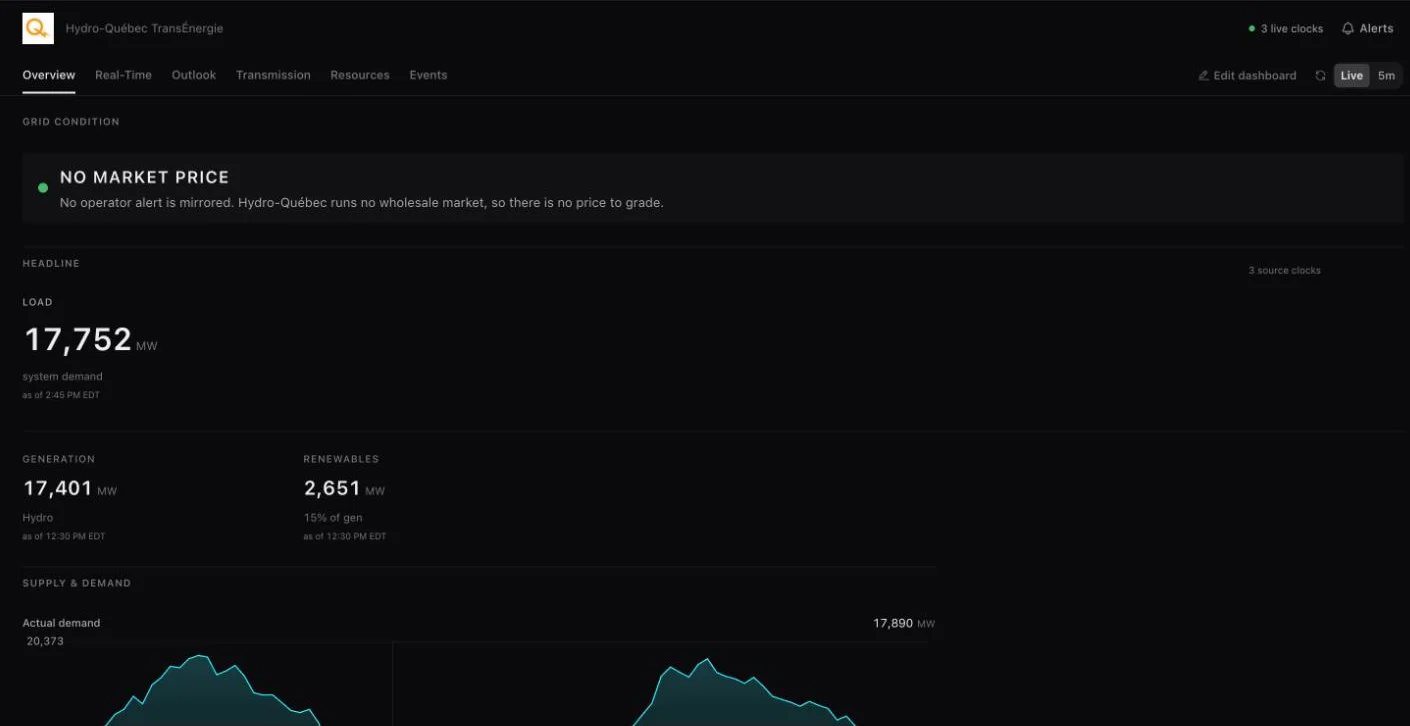
Each grid is read the way its operator publishes it. Alberta and Ontario are priced in Canadian dollars and Mexico in pesos, and each grid's own map, Radar and answers keep that currency. Hydro-Québec runs no wholesale market, so its workspace has no price at all and is read through demand, water and exchanges. Source, unit and update time travel with every reading, as they do for the US grids.
Thirteen grids, three countries
The grid switcher lists every live grid under its country: the seven US markets, Bonneville and Baja California, and now AESO, IESO, Hydro-Québec and CENACE. Each has a map of its transmission lines, substations and plants, a Radar built from the desks its publications can fill, and a market page that says what is covered and at what cadence.
The grid agent answers in each grid's own terms. Ask what Alberta's system marginal price is, how much of Ontario's supply is nuclear this hour, what Québec is sending to New York, or which of Mexico's control regions has the highest demand, and the answer names the publication it read.
One view of the continent
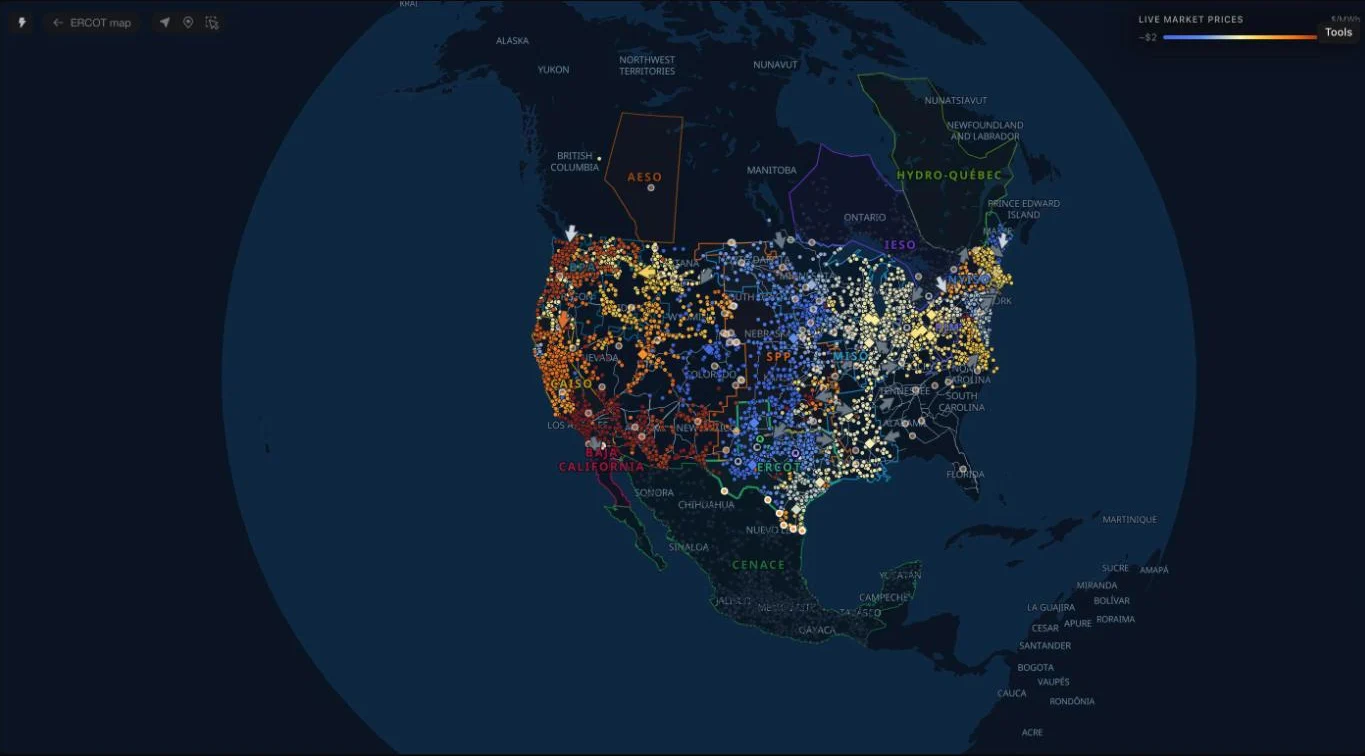
The North America view opens on every live grid at once, so a tie can be followed across a border: New York into Québec, Ontario into Michigan, California into Baja California, Alberta into British Columbia. Each footprint is drawn and labelled, and the grid switcher opens any of them on its own map.
The view's price scale is in US dollars. Mexico's nodes join it converted at the published peso exchange rate for the day, so prices can be compared across the border; on Mexico's own map they stay in pesos. Ontario's nodes are drawn without a colour on this view and take their colour, in Canadian dollars, on Ontario's own map.
Alberta and Ontario, as two different markets
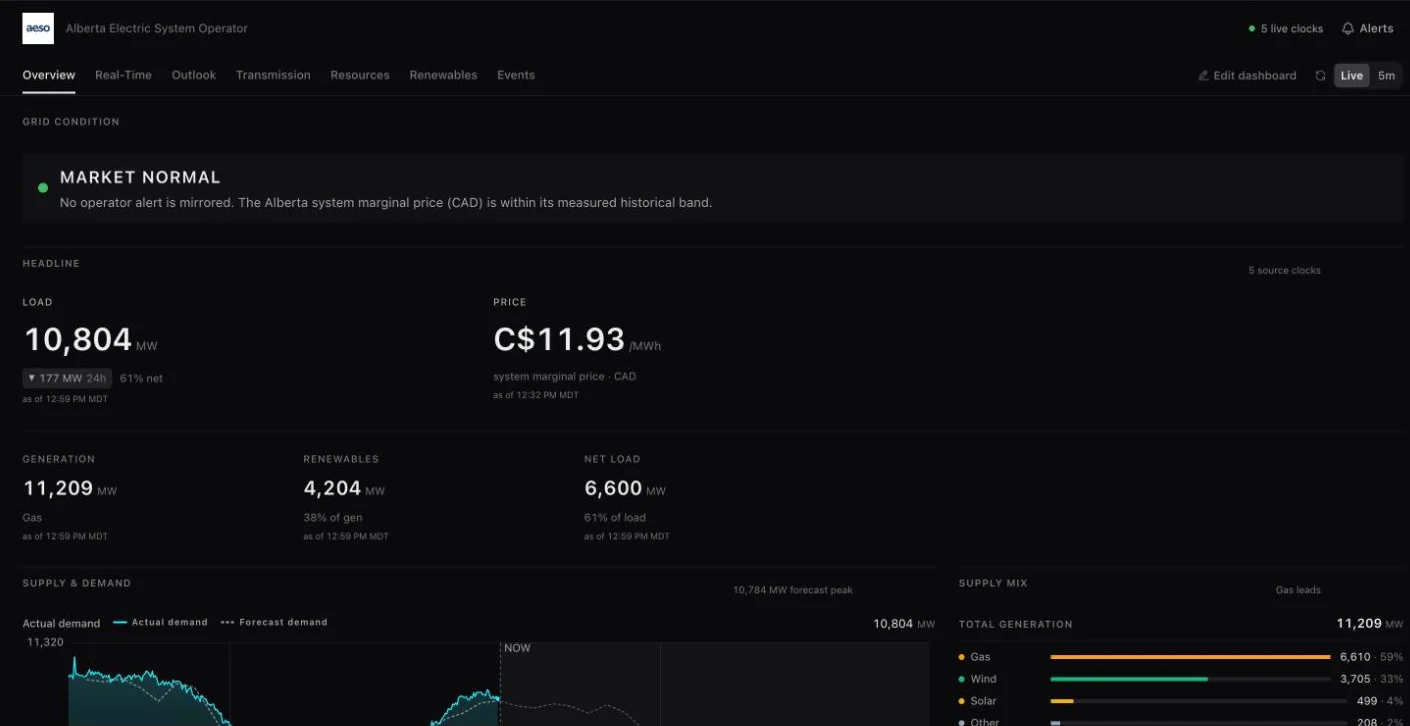
Alberta has one price for the whole province. Its Radar shows the system marginal price as it changes and the hourly pool price it settles at, load against AESO's forecast, supply by fuel and by unit, wind and solar against AESO's forecasts, and metered flow on the interties with British Columbia, Montana and Saskatchewan. Because there is a single price, Alberta's map has no price nodes.
Ontario's renewed market publishes locational prices, and its map places and colours more than a thousand pricing locations where IESO's own price map draws them. Radar shows the real-time and day-ahead Ontario zonal price, demand, hourly output by fuel, renewables against IESO's forecasts and five-minute intertie flow. Both markets have forecast pages: AESO's load, wind and solar forecasts, and IESO's wind and solar forecasts with the day-ahead price against real time.
Québec, read through water
Hydro-Québec is a balancing area on its own interconnection, joined to Ontario, New York, New England and New Brunswick through converters. Its Radar shows demand every fifteen minutes, generation by source every hour, exchanges with each neighbour, and the flow passing its generating stations. Demand is plotted against the 2019 to 2024 range so today can be placed against past years.
Each tie's reading arrives on its own lag, and generation is published two to three hours after the hour. Those clocks are shown with the readings instead of being smoothed into one timestamp.
Mexico, as one market over three systems
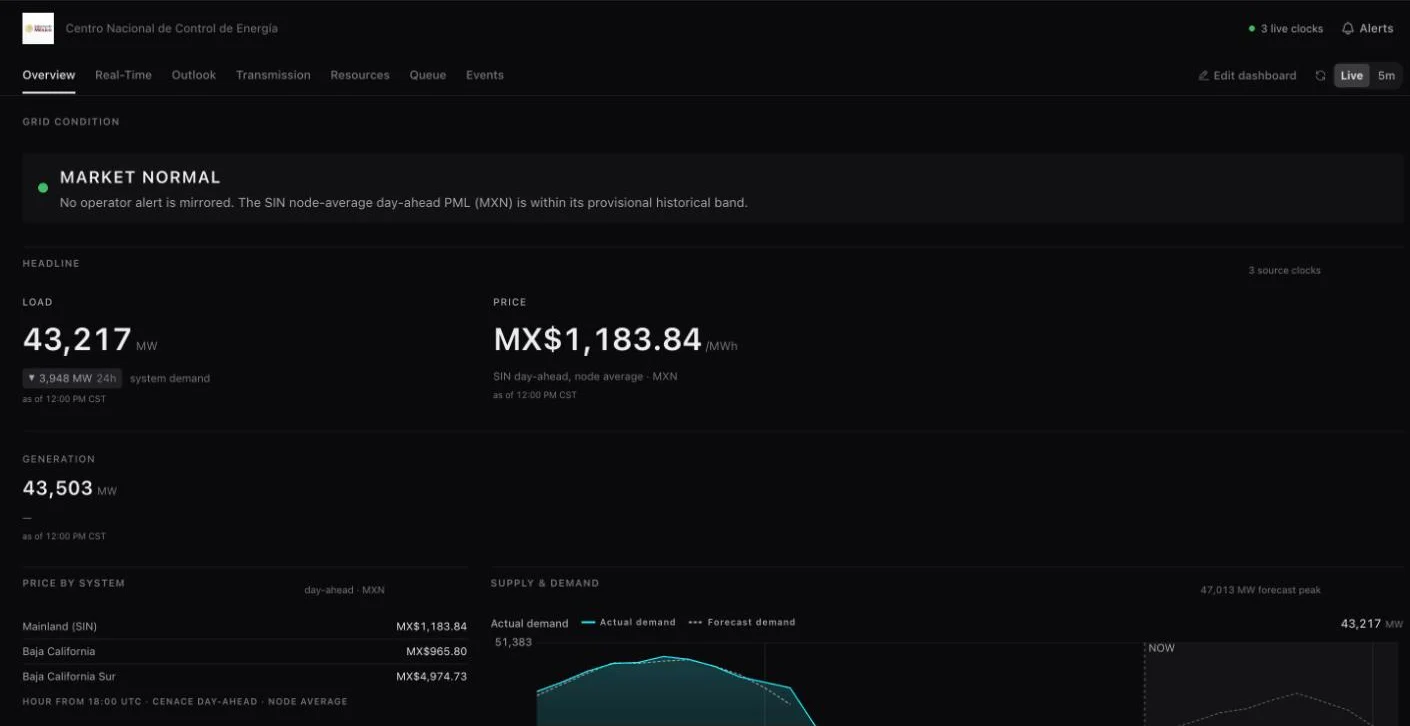
CENACE operates three electrical systems that are not synchronous with each other: the mainland, Baja California and Baja California Sur. Radar shows the day-ahead price for each, never combined, with national demand against CENACE's forecast, demand by control region and settled generation by fuel. The reference price is the average of the mainland's nodes for the hour in force, because CENACE publishes no system price, and it is labelled as that.
Mexico's map draws the national network from Sonora to the Yucatán peninsula. Baja California keeps its own workspace, because it runs on California's frequency and its prices sit across the seam from CAISO's. Real-time prices are published days after the hour, so the price in force on the map is the day-ahead one.