Open any chart in the chart studio
Any chart, Radar widget, agent chart or map card opens at full size, with a time rail that travels, the numbers behind every line, where each series comes from, and ways to take it with you.
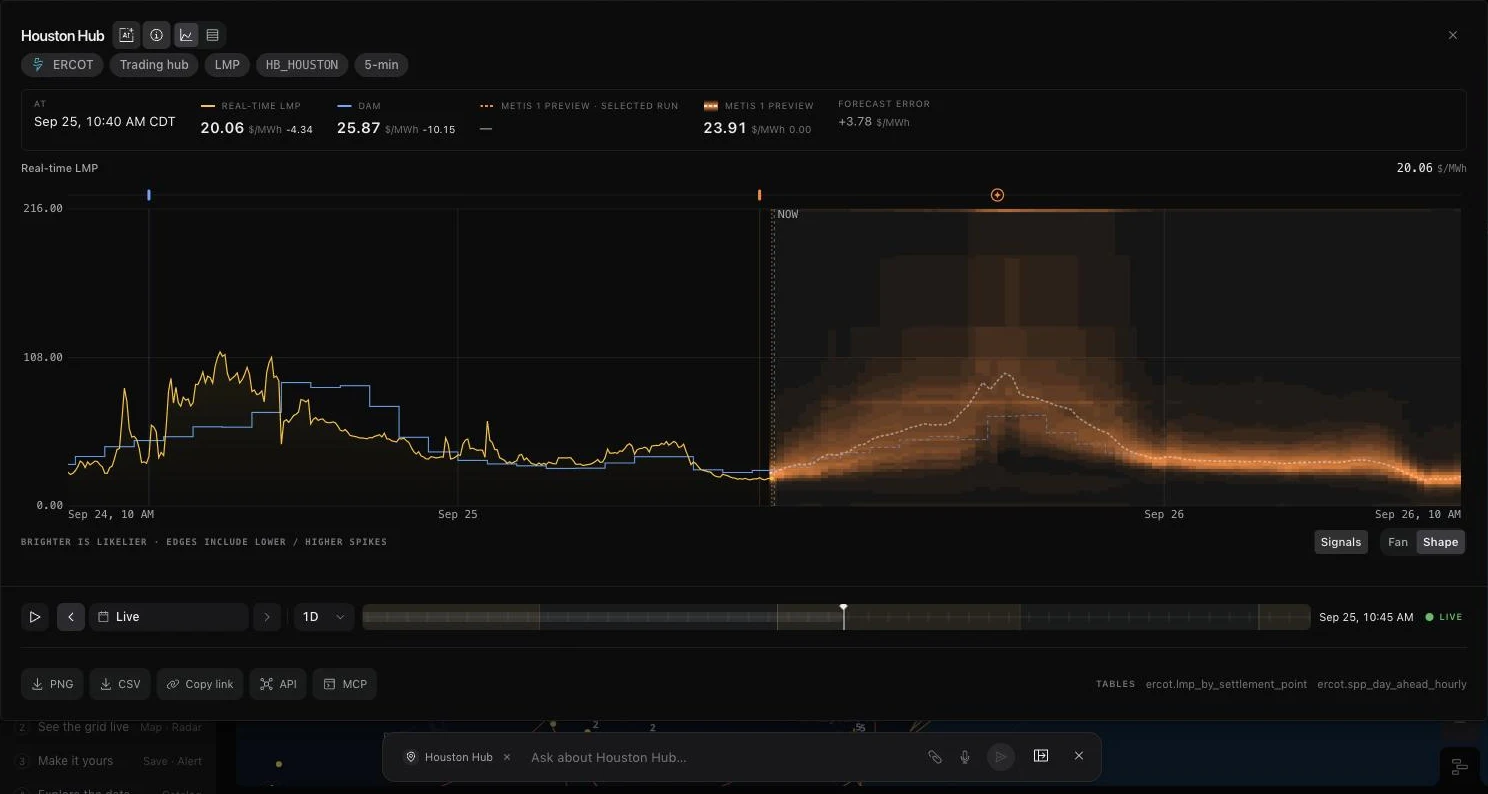
A chart on a card is a glance; the chart studio is where you read it. Any map info card, Radar widget, forecast chart, or chart in an agent answer opens as a near-full-screen panel. The same data is drawn at a size where the day-ahead steps, the real-time spikes, and the forecast distribution can be read against each other.
The studio is built for the next step after seeing something. Move through time on the map's own time rail, switch to the numbers behind every line, check where each series comes from, then take it with you as a PNG, a CSV, a link, or the same series over the API or MCP. The grid agent stays beside it with the chart as its subject.
Read the chart at size, at the instant you choose
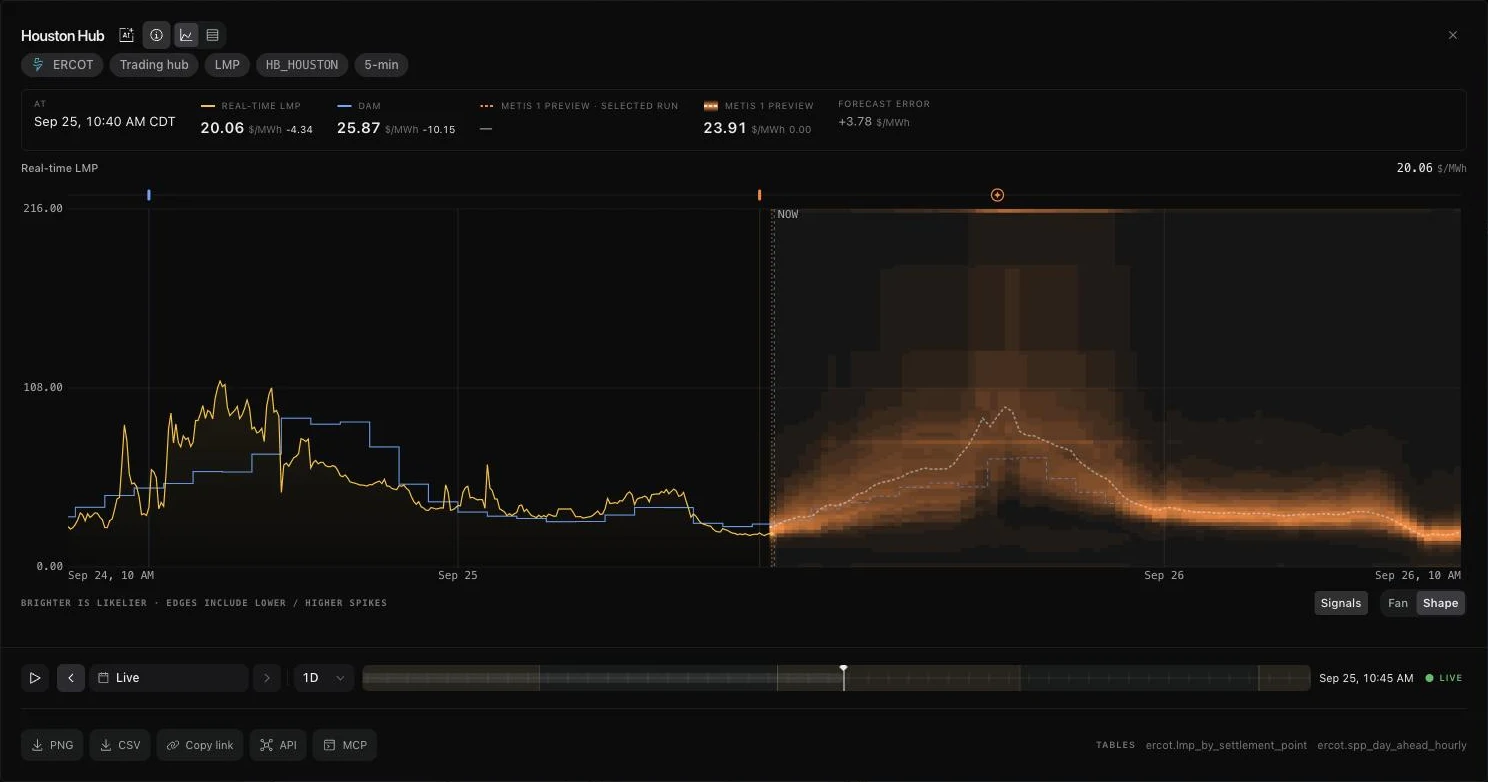
The header states what the data is: market, kind, location id, and cadence, with the market linked. The values box lists every drawn series at the cursor and reads the value in force at that instant, so an hourly day-ahead price holds for its hour rather than jumping to the next one. Day-ahead prices are drawn as hourly steps because a cleared price steps and does not ramp.
The time rail is the map's own: day boundaries, the daylight band, where forecast begins, and where now is. On price series, stepping back loads that day from the warehouse rather than only moving a cursor over what the card already had. Series with nothing settled to reach back for keep the cursor and offer no date picker.
The numbers, and where they come from
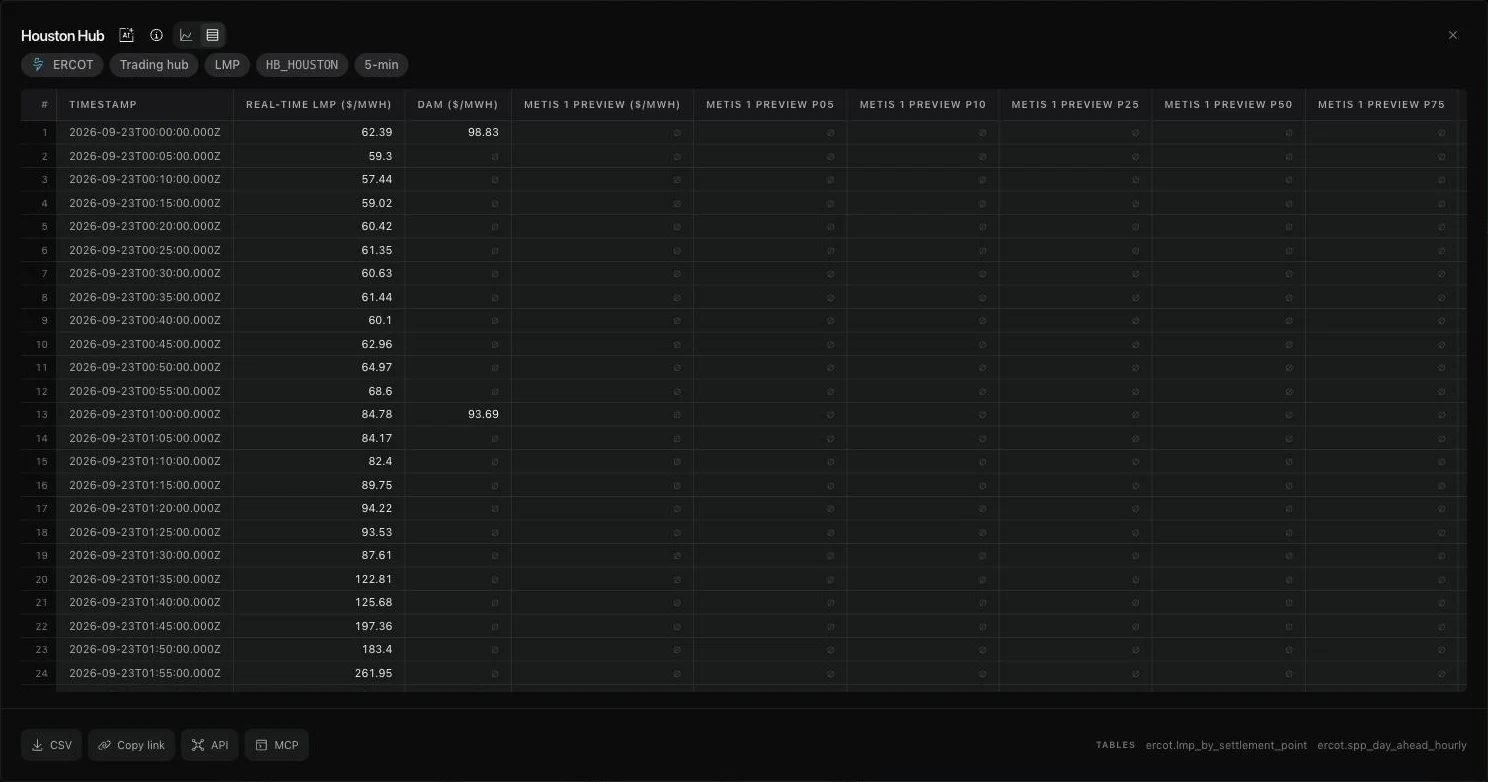
One toggle swaps the chart for a table of every series on the chart, row by row. The CSV comes from the same data, so it cannot disagree with the line on screen; series that do not share timestamps are aligned on the union of their times, and a missing sample stays empty rather than zero or carried forward.
Each series has an About panel naming its publisher and report, the warehouse table with a link to its catalog page, and its cadence. A forecast also names its model, the build that produced it, and the endpoint that served it. The footer lists the tables behind the chart.
Take it with you, or ask about it
Download the picture as a branded PNG or the numbers as CSV, copy a link that reopens the same chart, or copy the API or MCP call that returns the same series. Radar widgets deep-link to their expanded state, and tables and lists open the same way as charts.
The studio shares the screen with the grid agent instead of covering it. Ask a question and the composer carries the chart's subject, and the agent can name the tables the chart reads. Series colours are tuned for both themes, with the same hue for the same kind of series in each.