Measure the congestion between two points on the grid
Pick a site and the point it settles at, and read the lines that move the spread between them, what a bad day has cost, and what is filed against those lines.
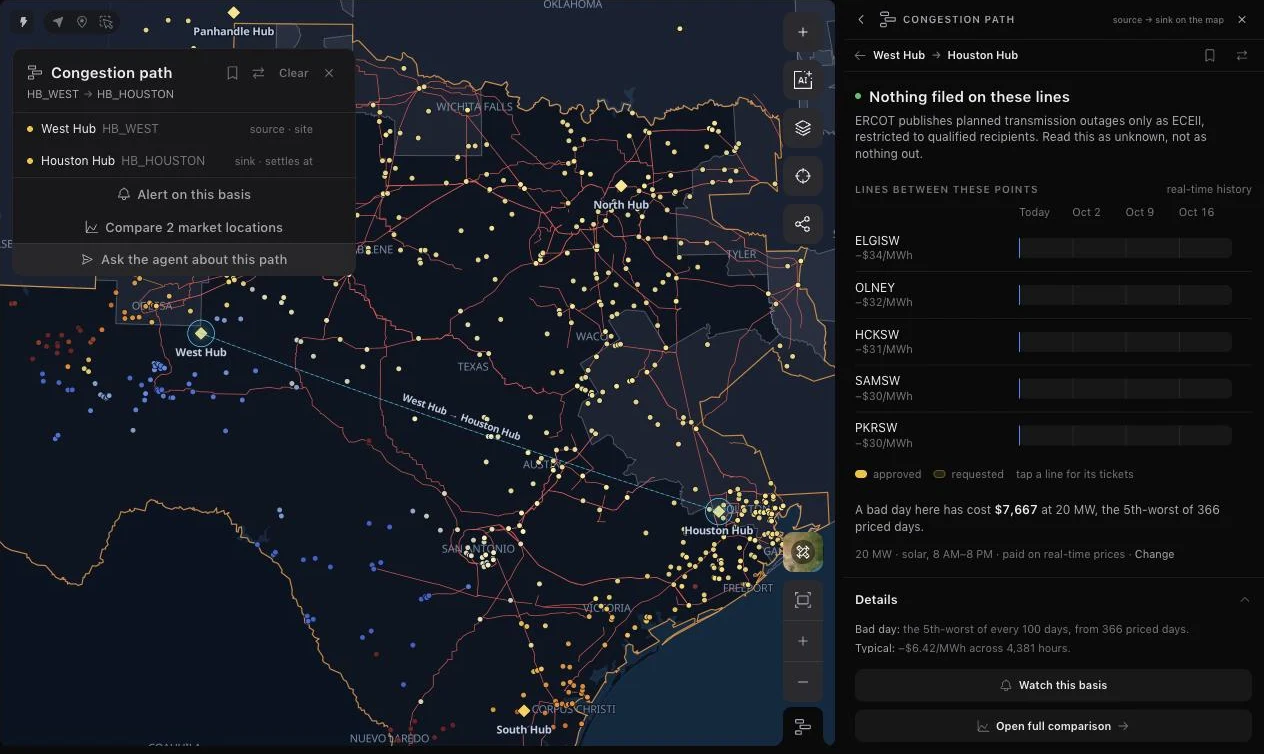
Choose the point where a project sits and the point where it settles, and Ask the Grid measures the path between them. Shift-click two settlement points on the map, or set the pair up by name from Compare, and the Congestion path tool opens beside them with a dashed chord drawn from source to sink. Direction is part of the question: West Hub to Houston Hub is a different path from Houston Hub to West Hub.
The reading answers the questions a desk asks before it hedges basis. Which lines move the spread between these two points, and by how much while they bind? What has a bad day cost at the size and shape of this position? Is anything filed against those lines in the coming weeks? Each answer carries its source, its pricing window, and the market's own limits on what it publishes.
Pick two points, keep the pair
The first point is the source, the site; the second is the sink, where it settles. The map card names both ends and offers the path's own actions: save it, reverse it, set an alert on its basis, compare the two locations, or ask the agent about this path. A saved path belongs in a collection like any other asset, reopens with both ends selected, and appears in each end's Also here list.
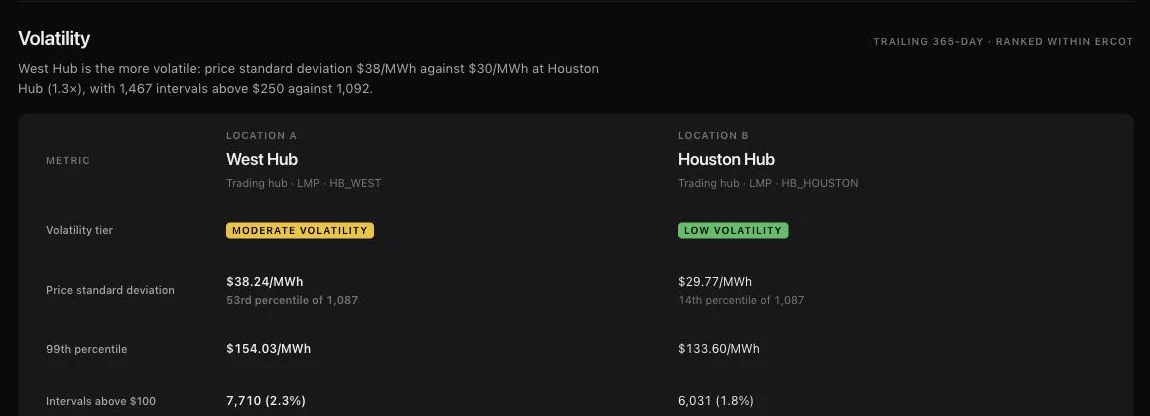
Compare starts the same reading without the map. Choose Congestion path, pick the market, and type each location by name; the comparison page carries the path's reading beside each location's price statistics. The Volatility section ranks both ends within their market by price standard deviation, 99th-percentile price, and intervals above $100, $250, and $1,000.
The lines that move the spread
Lines between these points lists the constraints most associated with the path's spread, each with the dollars per megawatt-hour the spread moved while it was binding, the uncertainty of that estimate, and the hours behind it. Constraints that name the same facility are collapsed into one line. It is an association measured on the market's own settled prices, not a network sensitivity, and the panel labels it that way.
The path is measured in the market it settles in, over a trailing year of priced days. A bad day is stated as money at a position you set: size in megawatts, a delivery profile such as solar hours, and the prices it is paid on. The typical basis sits beside it, so the tail and the ordinary day read together.
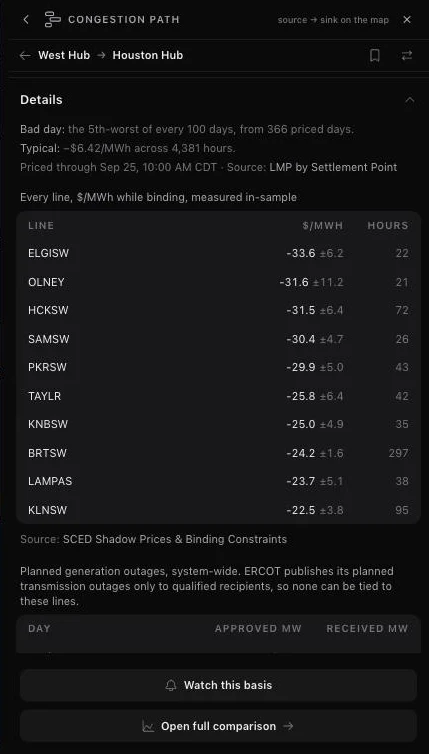
What is filed against those lines
Where a market publishes its planned transmission outages, the tool lays each line's approved and requested tickets over the coming weeks. PJM's outage schedule is read facility by facility. ERCOT publishes planned transmission outages only to qualified recipients, so the tool says that the schedule is unknown rather than reporting nothing out, and shows ERCOT's planned generation outage capacity instead.
Watch this basis turns the pair into an alert, and Open full comparison continues into the comparison page. In ERCOT, the agent can also answer which settlement points a binding constraint moves, from sensitivities estimated nightly out of five-minute prices and shadow prices.
Read the grid at one point with Here
Here answers the single-point version of the question. Open it from the map's tools or right-click and choose What's here, then click anywhere: the panel names the place, its market and load zone, the five nearest settlement points with their latest prices, the zone's demand against its forecast, the weather in that cell, the nearest plants and river gauges, and grid events and lightning within 25 km.
Every chart in the panel follows the map's time scrubber. Keep as pin turns the probe into a saved point. A location outside every zone or outside the weather grid says so instead of borrowing a neighbour's reading.