Alerts
Create value, event, asset, collection, and geographic monitors, then route them through reusable email, SMS, Slack, or Microsoft Teams destinations.
Open Alerts- Status
- Live
- Access
- Free account
- Reading time
- 17 minutes
- Updated
- Oct 14, 2026
Grid and collection alerts are personal. A project alert belongs to its project: viewers can read its condition and events, and editors can change, pause or archive it. Delivery destinations and delivery history stay private to its creator; teammates cannot send tests to someone else’s destinations. Removing project access also stops access to its alerts and queued notifications. Alerts watch a grid condition after you close the page. Start from a map selection, Radar widget, asset, saved collection, or the Alerts page, then review the target and condition before saving. Follow opens the shared alert wizard over the evidence you are reading, keeping the current page in place. Review its seeded target, choose delivery and save; Cancel returns to that evidence without creating a rule.
Rules are checked every minute and notify you when their state changes. Choose email, SMS, Slack, or Microsoft Teams for delivery. The Alerts page opens with firing conditions, your rules, and recent activity. The tabs above the list open All alerts, Activity, or Archived; restore a rule in Archived to resume monitoring. Use the filter bar to narrow by project, state, market, collection or name; on phones, Filters holds collection, market and sort choices. A collection’s own page links to the alerts on it, which opens this list narrowed to that collection; the Collection filter shows it, and the folder button beside it opens the collection in Saved. Every project alert carries a Project link, separate from its condition name, in rules, activity, archived rules and details. The Project filter stays visible on desktop and phones: choose a named project, All project alerts or Without a project. It applies across All alerts, Activity and Archived and stays selected when switching views or reloading. Clear project filter removes just that selection. Views and filters stay in the URL when you reload. Clear filters returns to all your alerts. Choose All activity for the full feed. Activity keeps the evidence and delivery status, including triggers recorded after a notification cap is reached.
On this page
Monitor report thresholds
Create an alert from a report
Eligible Radar series provide a threshold-alert action: MISO published operating margin, ERCOT regulation-up capability and SPP East wind redispatch curtailment. Choose a static threshold and review its scope before saving.
Check publication versus delivery time
Operating-margin alerts monitor the latest published next-peak forecast, with its target peak named in the evidence. Capability and curtailment alerts retain source observation time. Missing or incomplete reports follow the alert’s missing-data policy.
Create an alert
Start from the thing you want to monitor. Ask the Grid carries its context into the alert instead of asking you to rebuild it.
From the map
The map carries your selection into the alert draft. Use a node or asset for a specific target, a pin for events near a place, or a group or lasso for several locations.
- 1Open a live grid and select an asset, node, pin, or group.
- 2Choose Create alert on the card, or the pin or selection's alert action.
- 3Review the target in the Alerts tool, then save the rule.
With the Alerts tool already open, selecting something on the map offers to watch that selection.
From Radar
Open a widget's menu and choose Create alert for this signal. The grid and signal are carried into the draft, and the same Alerts tool opens beside the desk.
From a Radar finding
Open a finding's details and choose Follow this finding. The rule follows that one finding across its whole market: you are notified when it activates, when it escalates to critical, and when it resolves. In the editor, choose Follow all to follow every finding from the same detectors instead, and pick whether watch findings notify or only critical ones.
From the grid agent
Ask the agent to create an alert with a target and threshold. If either needs choosing, it proposes a rule for you to confirm. A live-grid answer can also include a suggested alert for a supported price, congestion, spread, or forecast signal. You can list, edit, pause, or archive rules in the same conversation.
- 1Ask for an alert directly, or ask why a supported price, congestion, day-ahead to real-time, or forecast signal moved.
- 2Review the proposed target, condition, and threshold below the answer.
- 3Create or confirm the rule, or dismiss the suggestion if it is not useful.
Suggestions are intentionally sparse: at most one appears in a conversation and two in seven days. Dismissing one suppresses the same rule permanently and related suggestions for that target for 30 days.
From an asset page
Use Create alert on an individual asset page when you want the rule tied to that facility or settlement point. Once the asset has a rule, the action reads Add alert.
From a Saved collection
Open a collection on Saved and choose Alert on assets. The rule re-reads the collection's membership on every evaluation, so assets you add later are included. A collection must contain 1–20 supported assets. An empty, deleted, oversized, or unsupported collection stops evaluation and shows a scope error; it never expands the alert to the whole grid. Value rules track one episode while any member matches. Alert on findings, beside the collection's Now row, follows Grid Radar findings and the collection's own settlement point prices instead, for up to 200 assets, and is told only when a finding reaches one of them through a specific tie; each notification names the assets and any priced effect.
From the Alerts page
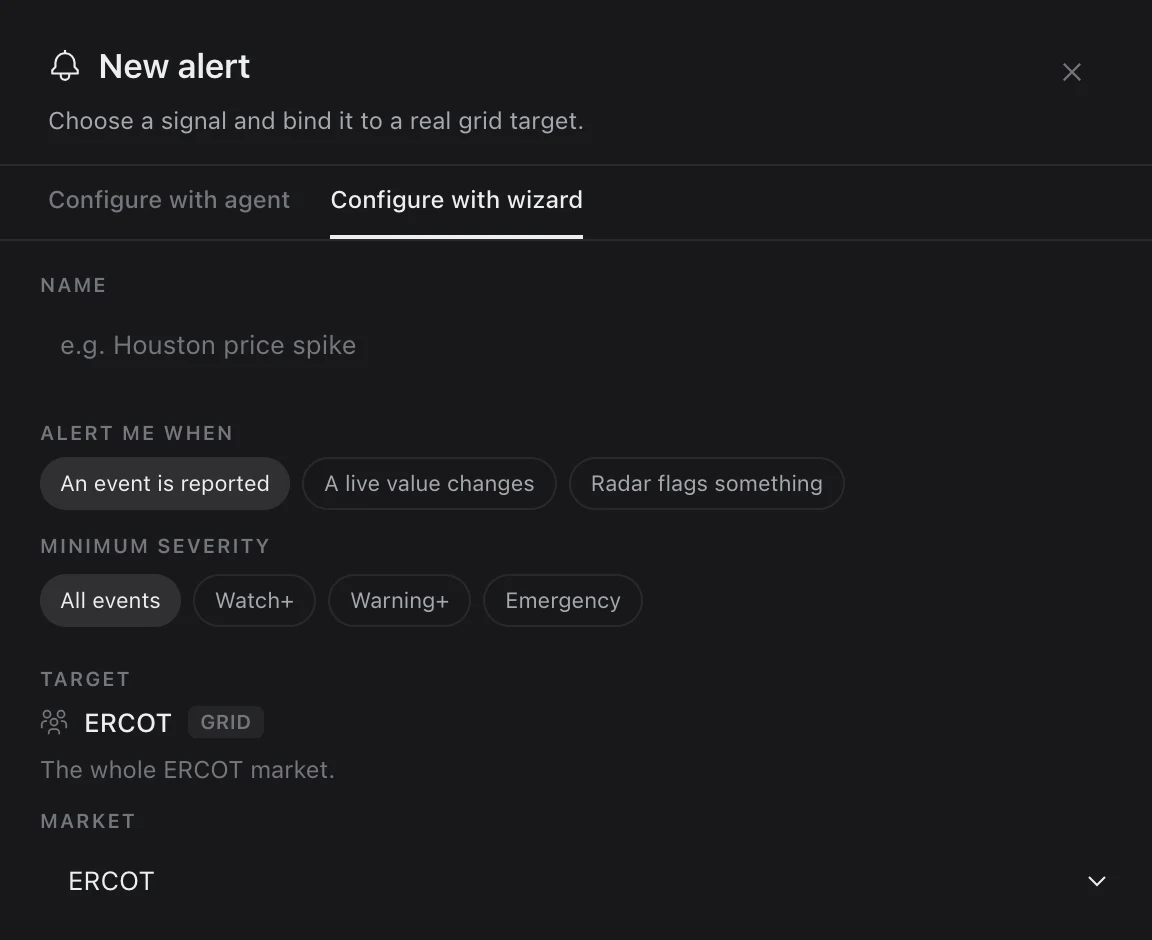
Choose New alert. Under Configure with agent, describe the condition in plain language or pick a suggestion; suggestions follow what is selected on the map and the current market. Configure with wizard picks the signal, target, and condition directly.
When a request cannot run as described, the agent says so or asks for more detail instead of saving an approximation.
From an MCP client
A connected AI client can list, inspect, create, pause, resume, update, and archive your alerts through Ask the Grid MCP. Changes require an explicit request and the separate alert-write OAuth permission. The client should compare unusual thresholds with recent data and ask for confirmation instead of creating a rule that is almost always or almost never true.
- 1Connect the global MCP server or the endpoint for one ISO.
- 2Reconnect and approve alert-write access if the connection predates MCP alert management.
- 3Explicitly ask the client to create, change, or archive the alert.
Per-second alerts are not supported. Alerts notify on evaluated state transitions, with confirmation, recovery, and delivery caps controlling noise.
Conditions and thresholds
Use a value alert when the job can be expressed as a metric crossing or departing from a meaningful reference.
Fixed limit
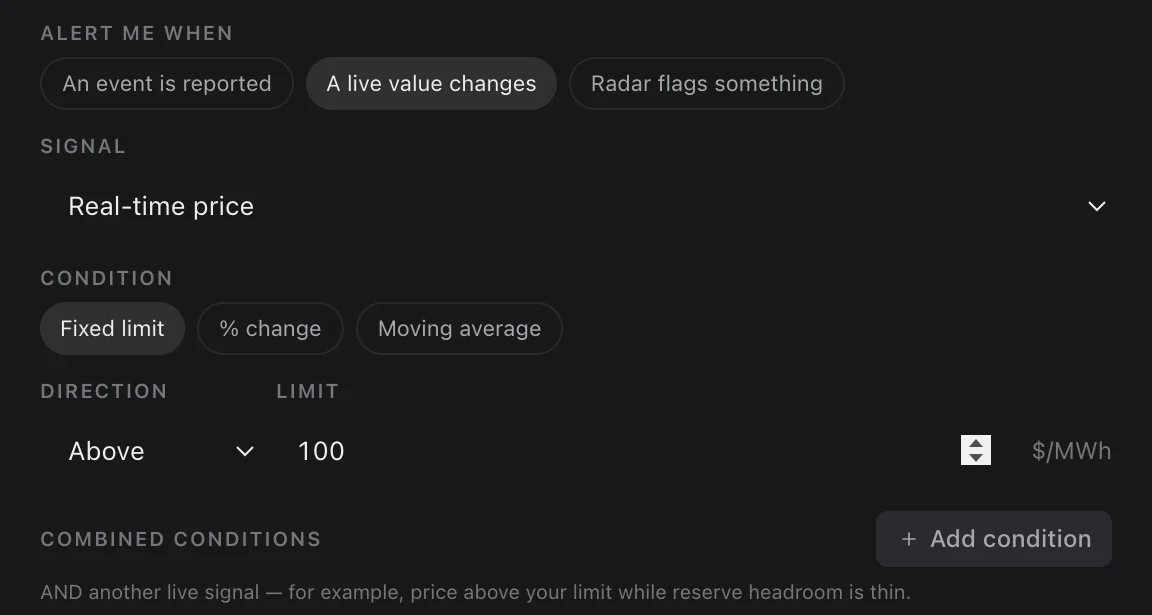
Trigger when a supported signal goes above or below a number—for example, nodal LMP above $100/MWh or ERCOT system load above 75,000 MW.
- 1Choose the signal, Fixed limit, and Above or Below.
- 2Enter the limit in the signal's displayed unit.
- 3Open Advanced to set how long the condition must hold before the rule activates.
Percent change
For signals with executable history, compare the latest value with the start of a lookback from 15 minutes to 24 hours. The editor offers this condition only for market, signal, and target combinations backed by historical evaluation.
Day-ahead versus real-time spread
DA/RT spread is the real-time price minus the day-ahead price at the same settlement point, in $/MWh, and covers ERCOT, CAISO, SPP, MISO, and ISO-NE. Above a positive number catches real time clearing over day-ahead; Below a negative number catches the reverse. A rule such as real time 20% above day-ahead is not supported; provide a dollar spread such as DA/RT above $50/MWh instead.
Forecast price (preview model)
Forecast price watches the newest Metis 1 Preview run at a settlement point in ERCOT, CAISO, and NYISO. Above compares your limit with the run's highest median over its next 24 hours; Below, with its lowest. Each model run is one reading, so only a fixed limit applies. It comes from a preview model, and the alert reports the model's forecast rather than an observed price. You can watch the locations your account is shown the forecast for: trading hubs and load zones on the free plan, every node on plans that include them.
Moving average
For signals with executable history, trigger when the latest value crosses its trailing average over the chosen lookback. No separate numeric threshold is required.
Combine conditions
Add up to three more conditions under Combined conditions. The rule activates only when every condition holds—for example, an ERCOT nodal price rule that also requires low reserve headroom. A system signal added this way evaluates for the whole market regardless of the rule's target.
Coverage by market
Nodal price alerts cover exact nodes in ERCOT, CAISO, PJM, SPP, MISO, and ISO-NE. ERCOT adds nodal congestion, hub-average grid price, system load, reserve headroom, reported outages, and load-versus-forecast divergence. ERCOT, CAISO, ISO-NE, MISO, NYISO, PJM, and SPP support two-location price spreads, on real-time or day-ahead prices: the first location minus the second, compared interval by interval. Search for both locations in the editor, swap their order with one click, describe the pair to the agent, or start from a congestion path's alert action, which keeps the path's settlement. Any priced location can be a leg, including interties the map does not draw. Set Confirm after to require the spread to hold, such as ten minutes, before you are notified. ERCOT, CAISO, and NYISO support forecast price from the preview model at settlement points. SPP supports system load and load-versus-forecast divergence. MISO supports system load, operating headroom calculated as committed capacity minus realized demand, load-versus-forecast divergence, published resource-adequacy surplus, and reported planned plus forced generation outages. ISO-NE supports system load, load-versus-forecast divergence, and the next-day report's resource-adequacy surplus and planned plus forced outage or reduction totals. Price, load, and headroom series support fixed, percent-change, and moving-average conditions. Forecast-divergence, forecast-price, adequacy, and outage metrics support fixed limits only.
Forecast-divergence alerts in SPP, MISO, and ISO-NE use the forecast publication available by the realized load observation's cutoff: SPP's mid-term load forecast, MISO's supply-demand forecast, or ISO-NE's hourly load forecast. They do not substitute a later forecast vintage.
Lookback and confirmation
Lookback sets the comparison window for percent-change and moving-average conditions. Under Advanced, Confirm after sets how long the condition must hold before the alert activates, from immediately to one hour. Use a longer hold for volatile signals to avoid reacting to a single interval.
Recovery
Mark recovered after, also under Advanced, sets how long a value must stay back on the normal side before an active alert recovers. Use it when a signal hovers around the limit; it prevents repeated activate and recover notifications at the boundary.
Event alerts
Use an event alert when the important change is a new occurrence, notice, or status—not a numeric crossing.
Grid events
Watch for operator notices, outages, reliability actions, and other supported operational events in ERCOT, NYISO, PJM, CAISO, MISO, SPP, and ISO-NE; the editor offers event rules only in those markets. Scope a rule to the whole grid, an asset, a selected set, or a map area, then choose a minimum severity: All events, Watch+, Warning+, or Emergency.
Utility events in CAISO
CAISO's events also carry PG&E's own reports: larger outages from its outage map, placed at the outage and in its county; Public Safety Power Shutoffs with their footprints; counties at watch or warning on PG&E's seven-day shutoff forecast; and Peak Day Pricing and SmartRate event days. They are distribution events from a utility, not operator actions, so an area rule drawn around a site catches an outage or shutoff there, while a whole-grid rule at Warning+ skips routine restorations.
Radar findings
A Radar flags something rule follows Grid Radar's findings for a whole market rather than evaluating a condition of its own. Leave the detector list empty to follow every finding, or narrow it to the ones you act on. Radar evaluates every market it covers each minute, so the rule's replay counts recorded activations rather than re-running history. Forecast findings from Metis 1 Preview notify you only at the locations your account is shown the model.
Asset-scoped events
When an event source identifies a supported node, resource, line, zone, or DC tie, an asset rule can watch that exact subject. The notification identifies the subject and new event evidence rather than reporting only a grid-wide occurrence.
Geographic alerts
Geographic scopes turn a location or collection on the map into something that can be monitored over time.
Pin and radius
Drop a pin and choose Alert on events within 25 km. The rule watches supported grid events inside that radius, frozen when you create it, and its target reads as 25 km around the pin so the monitored footprint is clear.
Multi-select
Select several nodes and choose Alert on any selected node to monitor them as a fixed set; the rule activates when any member meets the condition. This suits a portfolio, corridor, development screen, or operating footprint that does not form one simple radius. A set holds up to 20 members.
Lasso selection
Lasso an area and choose Alert on events in this area to save a frozen polygon for event alerts. Events with spatial evidence inside that boundary can match later; value alerts still require concrete supported node or grid series and are not aggregated across arbitrary geometry.
Delivery and limits
Choose where alerts arrive
Account email is ready automatically. Add and verify SMS in Settings → Notifications. Slack and Microsoft Teams channels come from Settings → Connections: in your personal workspace you add your own, and in a team workspace its administrators add them for every member. Choose destinations under Notify on each rule. SMS supports US phone numbers. Unsubscribe from all emails pauses alert email while the other channels keep delivering; use Resume alert emails to turn it back on.
- 1For SMS, open Settings → Notifications, choose Add destination, and enter a US phone number in E.164 format, such as +12125551212.
- 2Verify the phone with Send verification code and the code it receives.
- 3For Slack or Teams, open Settings → Connections → Deliver to. Connect Slack and add a channel the app was invited to, or add a Teams Workflow or Slack incoming webhook URL, then choose Send test.
- 4Select the destination under Notify when creating or editing a rule.
Make default, in a destination's menu, only preselects it when a new alert opens. It never rewrites the destinations already selected on existing rules.
Team Slack and Teams channels
A channel added in a team workspace belongs to that organization. Every member can send alerts, report summaries and shares to it, and only administrators can connect Slack, add or test channels, or remove them. Leaving the organization stops your alerts from posting to its channels, and removing a channel stops it for everyone. Slack and Teams alerts include what happened, the observed value, why it matters and what to check, with buttons to open the alert and explore the grid.
Control notification volume
Value rules are episode-based: a rule evaluated every minute notifies when its state changes, not on every matching check. Each rule also has a rolling 24-hour cap for each selected destination, covering repeated episodes or bursts of distinct grid events. New rules start at 1 per destination; a free account can raise it to 10, and Enterprise lifts that ceiling. The cap includes activation and recovery messages: an activation can use the final allowance and suppress its recovery notification. Suppressed notifications remain in Activity and are not sent later when the allowance returns. Each destination in Settings → Notifications can also deliver every alert as it fires or collect them into an hourly or daily digest, while still sending emergencies, or another severity you choose, right away. Activity refreshes every 30 seconds while the page is visible.
- 1Open Advanced in the rule editor and choose Daily cap / destination.
- 2Use a lower cap for noisy exploratory rules and a higher one for critical event streams.
- 3Review capped triggers on the Activity tab of Alerts.
Webhook credentials stay private
Phone numbers, Slack incoming webhooks, and Microsoft Teams workflow webhooks are validated and encrypted when you save the destination. Read APIs return its name, safe target hint, health, and usage count—not the number or webhook. Rotating the target updates future occurrences for every linked rule; deliveries already queued keep their original encrypted snapshot.
- 1Create an incoming webhook in the Slack or Teams channel you control.
- 2Paste it into a named destination and save it.
- 3Open Settings → Connections, choose Manage for Slack or Microsoft Teams, and send a test to confirm the channel.
Reuse and archive destinations safely
One saved destination can serve many alerts, including several destinations of the same channel. Settings → Notifications shows how many alerts use each one; choose that count to see them. Archive destination is in each destination's menu. A destination in use cannot be archived; change those alerts first so disconnecting a service never silently changes delivery. The built-in account-email destination follows your current account address and cannot be archived.
Automate through the developer API
The developer console’s Alerts page documents rule and destination APIs with request examples. Create reusable destinations, select their IDs on rules, test delivery, and rotate credentials. SMS destinations require consent and phone verification; submitted verification codes are not stored.
Why sign-in is required
Anonymous visitors can inspect the public grid, but persistent alert state, delivery destinations, and evidence history belong to an account. Alerts are enabled by default on every free account, with no separate opt-in. The signup gate shows the feature in context and returns you to the alert draft after authentication.
Manage and troubleshoot
Use All alerts, Activity and Archived
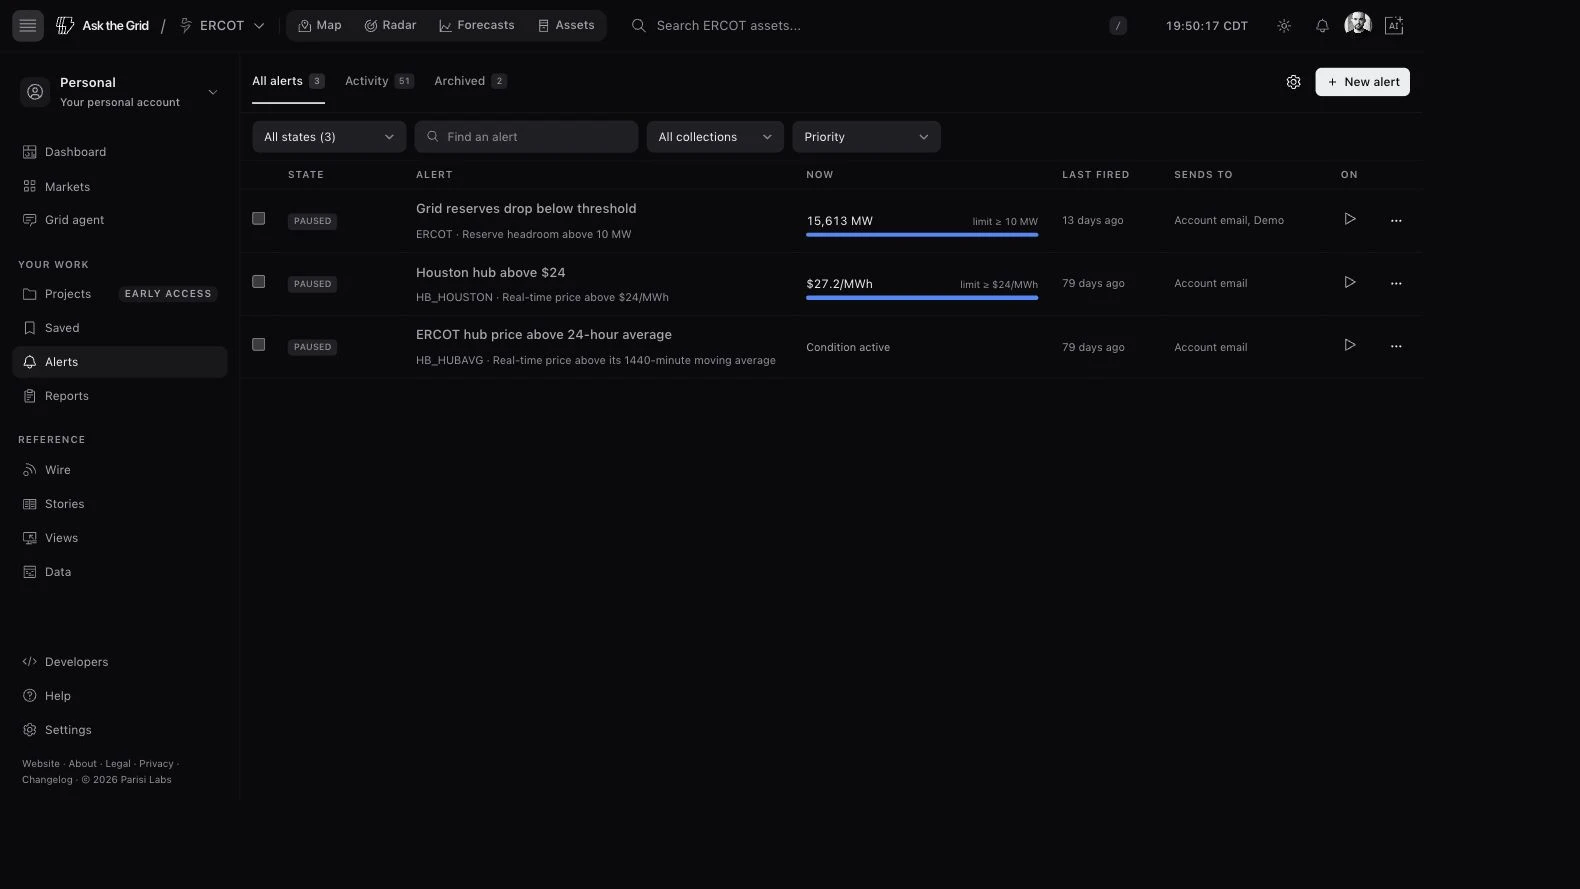
All alerts lists your rules with their state, current reading, last firing and delivery destinations. Search by condition or project name and use the project, state, collection, market and sort controls to narrow the list. Open a rule to inspect it, use its switch to pause or resume, or select several rules for bulk actions. Activity shows notifications: filter All, Unviewed or Viewed, or choose Mark all viewed. Archived holds stopped rules you can restore. New alert opens the builder; Notification destinations opens Settings → Notifications. Slack and Teams channels are managed in Settings → Connections.
Understand rule health
Healthy means the evaluator can read the source and run the condition. Degraded and Error describe source or evaluation trouble separately from whether the monitored condition is active. Initializing means the rule has not reported health yet.
Read evidence history
Activity combines transitions across every rule into one chronological feed. Open a rule for its focused evidence history. Both views retain observed time, source, value when available, and delivery status—including triggers recorded after a delivery cap was reached.
See alerts on the map and Radar
On a map or Radar, the Alerts tool in the rail lists the rules you own, ranked by urgency, with rules watching your current selection first. Radar → Events also includes an Ask the Grid alerts widget filtered to the current ISO beside the operator event stream, so you can compare what the grid reported with which personal rules actually triggered.
Pause, clone, or archive
Pause stops evaluation without deleting the rule, and Resume starts it again. Clone paused creates a paused copy for safe editing. Archive stops evaluation and moves the rule to the Archived view, where Restore starts it watching again; its evidence history is retained.
Missing data
Under Advanced, If source data is missing chooses between Keep last state and Mark unavailable. Missing data is not automatically normal and does not silently resolve an active condition.
If a rule is degraded, inspect its source timestamp and health message before changing the threshold.
Did this guide get you unstuck?
One click is enough. No message or account required.