Grid findings become evidence you can follow
Inspect what triggered a finding, distinguish recorded episodes from historical replay, and follow its activation, escalation, and resolution through Alerts.
A finding can now carry an investigation beyond the current dashboard. Open it from Today or Radar to inspect the comparison, source clocks, market scope, and calculation that made it material. Follow that same finding into Alerts, or use the Insights API to examine its recorded history and evaluate detectors over available historical inputs.
The workflow connects a current condition to evidence and subsequent change. Operator notices retain the operator’s terminology and affected region; calculated findings identify the inputs and reference they compared. An observed value, a forecast target, the time of detection, and the time a source published its evidence remain distinct.
See what was compared
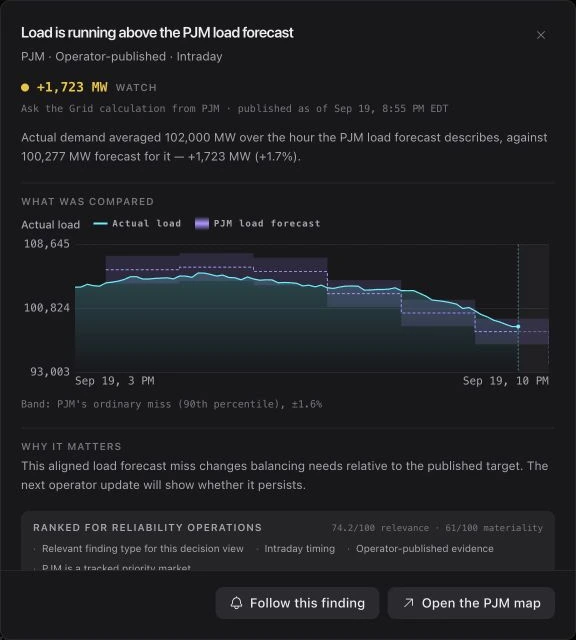
Open a calculated finding to read its evidence chart beside the headline. A load-forecast miss, for example, compares actual demand with the forecast for the corresponding target interval and shows the market’s reference band. The explanation names the difference and the reason it matters.
The evidence record continues into semantics, scope, status, sources, and the evaluated snapshot. It identifies the calculation and its assumptions, including whether the source exposes an issue time. This gives a reader a concrete route from an alerting headline back to the underlying comparison.
Read the operator’s condition in its own terms
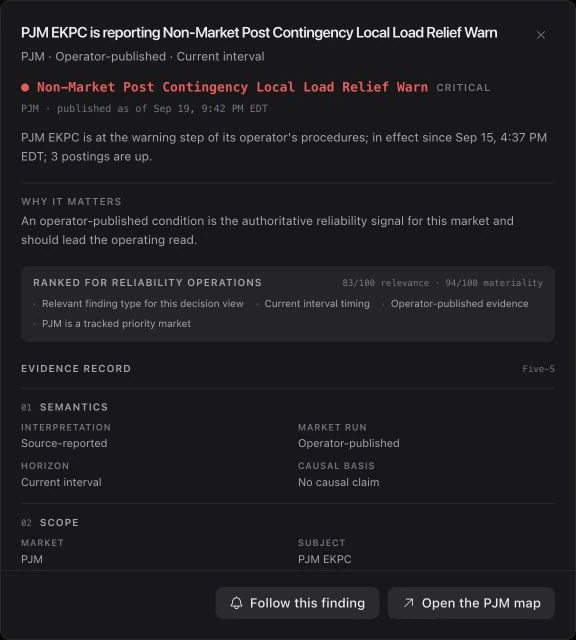
Operator conditions follow each market’s published procedure ladder. Regional notices preserve their affected area, in-effect time, and source wording. A PJM EKPC warning remains an EKPC condition when it appears beside findings from other grids.
Materiality and relevance help order the operating read, while the detail distinguishes an operator publication from an Ask the Grid calculation. The map handoff keeps the market attached so you can continue the investigation in the appropriate grid.
Follow the condition through its next change
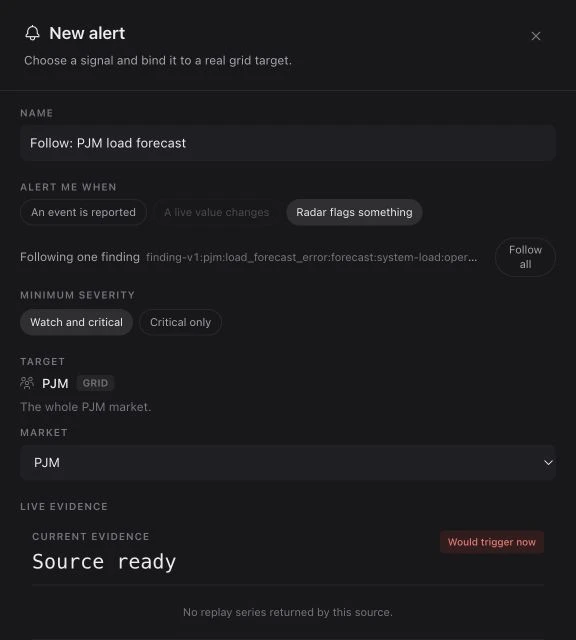
Follow this finding opens a prefilled alert with the finding’s identity, market, and trigger. Choose the minimum severity and saved delivery destinations, then review the rule before creating it. The rule follows activation, escalation, and resolution.
Evaluation runs every minute, with notifications based on transitions. Email, SMS, Slack, and Microsoft Teams destinations are managed in Alerts. The capture shows the handoff and live evidence; the rule is created only when you finish the editor.
Separate recorded history from replay
The Insights API offers two historical questions. Recorded history describes the episodes the system retained as it operated. Replay evaluates the current detectors over historical data available at each evaluation time, within the source history the system can retrieve.
Use recorded episodes to inspect the findings that actually persisted, and replay to investigate how today’s detector definitions behave over an earlier interval. Their mode, source coverage, and evaluation times are part of the result.