Today & the Energy Wire
Begin with ranked live-grid conditions, then follow the supporting Radar desk, reporting, and original source.
Open Today- Status
- Live
- Access
- Energy Wire first page public · Free account for Today and the full Wire
- Reading time
- 6 minutes
- Updated
- Oct 12, 2026
Today is the signed-in operating front door to Ask the Grid, opened from Dashboard in the left navigation. It ranks material conditions across the markets you track and keeps a live market map beside them, so the first question each day is not which dashboard to open but which observed condition deserves attention.
The Energy Wire covers a different evidence layer: reporting, filings, operator posts, and market news. Each story retains its publisher and canonical source URL. Used together, Today and the Wire separate observed grid signals from reported developments while making it easy to move from either one into a market-scoped investigation.
On this page
Start from an organization default or your own Today view
Use your organization's starting view
Owners and administrators configure Today in the Today tab of the organization's settings. Turn the organization's Today on, or off so members simply see their personal Today; describe its focus, select a workflow and market coverage, connect shared watchlist collections, and provide briefing instructions. The map, watched findings, and shared briefing follow the selected assets. Conversations in this organization also receive the shared focus, watched assets, and pinned shared collections with their notes and custom fields. The agent uses the organization default for this context; a member’s personal Today override does not change the team’s conversation context. This can support asset operations or a congestion desk's focus across its markets.
Customize without changing the team's settings
Choose Tailor on Today, then Save my view to keep a personal override in this organization. Use organization default removes that override and returns you to the team's current configuration. Switching workspaces keeps each organization's settings separate.
Start with Today
Use the ranked findings to decide where to look, then open the exact market surface carrying the evidence.
Read findings as observations
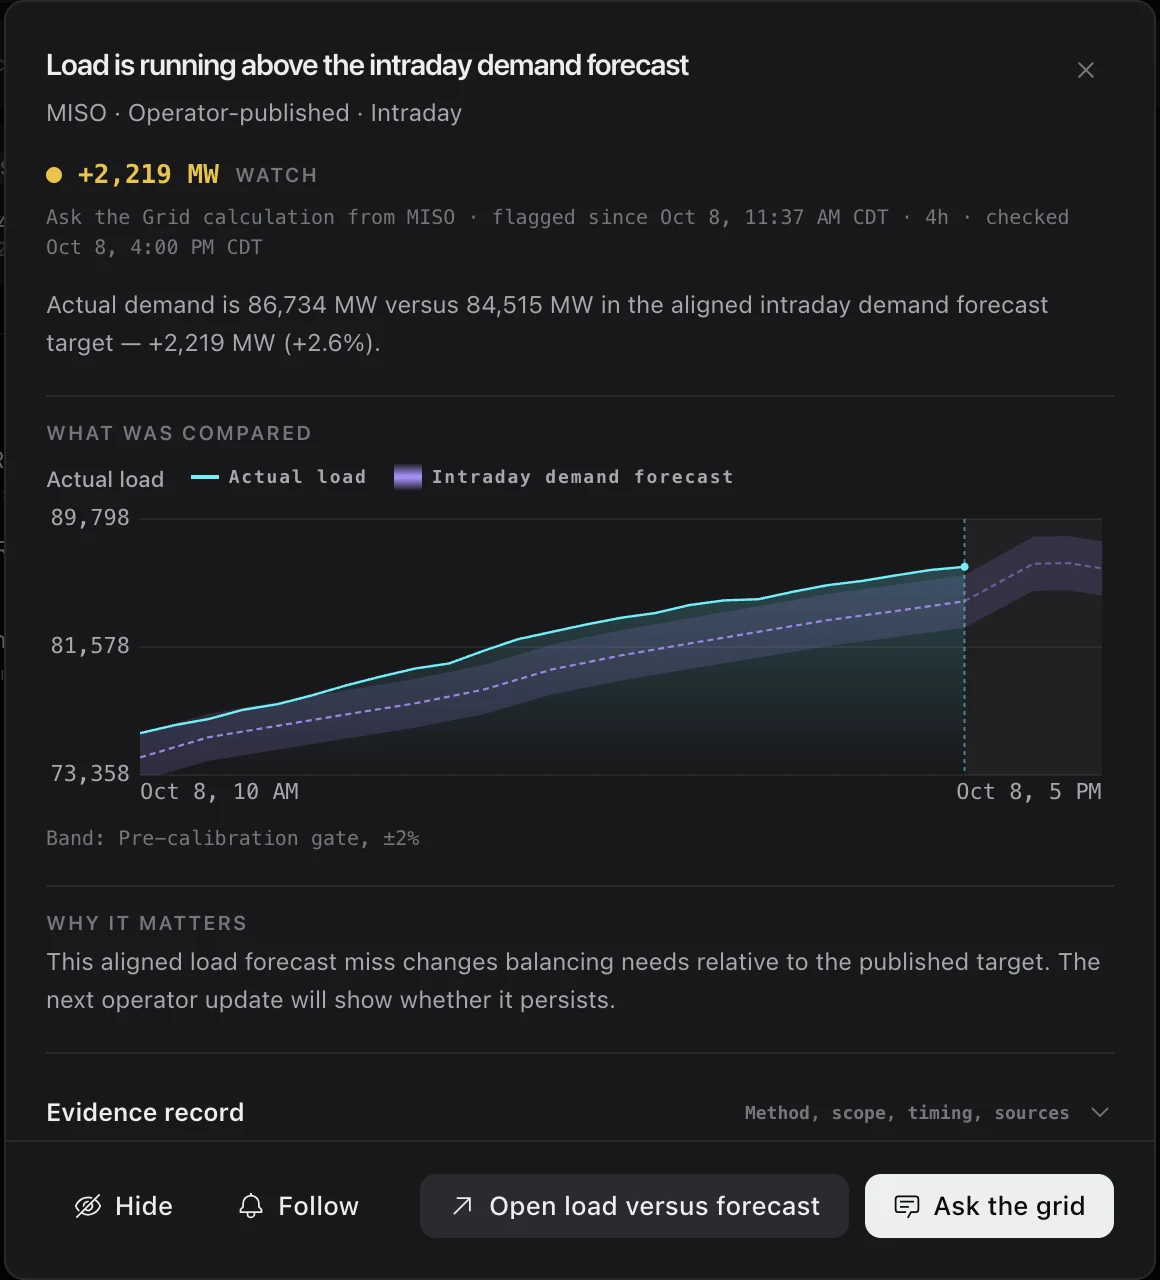
A finding names its market, observed condition, source, evidence state, and observation time. Binding constraints, price separation, local congestion, scarcity pressure, forecast misses, operating headroom, frequency, and operator conditions remain distinct signals rather than being flattened into one severity score.
- 1Scan the Findings list, or choose View all for every finding ranked across your tracked markets. Selecting a finding also points the map at its market.
- 2Select a finding to check its market, source, evidence state, and observation time.
- 3Open What was compared to see the evaluated series beside the forecast, historical band, or price threshold used to judge it.
- 4For constraints, check duration, binding days in the last 30 days, hub or zone spreads, and any shift-factor estimate. An unheld constraint becomes critical only after an unusually long episode plus infrequent binding or a price effect between hubs; its severity does not describe the whole grid.
- 5Use its Open action to inspect the underlying Radar desk, Follow this finding to be told when it activates or resolves, or Create an alert where the finding supports a threshold rule.
Read a forecast finding
Forecast findings look ahead using the newest Metis 1 Preview run. They flag a median crossing of the market's extreme or negative real-time price threshold, after observed prices have stayed on the near side for a quiet window: usually a day, or two hours for CAISO price spikes. Broad calls covering much of a market are suppressed. Hubs and load zones are grouped separately; licensed nodes have individual findings so an organization’s node grants determine which forecasts its members can see.
- 1Check the lead location, when its median first crosses the line, and its 10th–90th percentile range at the peak. Public hubs called by the same run can be grouped; each licensed node retains its own evidence and follow action.
- 2Check the Preview-model forecast label and named run. What was compared plots its median ahead of observed prices. Forecast findings are always watch and rank after observed conditions.
- 3Open the lead location on the map, or Follow this finding to be told when the next run calls one.
Read the page from the top
The map and briefing summarize the scope you choose: one market, your tracked markets, or the national grid. Below them, explore findings, grid events, saved assets, alerts, and the activity feed.
- 1Use the control at the top of the map to choose your scope or change the markets you track.
- 2Read the briefing and follow its linked assets, findings, events, or stories. It uses the evidence and sources selected in Briefing settings and refreshes hourly by default, including while Today is open.
- 3Select a map feature to inspect its card. Use the dock to change layers, or Open map to continue in the full workspace with the same view and selection.
- 4The Price number and its three-hour line use the same named market benchmark. Hover or press the line to inspect an actual price and its timestamp; keyboard focus and arrow keys do the same. Its caption identifies real-time or day-ahead prices. Canadian benchmarks retain CAD, and SIN retains MXN. Gaps remain visible, and a missing history does not get replaced with another hub.
- 5Browse the row below the map for current findings, events, and suggested questions. Continue to your saved assets, alerts, and the activity feed; filter that feed by kind.
- 6Open Radar for the market's full operating desk, or choose Ask the agent to attach the briefing to the composer without sending a question.
Tune and copy your briefing
Use the controls at the upper right of the briefing card to copy the note or open Briefing settings. Choose its length, emphasis, sources, and refresh interval; saving refreshes the note. These settings do not change the grid agent's answers. Organization defaults can pin a shared collection and watched benchmarks. Every watched node is considered before selecting the fleet evidence for the note, and each member’s generated note remains within their current access. A personal override stays personal.
- 1Choose Quick take, Desk note, or Detailed review, then select the market, event, news, and personal context sources to include.
- 2Choose hourly or every 12 hours on Free. Enterprise also offers every visit, every 5 minutes, and every 15 minutes.
- 3Check when the note was written and each observation's own time and market timezone. Forecast peaks have a separate delivery time.
A nearby event does not establish an effect on a saved asset. If a named constraint changes before the next refresh, the card flags it; check the live market card for the current reading.
Know what silence means
Quiet, stale, unavailable, and unsupported signals have different meanings. A market with no ranked finding is not automatically normal, and a missing feed is not rewritten as a zero or a healthy condition.
Choose your markets
Track the markets you operate in
Choose which markets Today tracks from the market's menu, on the control at the top of the map. Guided setup starts Today on the markets you chose, and later changes are remembered in this browser. Pick a market from the same menu to focus it, choose your tracked markets together, or choose National for the whole country. Today remembers your focused market, map coverage, view, and layer toggles in this browser when you return.
Read the Energy Wire
Use the Wire when the question begins with a reported development rather than a live market measurement.
Keep the publisher attached
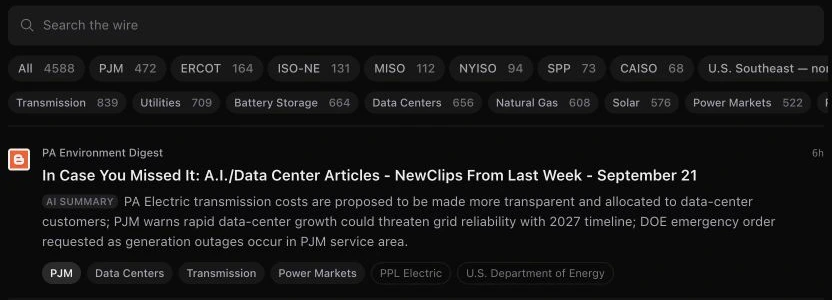
Each Wire item names its publisher and links to the canonical article, filing, or newsroom post. The line under a headline is an AI summary written from the source, so the original publisher remains the source to cite. Search the Wire, filter by market or sector, or choose Ask on a story to question the agent about it. Anyone can read the first page of stories; a free account continues past it and keeps your place.
Use the Briefing Desk
Hourly and four-a-day briefings summarize a closed evidence window and state their knowledge cutoff. Open the cited stories when a claim matters, then continue in the active market with the same source boundary.
Stay inside one market
Use permanent market routes
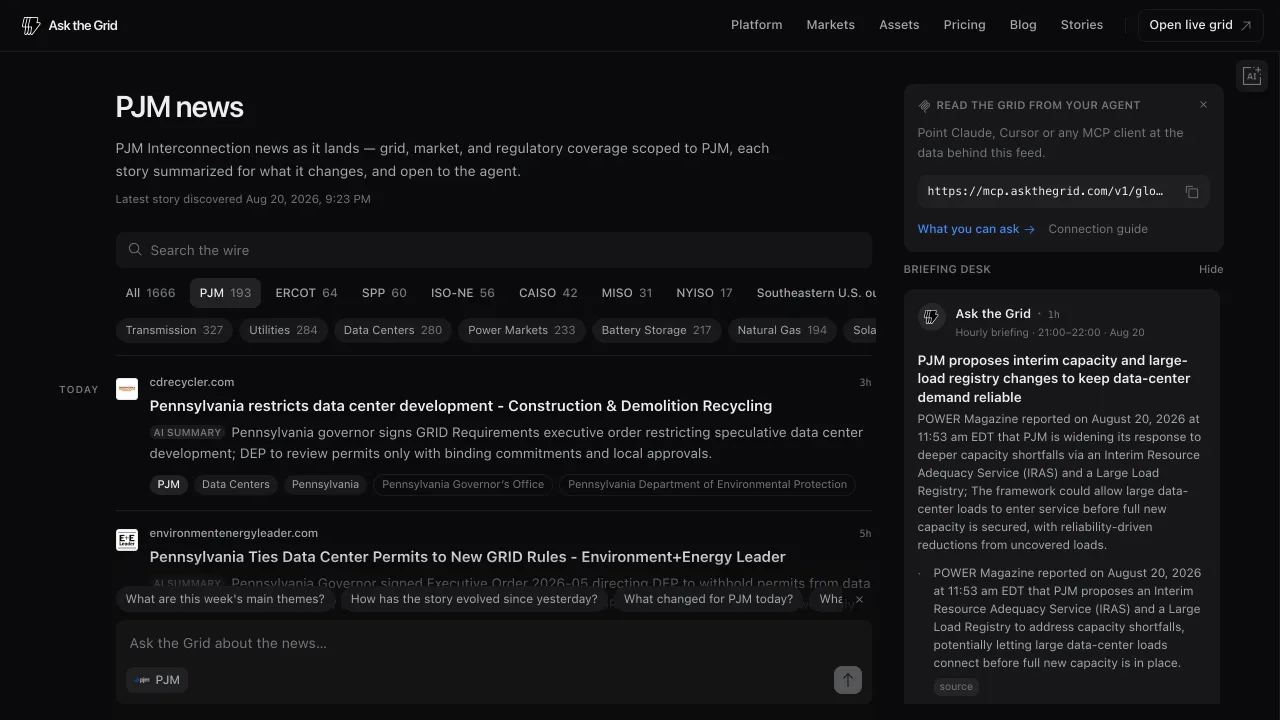
Open a market-specific route such as /wire/pjm when the investigation belongs to one operator. Its story list and agent context stay scoped to that market, and its address can be bookmarked or shared. Choosing a market filter on /wire narrows the list without changing that address.
Move from reporting to grid evidence
A Wire story can establish that an operator, company, regulator, or publisher reported a development. Use the agent, the catalog, or the market's Map and Radar to test the grid measurements around it without turning the reported claim into an observed one.
Did this guide get you unstuck?
One click is enough. No message or account required.