Metis adds hourly forecasts for load, renewables and grid conditions
The Forecast API adds hourly outlooks for demand, generation, imports and other grid conditions, with quantiles for each forecast interval.
Metis 1 Preview · October 2026 brings ten hourly outputs to the Forecast API. Use them to see how demand, wind and solar generation, available capacity, net imports, and system prices could change over the next 48 hours.
Coverage varies by output and market. The forecast playground shows the available combinations and how each is measured, so you can try a system total or a regional series before adding it to your code.
Choose the output and location
In ERCOT, for example, choose the whole system's wind generation or select a region such as the Panhandle. For load, choose a weather zone such as North Central. Each output uses its source's own regions. The model card lists which markets publish each output.
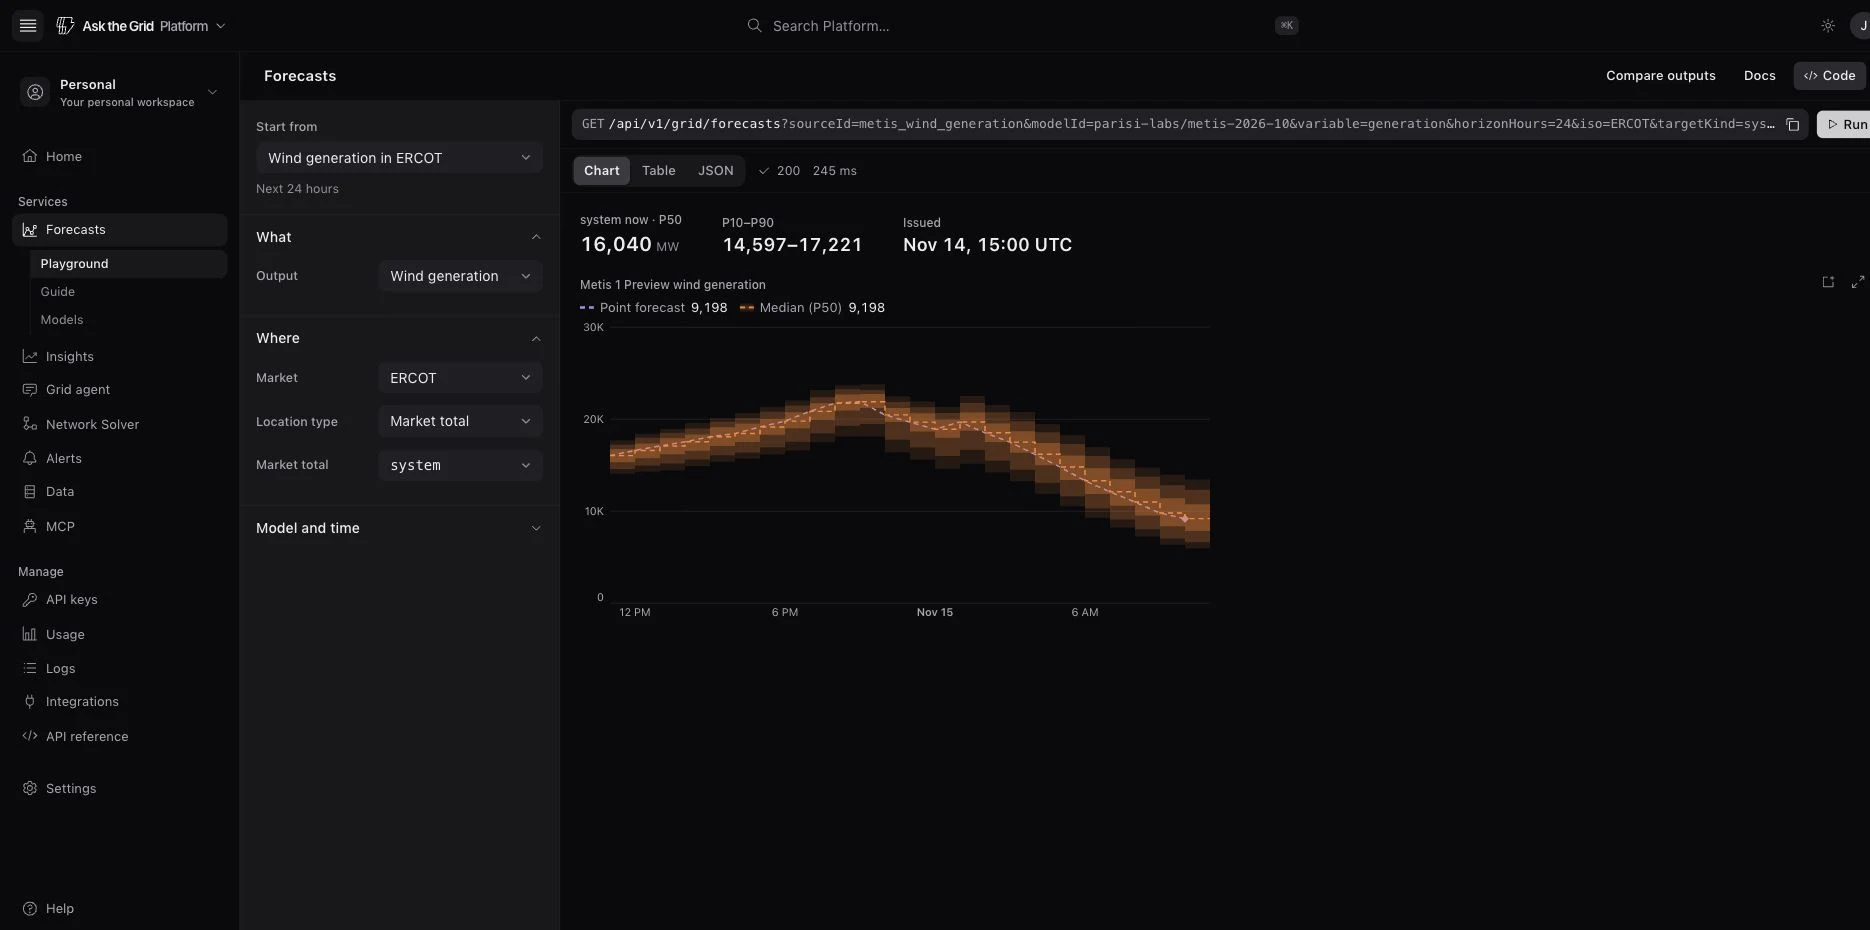
Read the range for each hour
Each hourly interval has 21 published quantiles. Use p50 for the median and p10 and p90 for the bounds of the central 80% forecast interval. Keep the issue time and model version with the result so you can compare forecasts for the same delivery hour across issuances.
Use the same request in your workflow
Run a forecast in the playground and copy the request into your application. You can request one series or send several selections together. Each series keeps its own target, unit, and interval. Use the forecast capabilities endpoint to discover what each market serves.