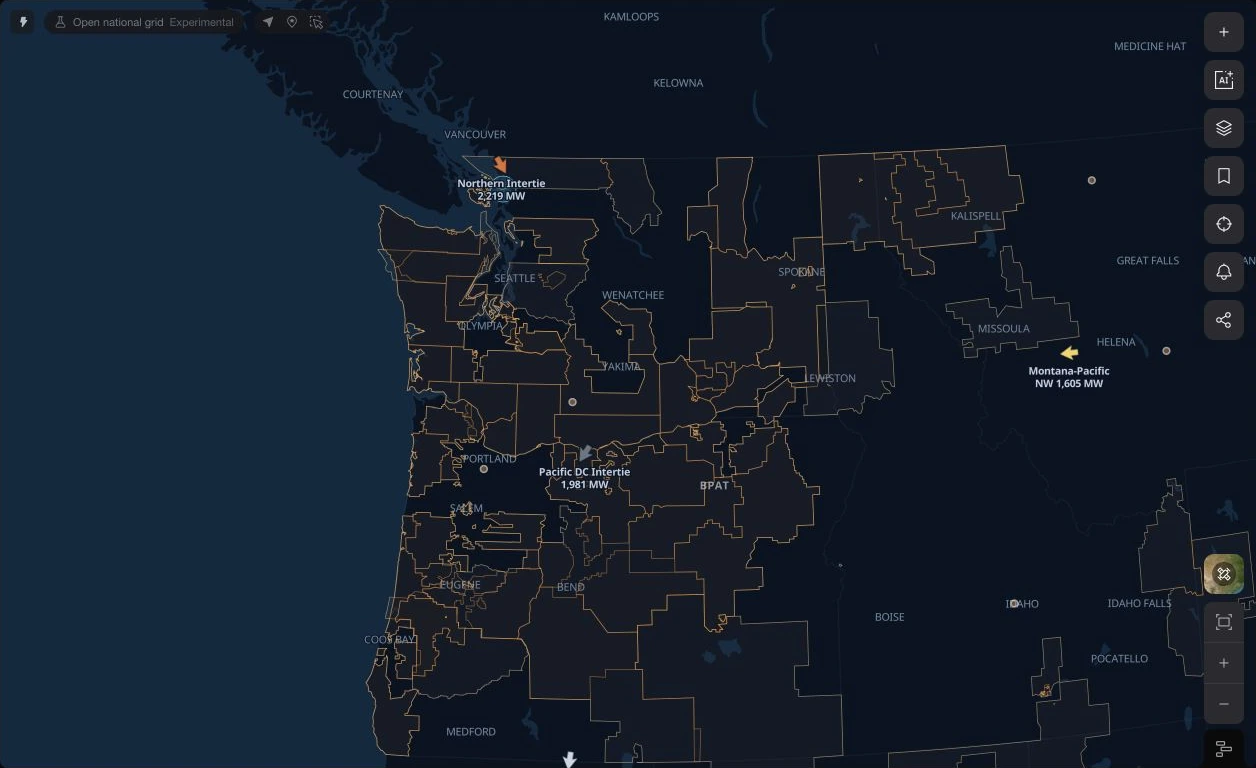
See how power moves between grids
Flow arrows, directional transfer limits, and settled neighbour interchange connect the map to the operating evidence at each grid’s boundaries.
A market’s balance depends on the systems around it. Interfaces now connect named market seams and interties to a common map and Radar workflow, showing where power is moving, the direction of that movement, and the published limits available for interpreting it.
The reading preserves the kind of evidence being shown. Physical interchange, a market schedule, transfer capability, and settled bilateral reporting answer different questions. Each keeps its operator, sign convention, units, and source time, allowing the reader to investigate a boundary without mistaking one measure for another.
Start at the market boundary
Enable Interfaces on the map to see published market seams and supported tie flows. Arrows point in the direction power is moving. The active grid supplies the operating context, while price-bearing locations remain attached to the market that publishes their prices.
An AC tie with a published directional limit can be coloured by loading. Controlled links, schedules, and unrated transfers retain their own treatment. The arrow is placed at a representative seam or substation; it does not trace the physical route of every line behind the interface.
Read flow against the appropriate limit
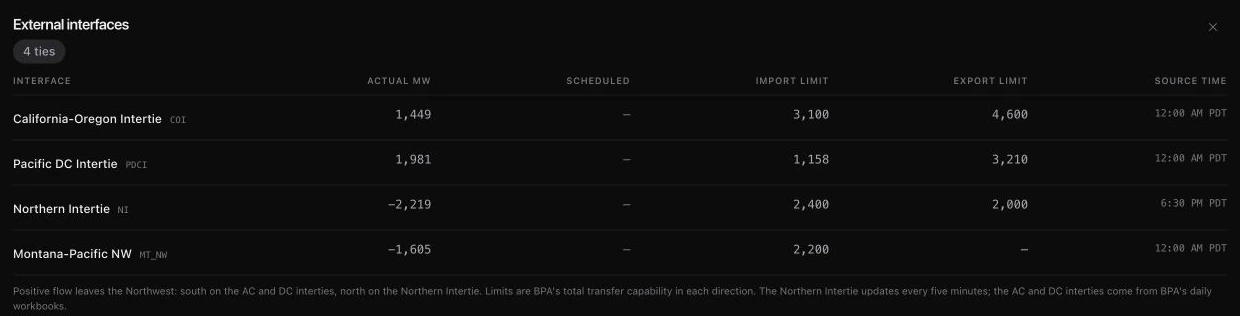
Radar’s transmission tables put actual flow beside the available import and export limits. BPA’s external-interface desk, for example, identifies the California-Oregon Intertie, Pacific DC Intertie, Northern Intertie, and Montana-Pacific Northwest connection, with its sign convention stated below the table.
Source cadence matters. The Northern Intertie updates on a five-minute feed while other BPA readings arrive in daily workbooks. Internal transfer-cut tables similarly show the operator’s published limit in the direction of flow; where a limit is absent, the flow remains a standalone reading.
Include the neighbours around the live feed
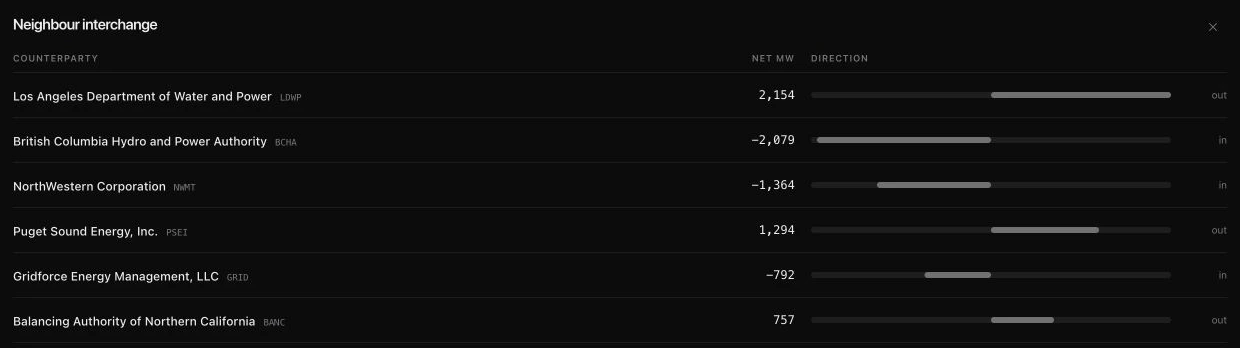
Neighbour interchange extends the view to named balancing-authority counterparties using EIA-930 bilateral reporting. A signed net-MW reading shows whether power left or entered the selected grid during the reported hour, including counterparties outside the directly supported live workspaces.
This is settled federal reporting, typically arriving about a day and a half after the operating hour. Use it to understand the broader pattern of interchange while retaining the faster operator feeds for the current operating picture.
Look ahead to available import capability
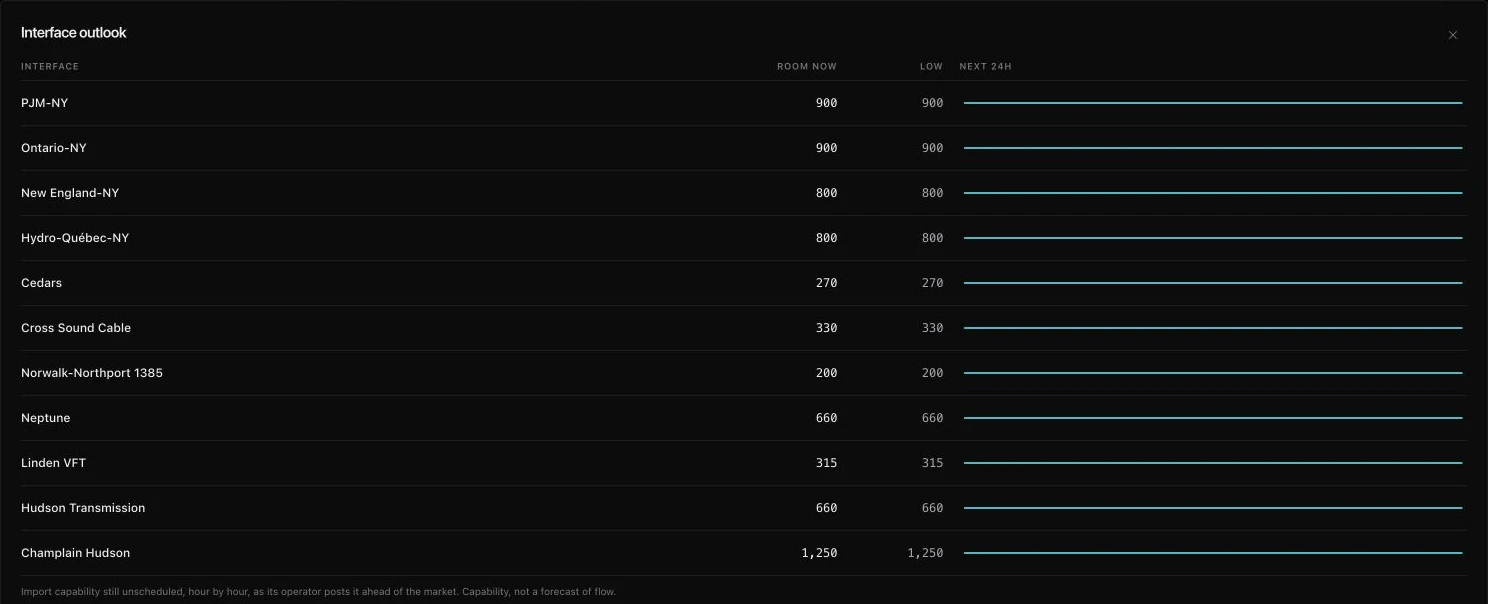
The Interface outlook desk adds the operator’s published availability for the hours ahead. In NYISO, it shows each supported tie’s available import capability, the lowest value in the next-day window, and its hourly shape.
These values describe capability still unscheduled under the operator’s publication. They are distinct from the flow currently crossing the boundary and from a forecast of future interchange. Read the outlook with its source table before using it to frame the next operating day.