Rivers join the grid map
National Weather Service river gauges, their flood thresholds and official forecasts sit on every market map, tied to the hydro plants the water reaches.
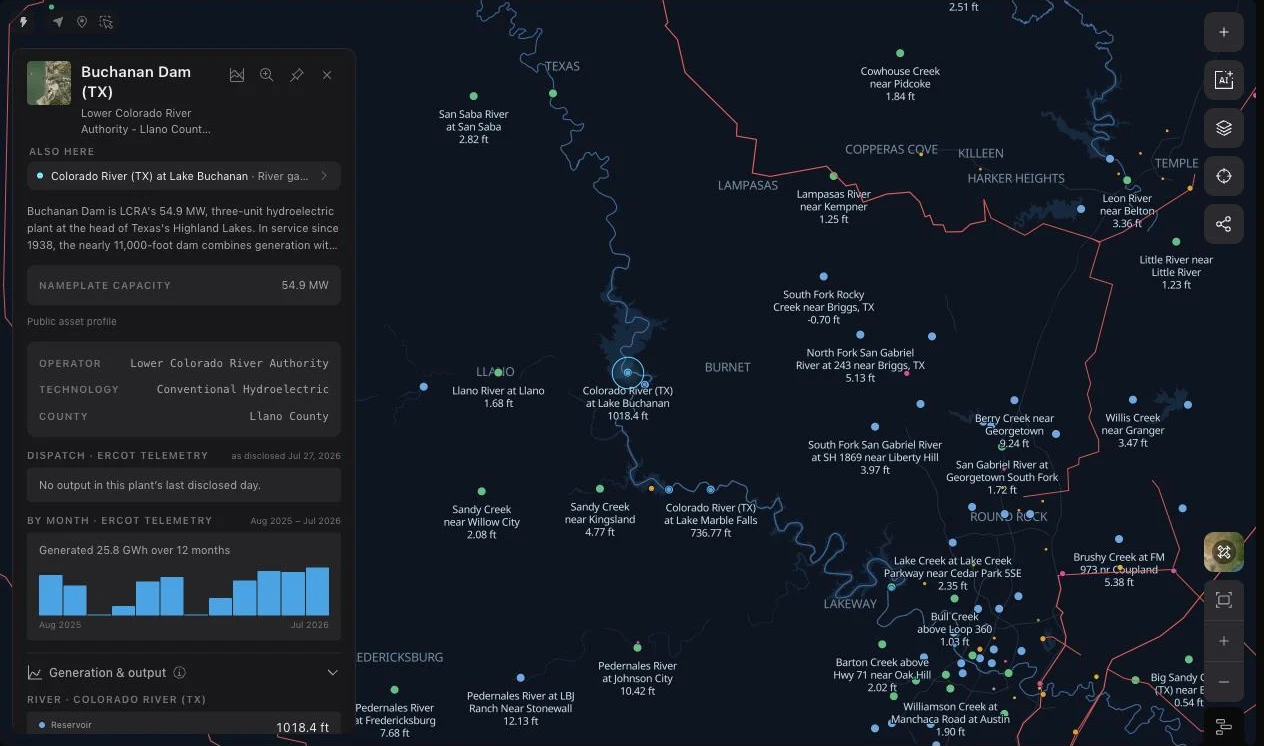
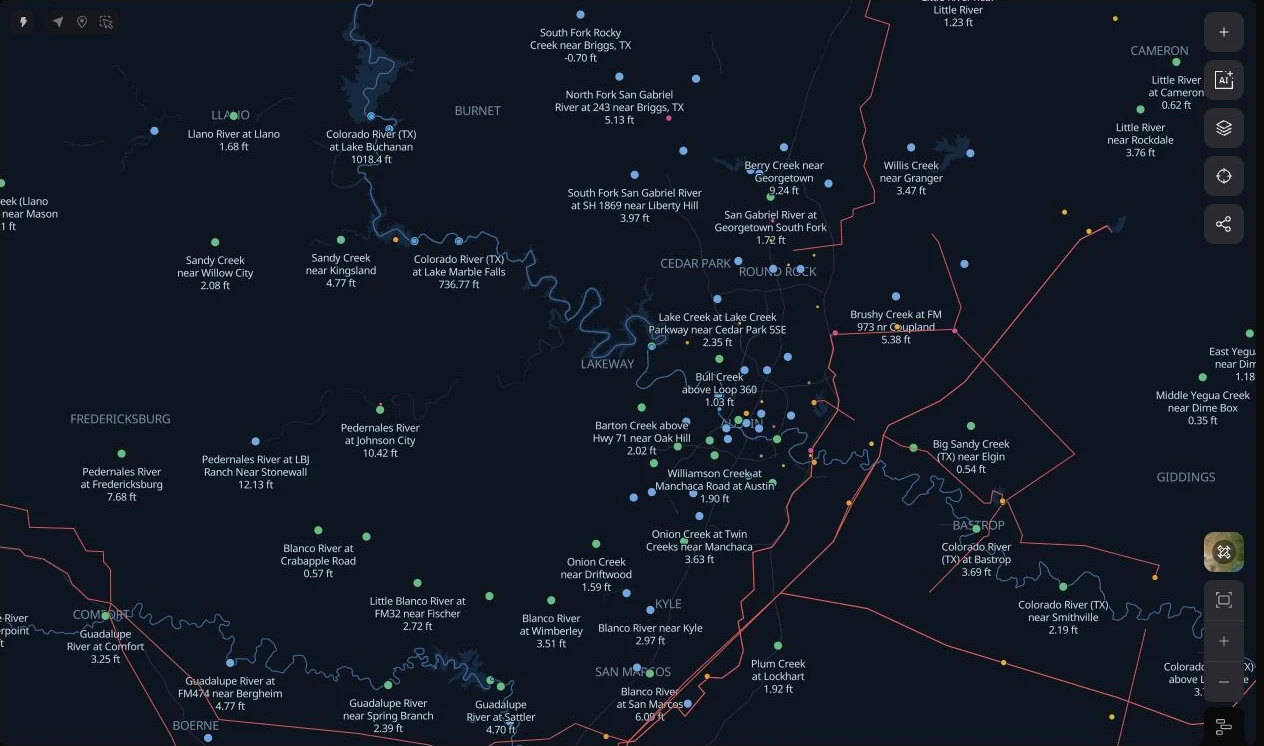
Hydro output starts upstream. The River gauges layer puts every current National Weather Service river gauge on the map, coloured by the NWS flood category it is in, so a reader following a hydro fleet, a cooling-water limit, or a flood near a substation can see the water beside the grid it affects.
Each gauge carries its stage and flow, its flood thresholds, the NWS forecast where the office issues one, and its observed history. Gauges sit inside their market's map, connect to the hydro plants they are near, and are available to the agent, so the river is part of the same investigation as prices, outages, and generation.
The river layer draws what matters at each zoom
Zoomed out, the layer draws featured gauges: those at or near a flood or low-water line now or in the forecast, official NWS forecast points, and gauges within 10 km of a hydro plant. Zoom in and every current gauge appears. Gauges that are out of service or have stopped reporting stay off the map but remain reachable from search and the Here tool.
A single-market map shows the gauges inside that market's footprint, with a margin so border rivers such as the Rio Grande stay in view. The national map shows them all. The layer follows the time scrubber, and clicking a river opens the nearest gauge on it.
Read a gauge the way the forecast office does
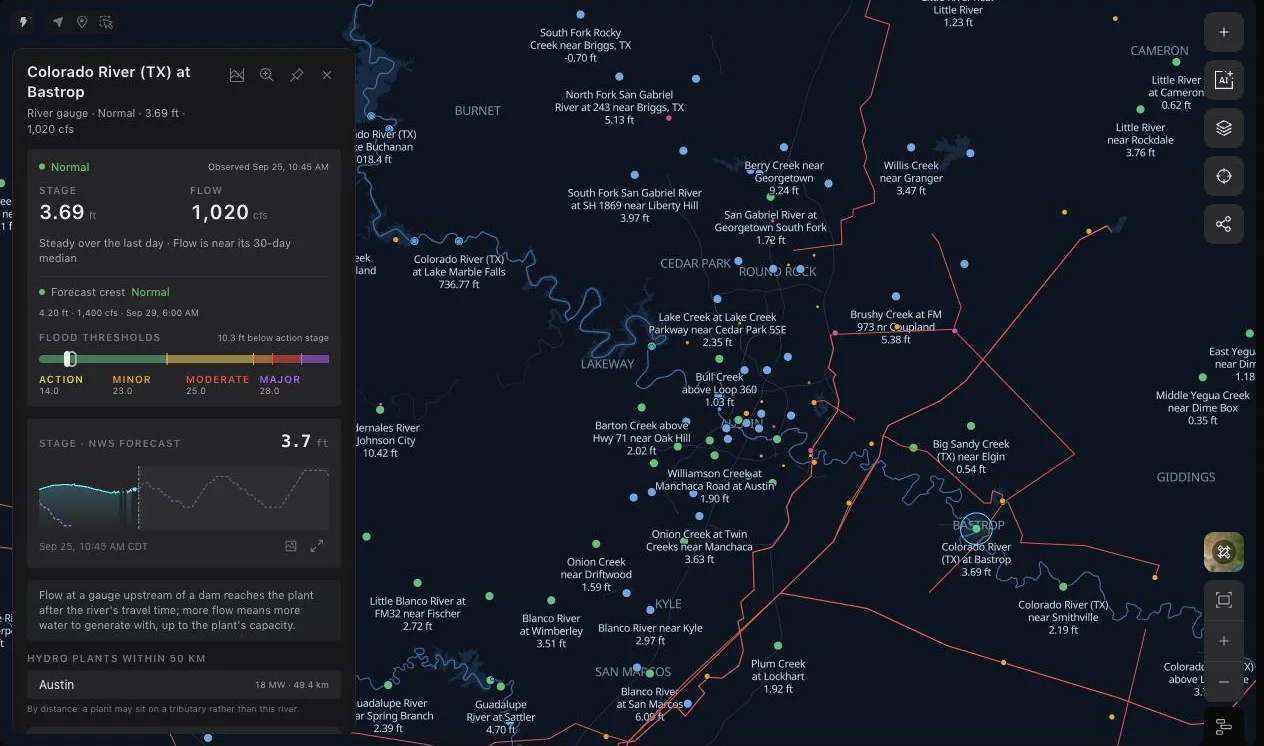
The card leads with the observed stage and flow, the day's trend, and whether flow is above or below its 30-day median. The flood-threshold ladder places the current reading against action, minor, moderate, and major stages, and the forecast crest states the expected peak and its time where NWS issues a forecast.
The chart draws the observed series with the NWS forecast hydrograph beyond it and opens in the chart studio. Observations come from the National Weather Service for every gauge it runs, including gauges with no USGS site. The card also lists the hydro plants within 50 km, noting that a plant found by distance may sit on a tributary.
Hydro plants know their river
A hydro plant card gains a River section from the nearest gauge within 5 km, labelled as the reservoir, below the dam, or on the river, and the gauge appears in the plant's Also here list. Plant cards also report monthly generation from EIA-923 filings where the market publishes no plant telemetry of its own.
The gauge tables sit in the data catalog and within the agent's reach, so a question about low water on the Colorado or a crest heading toward a plant can be answered from the same readings the map draws.