Every US pipeline's capacity joins the map
Ninety US pipeline and storage systems now draw on the map, colored by how many of their points are scheduled near capacity, with located delivery points and a grid agent that reads every posting.
Gas-fired plants supply about four in ten megawatt-hours in the US, and a plant can only run as hard as the pipeline feeding it. The natural gas pipeline map puts the capacity postings of 90 US pipeline and storage systems on the same map as the grid, refreshed through each gas day, so a question about a power plant can follow its fuel back to the point where it is delivered.
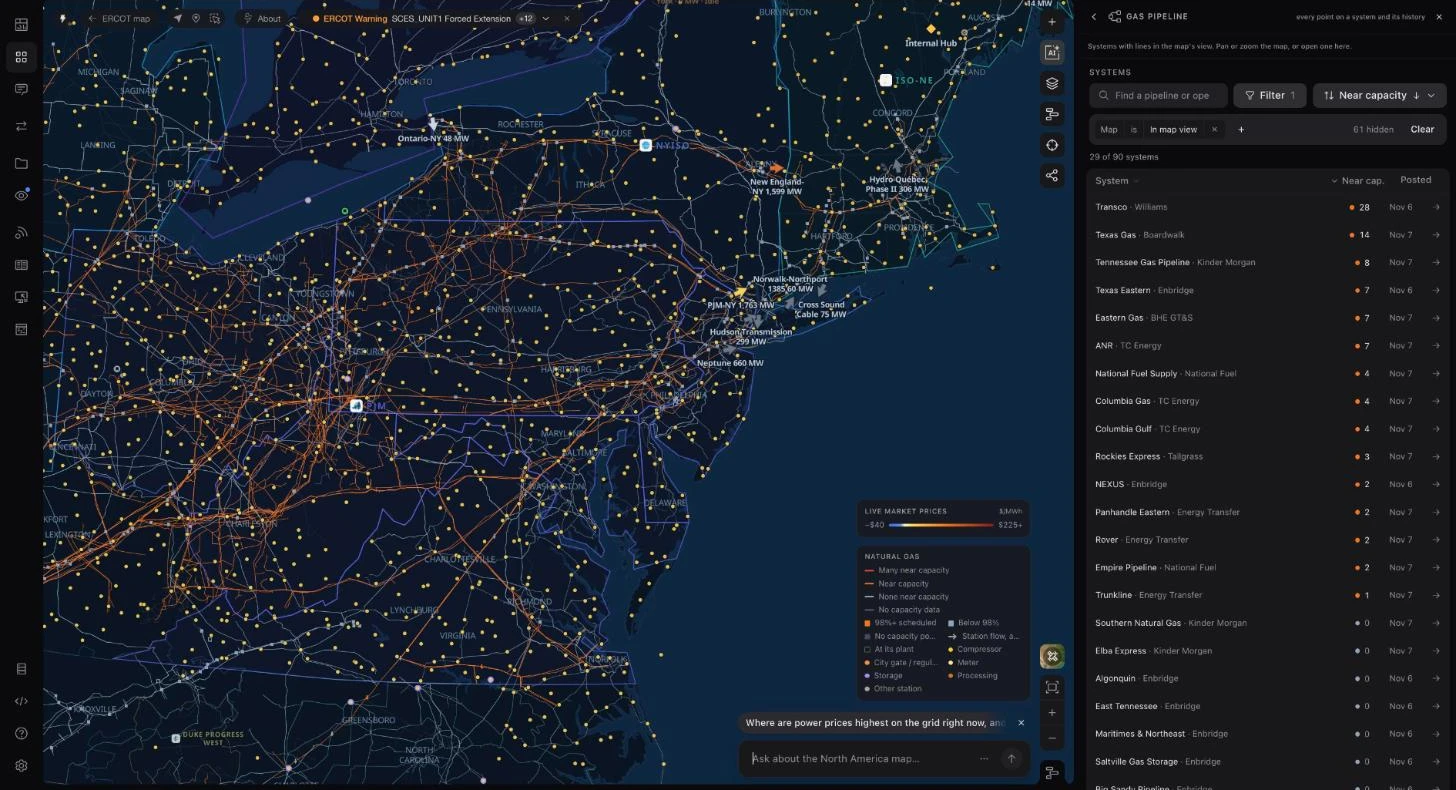
Every interstate line is colored by how many of its system's receipt and delivery points are scheduled at 98% or more of operating capacity. Open a pipeline to see its points, open a point to see its history, and ask the grid agent to read every posting at once.
See which lines are full
Open the pipeline tool and each system takes one of four states from its latest posting: red when many points are near capacity, orange when some are, light gray when none are, and dim when the posting carries no capacity figures. A point counts as near capacity when its scheduled quantity is 98% or more of an operating capacity of at least 10,000 Dth/d, so small meters do not dominate the count.
The list beside the map keeps to the systems with lines in view and follows the map as you pan. It ranks them by points near capacity, shows each system's latest gas day, and can be re-sorted by distance to the view or filtered by status. Pipeline lines draw on every market map and on the national view, and Natural gas in Map content turns them on.
Open a system, then a point
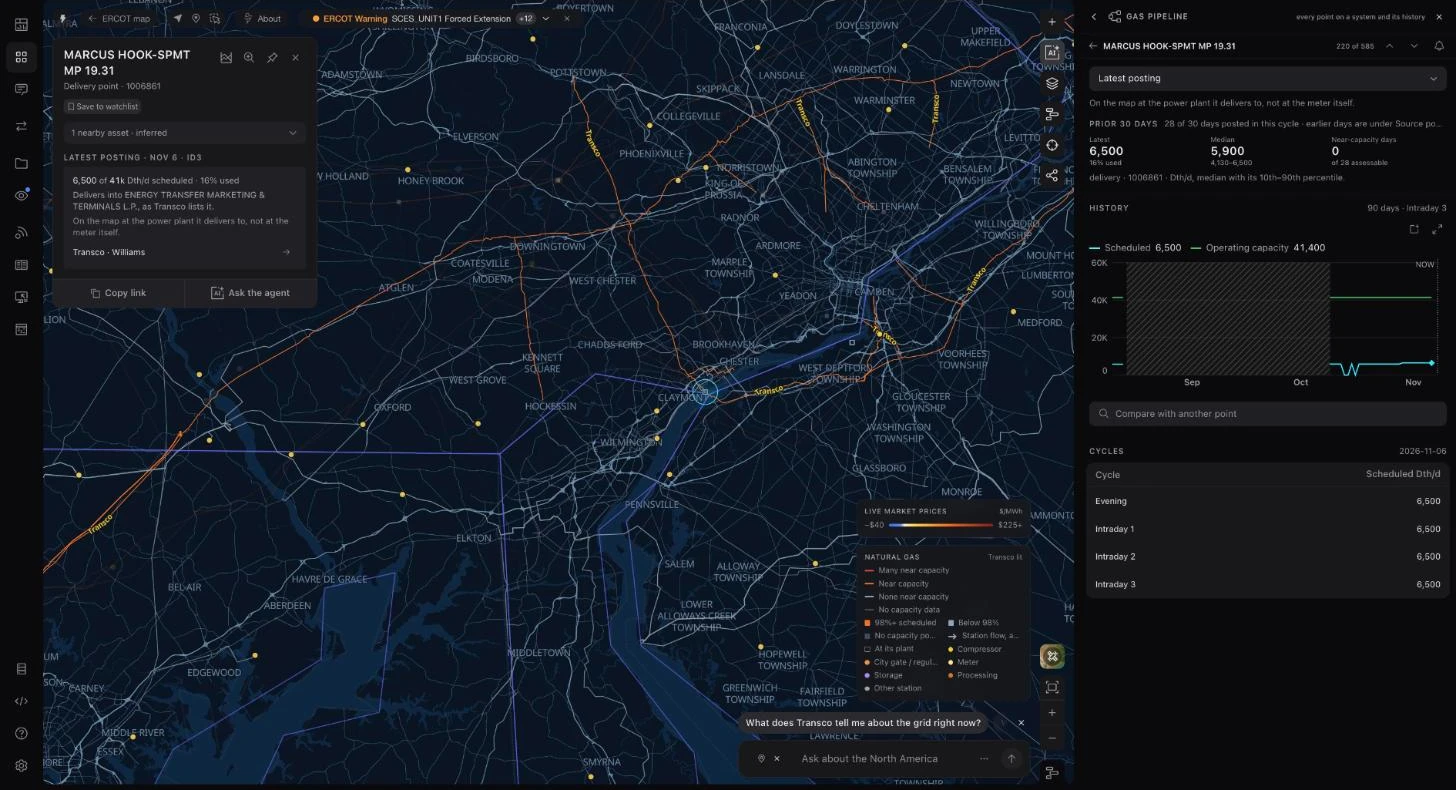
A system opens with its near-capacity count, every receipt and delivery point with its scheduled quantity and recent days full, and the power plants matched to its delivery points. A point opens with its 90-day history against operating capacity and how the latest gas day moved through the nomination cycles.
The tool opens on each pipeline's latest available posting and names its cycle. Where an operator's labels do not establish a standard cycle, the posting is marked unverified. Quantities are scheduled nominations, not metered flow, and one system's postings describe the whole pipeline: a red line means many of that system's points are full, not every mile of the segment in view.
Points placed where they sit
Pipeline postings name points by a location number, not by coordinates. Ask the Grid matches each point to the archived HIFLD receipt and delivery points layer through the industry's reference numbers and the operators' own cross-reference files, and keeps a match only when it falls in the county the operator reports and near the system's own line.
A placed delivery point opens on its latest posting: scheduled against operating capacity for the cycle, the median and range over the prior 30 days, the 90-day history and each of the day's cycles. The card says how the point was placed, here at the power plant it delivers to rather than at the meter. A point that can be placed only to its county lights that county's stretch of the line instead of a dot, and points that cannot be matched are left off the map rather than guessed.
Ask the agent about every posting
The grid agent can query every pipeline system, compare capacity across them and open one on the map, and a selected gas point can be passed to it as page context.
The US natural gas pipeline View gives the same capacity picture a public address you can share.