US natural gas pipeline map: live capacity by pipeline
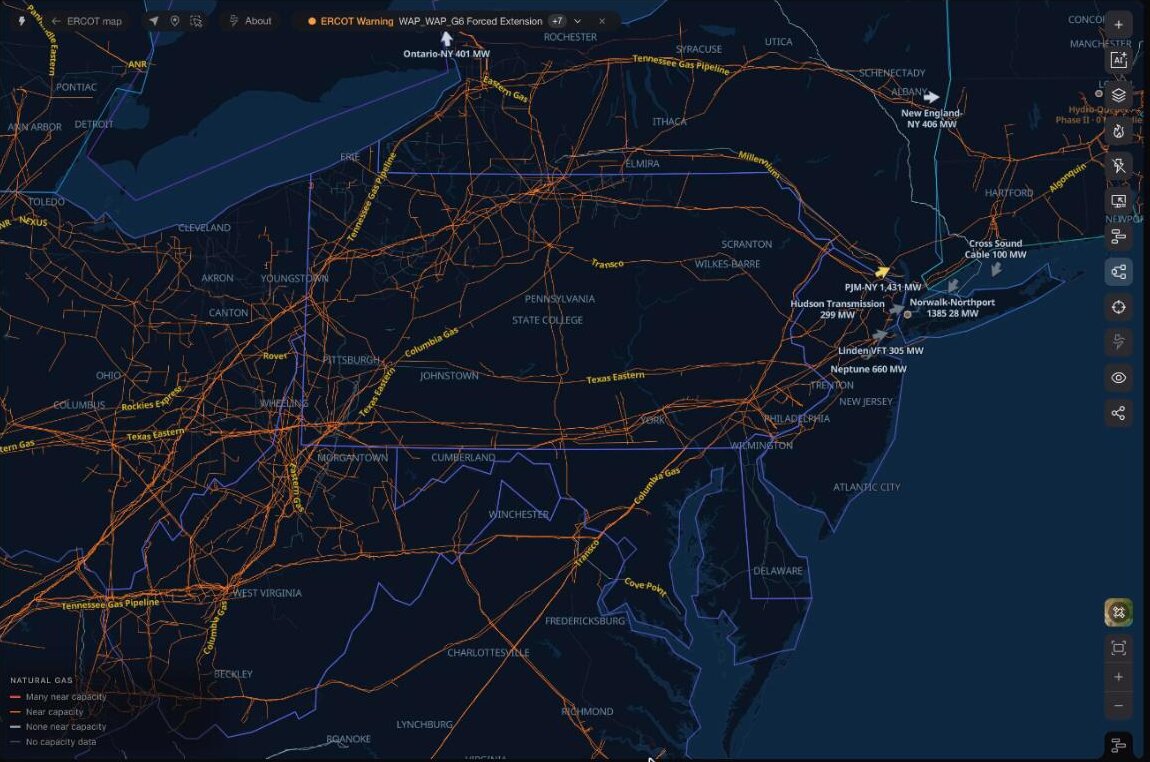
Interstate gas pipelines across the US, colored by how many of each system's points are scheduled near capacity on the latest gas day. Open the map to find a pipeline, read its points and follow a delivery point's history.
See it on the live map, updating as each pipeline posts.
Explore the natural gas pipeline mapAbout this view
Read capacity by pipeline
Each interstate pipeline posts, for every gas day and nomination cycle, the operating capacity and scheduled quantity at its receipt and delivery points. A record counts as near capacity when its schedule is 98% or more of an operating capacity of at least 10,000 Dth/d. The table ranks systems by those records on their latest posting; the map colors each system's lines red when many are near capacity, orange when some are, light gray when none are, and dim when the posting carries no capacity.
Open a pipeline and its points
Open any system to see every receipt and delivery point with its scheduled quantity, recent days full and matched power plants. Located points draw on the system's line, from imagery-checked HIFLD points matched by the operator's DRN; a point placed only to its county lights that stretch of line instead of a dot.
What a posting does and does not show
Quantities are scheduled nominations in Dth/d, not metered flow. A system's posting describes the whole pipeline, so a red line means many of its points are full, not that every segment in view is.
Questions
Is there a live map of US natural gas pipelines?
Yes. This map draws EIA's interstate and intrastate pipeline routes with OpenStreetMap transmission lines, and colors each interstate system by its latest capacity posting. Lines draw from zoom 5 in.
What does near capacity mean?
A receipt or delivery record whose scheduled quantity is 98% or more of its posted operating capacity, counted only where operating capacity is at least 10,000 Dth/d so small meters do not dominate.
Does the map show gas flow?
No. It shows scheduled nominations at posted points. Metered flow is not part of these postings.
How current is it?
Each pipeline is read through the gas day, and the table shows each system's latest gas day and nomination cycle. Where an operator's labels do not establish a standard cycle, the posting is marked unverified.
Can I see one pipeline's points?
Yes. Select a pipeline in the table or on the map to open it in the pipeline tool, with every point, its 90-day history and the power plants matched to its delivery points.