The Batteries Winning ERCOT's New Market
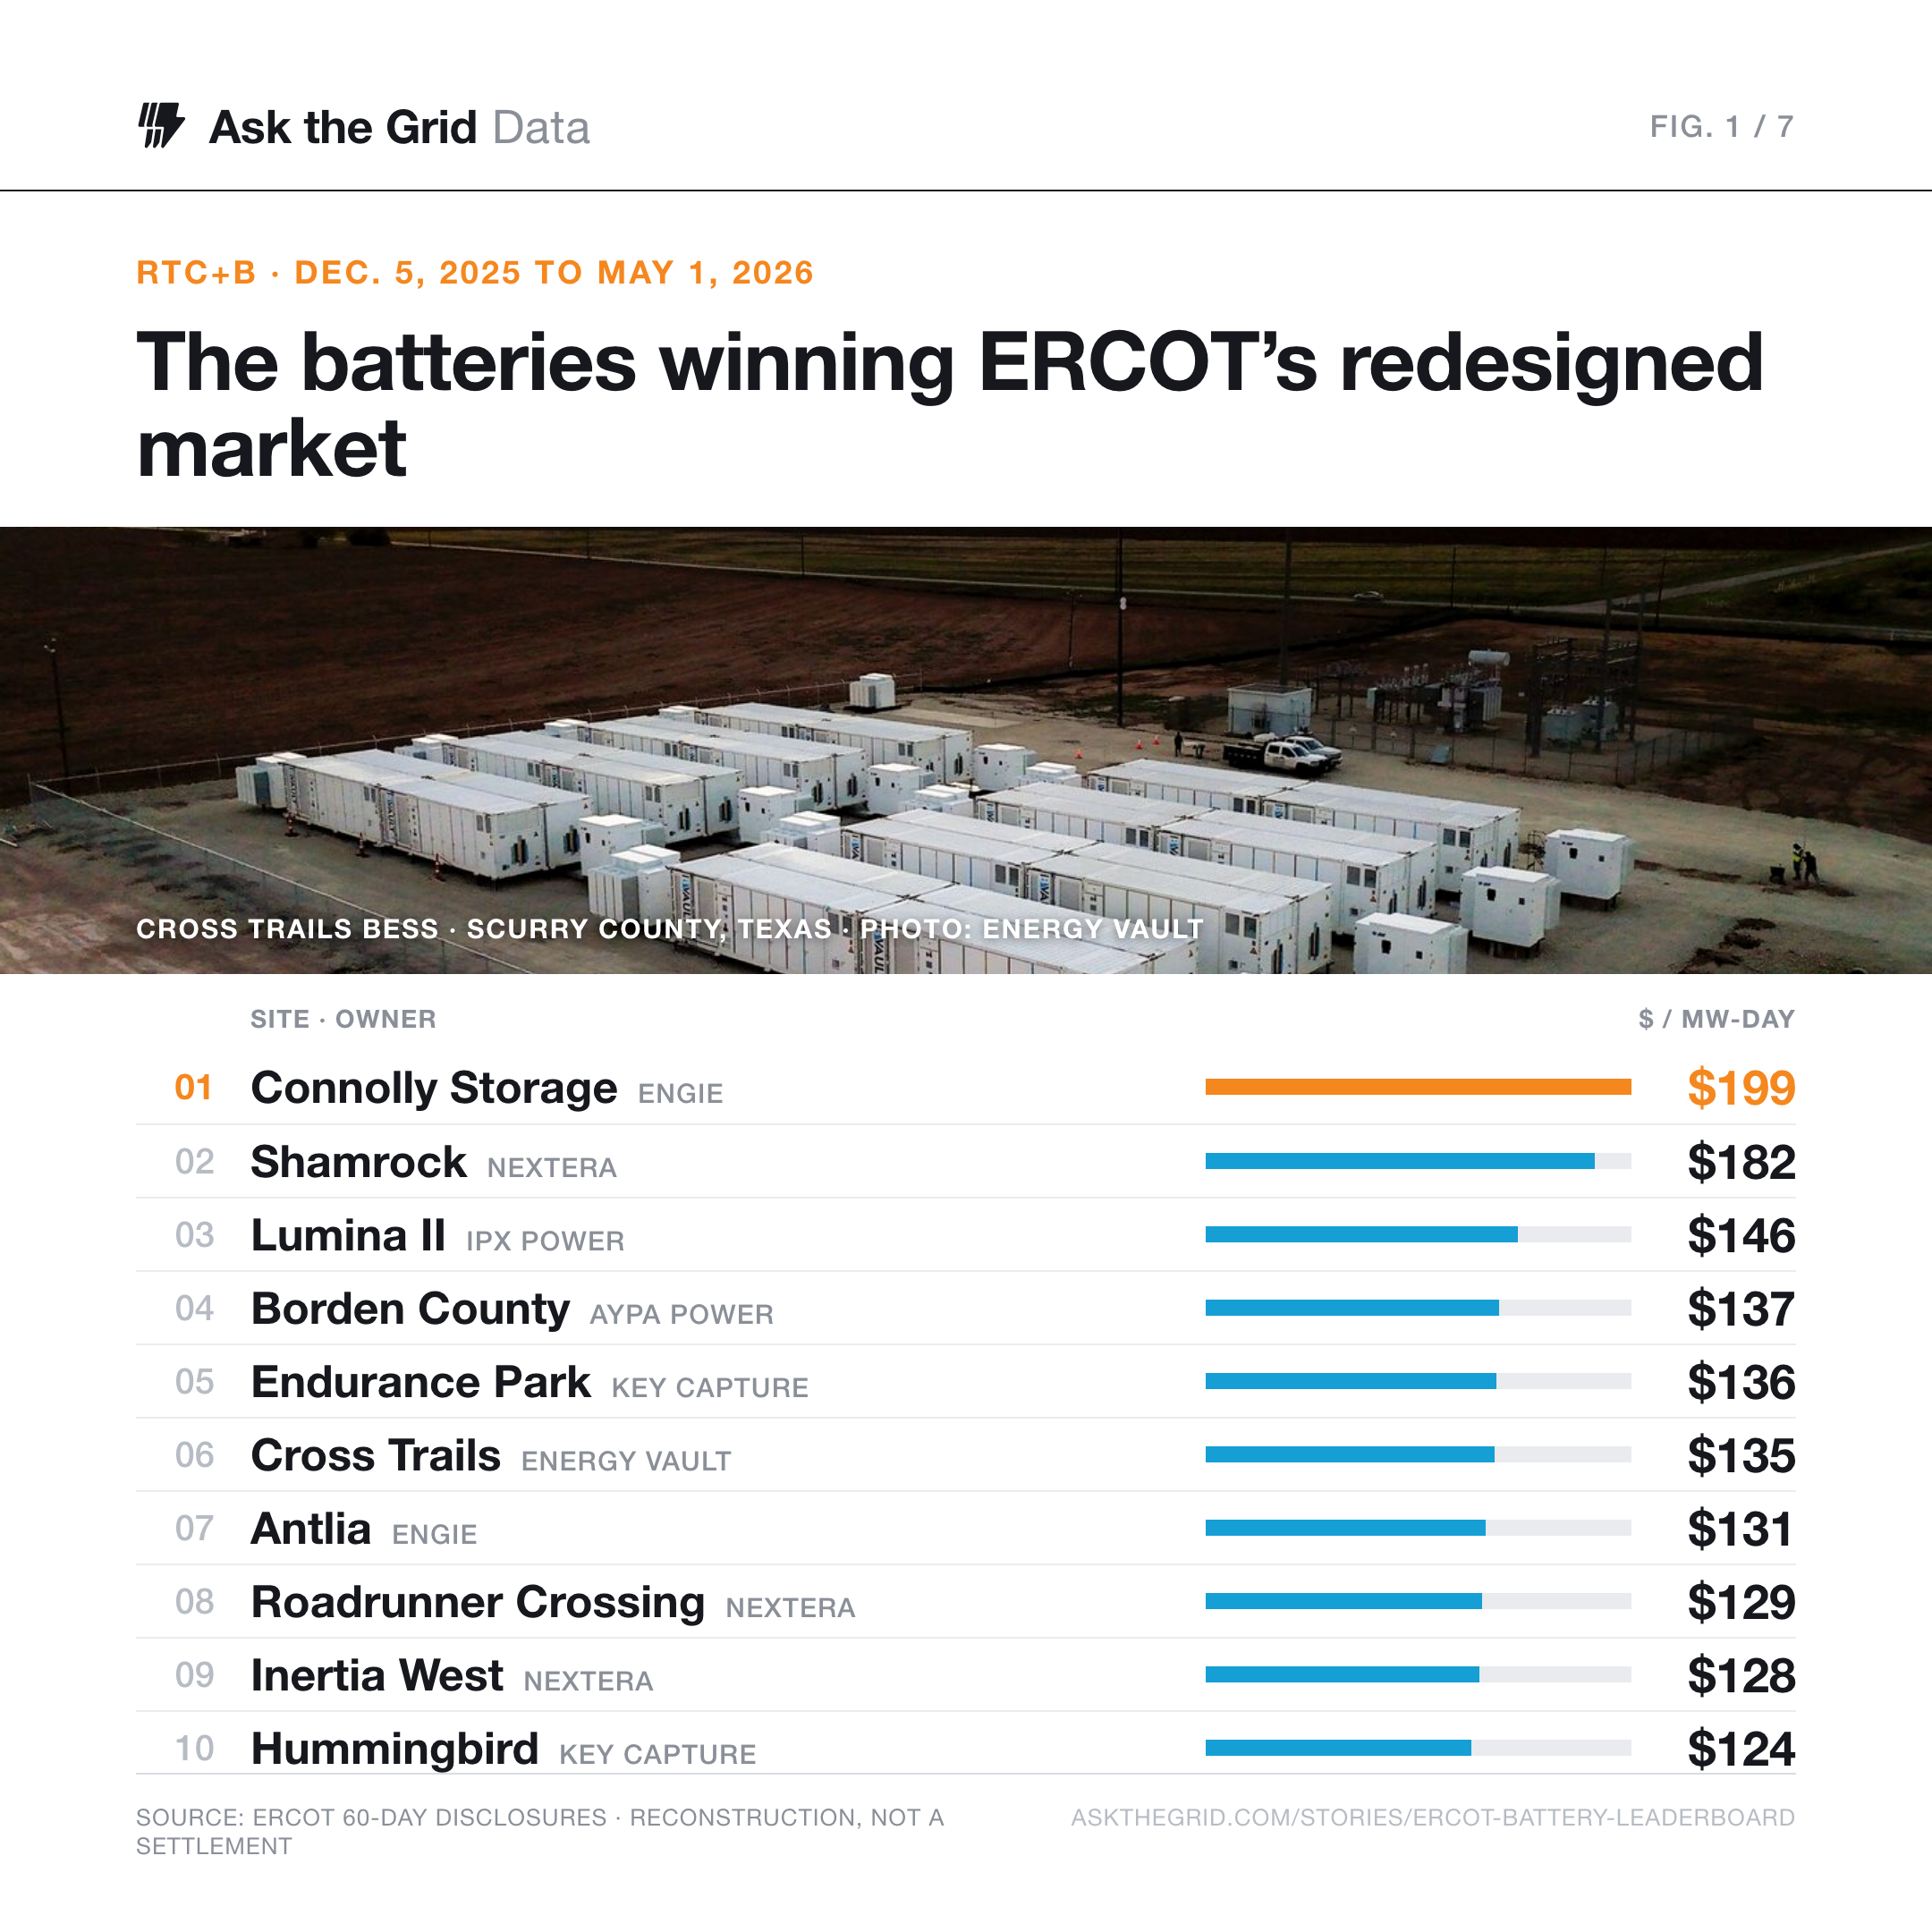
On December 5, 2025, ERCOT added five-minute real-time co-optimization of energy and ancillary services. Five months later, ten battery sites out-yield the rest of the fleet by about 2.7 times in a validated public-data revenue reconstruction. Here is the board, and what it takes to top it.
For a decade a battery on the Texas grid had to place two separate bets. It offered ancillary services, the fast reserves that hold system frequency, in one day-ahead process, then chased energy arbitrage in another, and the real-time market took whatever was left over. On December 5, 2025, ERCOT changed the real-time side of that math. It added five-minute real-time co-optimization of energy and ancillary services: the day-ahead market stays separate, but within the same real-time optimization a battery can now be reassigned between energy and reserves as their values move, every five minutes. The batteries built and operated to flex between the two started pulling away from the ones that were not.
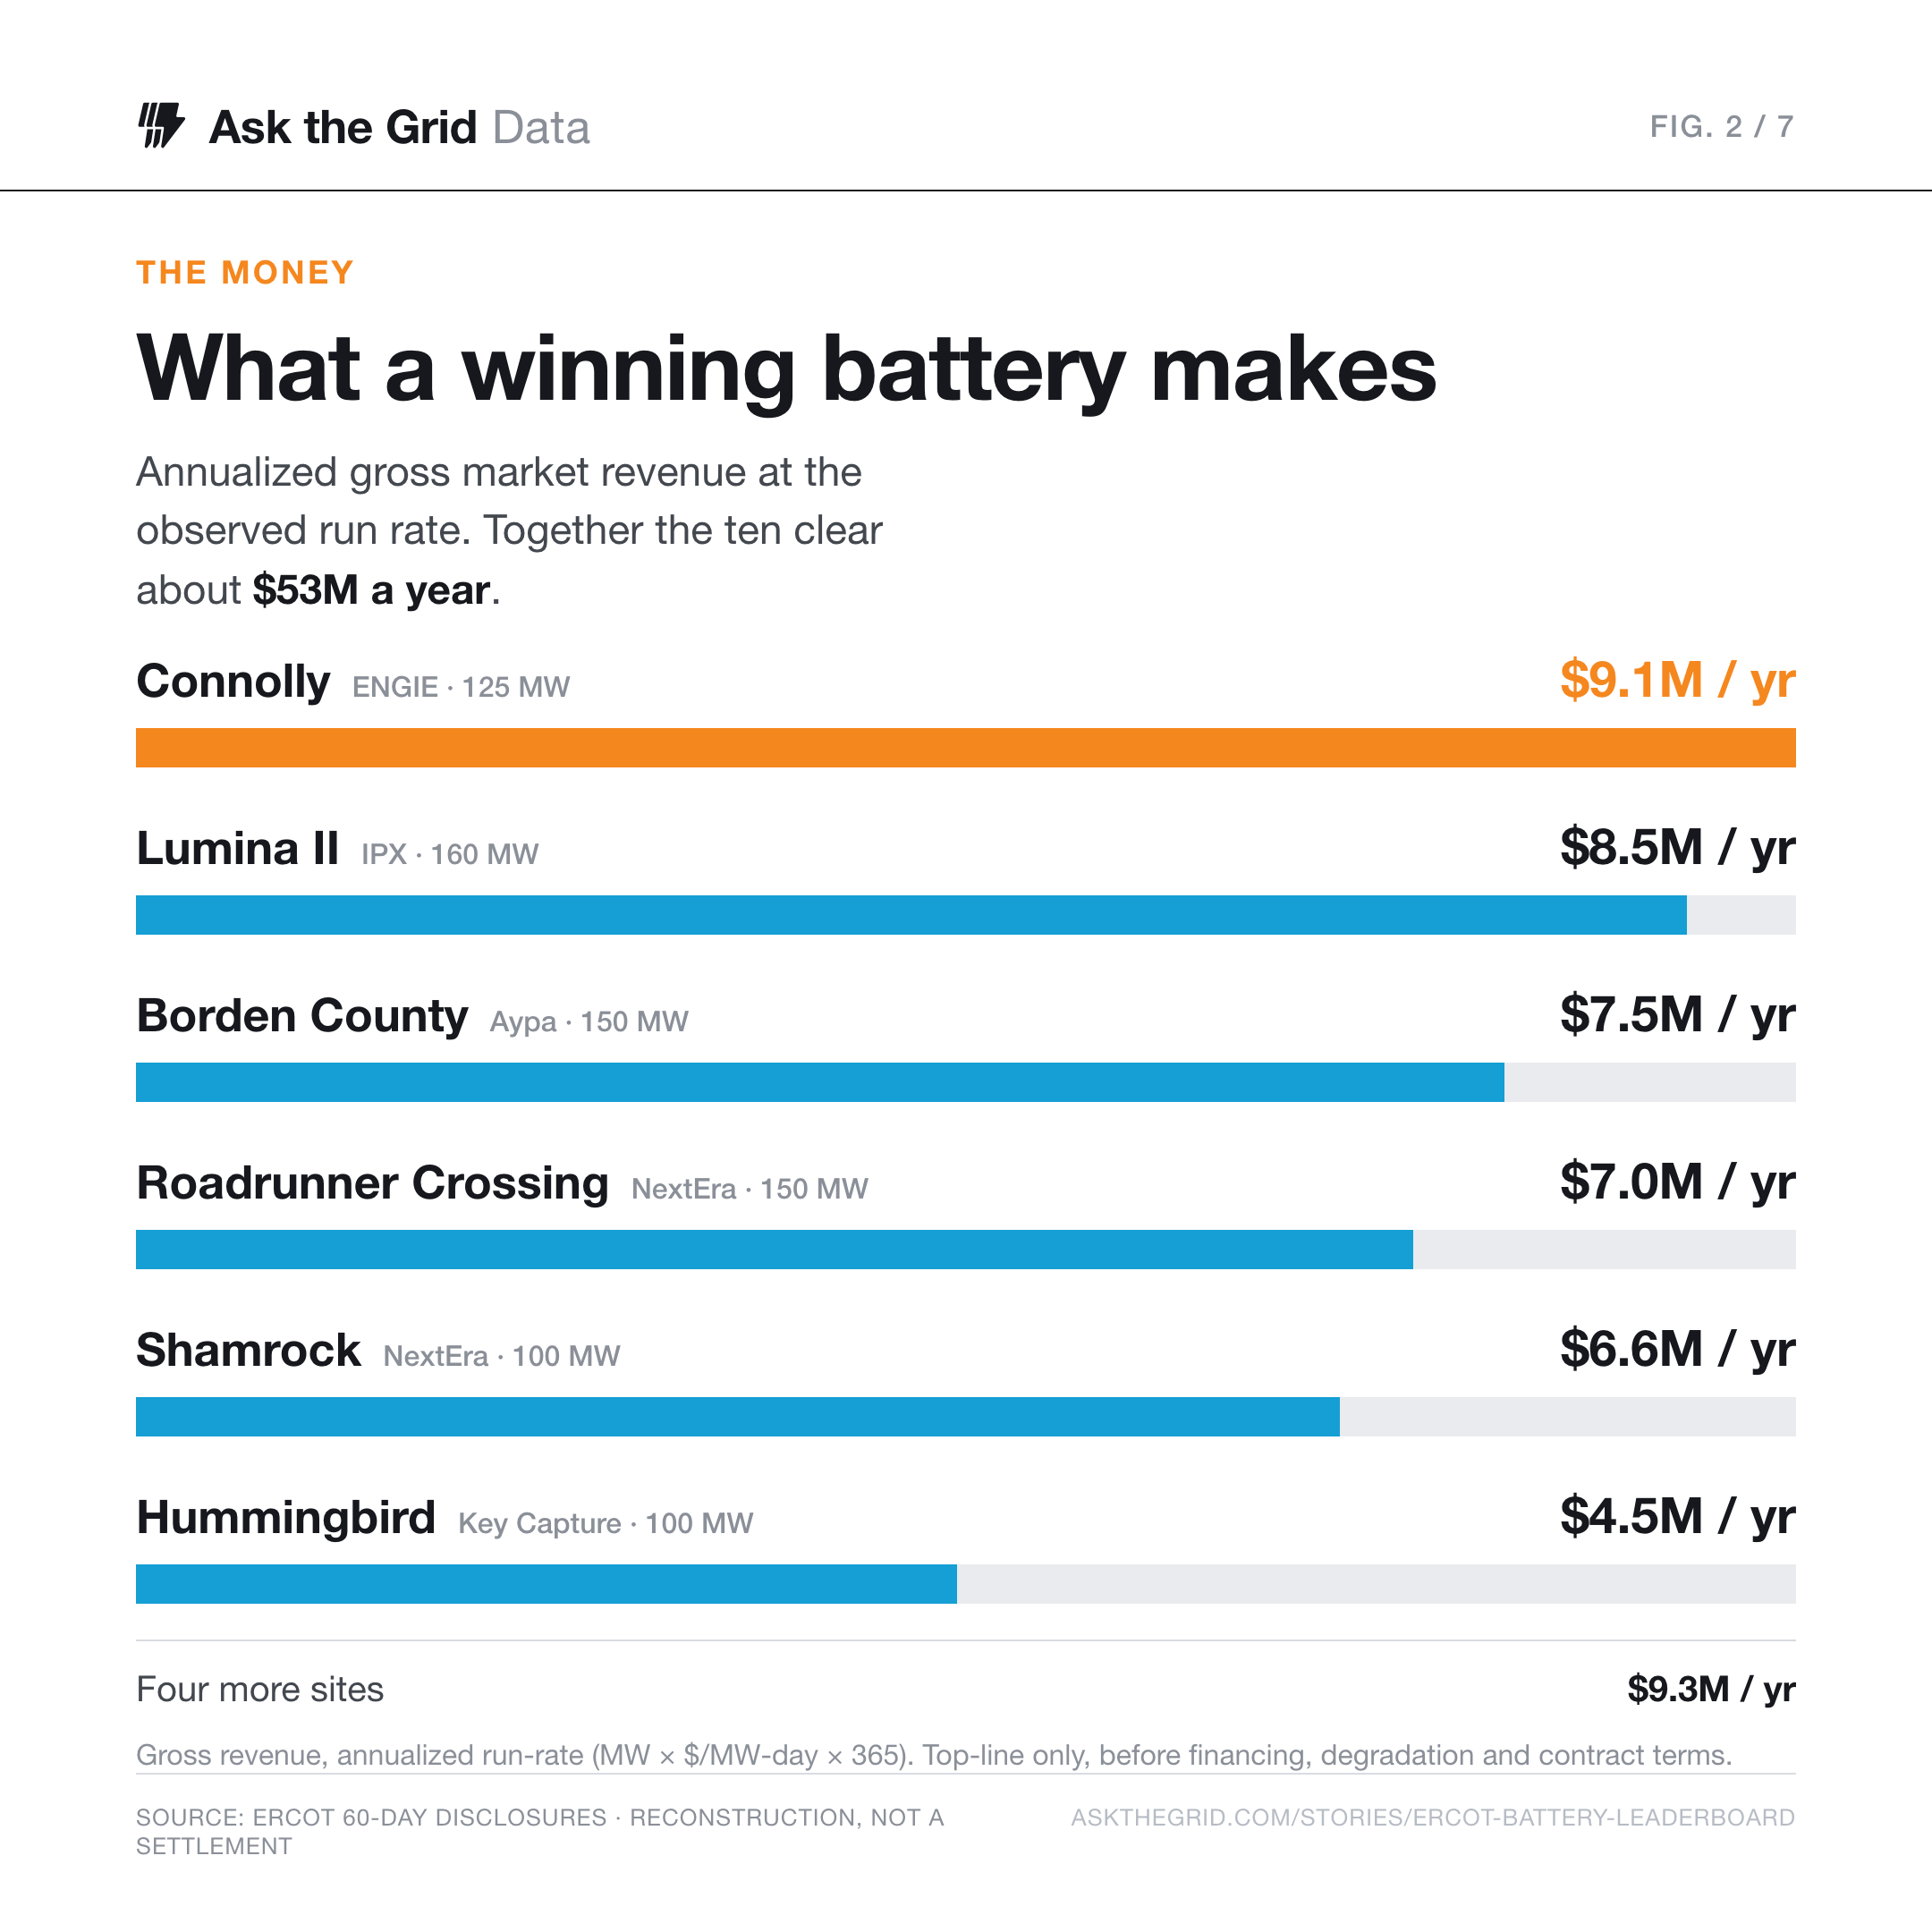
The board below ranks the ten highest-yielding Energy Storage Resources in our eligible ERCOT fleet over the first five months of the new market, by a validated public-data revenue reconstruction, frozen on the publish date. Day-ahead energy and reserves are exact from ERCOT's 60-day disclosures; the real-time term is an imbalance, actual output netted against the day-ahead position and priced at the real-time price. It lands within about five percent of an independent reconstruction, but it is not a settlement statement, and the method sits under the table.
The ten highest-yielding sites in our eligible ERCOT battery fleet after RTC+B go-live, by a validated public-data revenue reconstruction.
| # | Site | MW | MWh | Est. revenue$/MW-day |
|---|---|---|---|---|
| 1 | Connolly Storage ENGIE · CNLY_ESS_RN | 125 | 250 | $199 |
| 2 | Shamrock NextEra Energy · SHAMROCK_RN | 99.8 | 325 | $182 |
| 3 | Lumina II IPX Power · ANDMDSLR_ALL | 160 | 328 | $146 |
| 4 | Borden County Aypa Power · BOCO_ESS_RN | 150 | 380 | $137 |
| 5 | Endurance Park Key Capture Energy · ENDPARK_ESS1 | 50.0 | 113 | $136 |
| 6 | Cross Trails Energy Vault · CROSSTRL_RN | 57.3 | 125 | $135 |
| 7 | Antlia ENGIE · ANTL_ESS_ES1 | 70.0 | 171 | $131 |
| 8 | Roadrunner Crossing NextEra Energy · RRC_WIND_ALL | 150 | 452 | $129 |
| 9 | Inertia West NextEra Energy · INRT_W_ALL | 13.0 | 49.4 | $128 |
| 10 | Hummingbird Key Capture Energy · HMNG_ESS_RN | 100 | 246 | $124 |
Method: A public-data revenue reconstruction: day-ahead energy (award × disclosed settlement-point price) and ancillary awards (× MCPC) are exact from ERCOT's 60-day DAM ESR disclosures; the real-time term is an imbalance: actual telemetered output netted against the day-ahead position, priced at the RT nodal LMP. Eligible = identity-resolved sites active across the window (≥100 days, ≥10 MW), with multiple ESR units grouped by settlement point. Logo = owner/developer; hover a site for its ERCOT Resource Entity and scheduling QSE.
Caveat: Validated against an independent public reconstruction (within ~5% on total revenue). Exact ranks are method-sensitive, though: an independent board that ranks individual ESR units rather than grouped sites places Endurance Park and Cross Trails well below the top ten. Not a settlement statement: the RT term uses telemetered output and the RT LMP rather than settlement-metered energy and the Real-Time Settlement Point Price (which adds scarcity adders), and it excludes the RT ancillary imbalance, hedges, tolls, degradation and other contract economics. Neither the QSE nor the Owner RE is a claim of beneficial ownership.
The spread is the story#
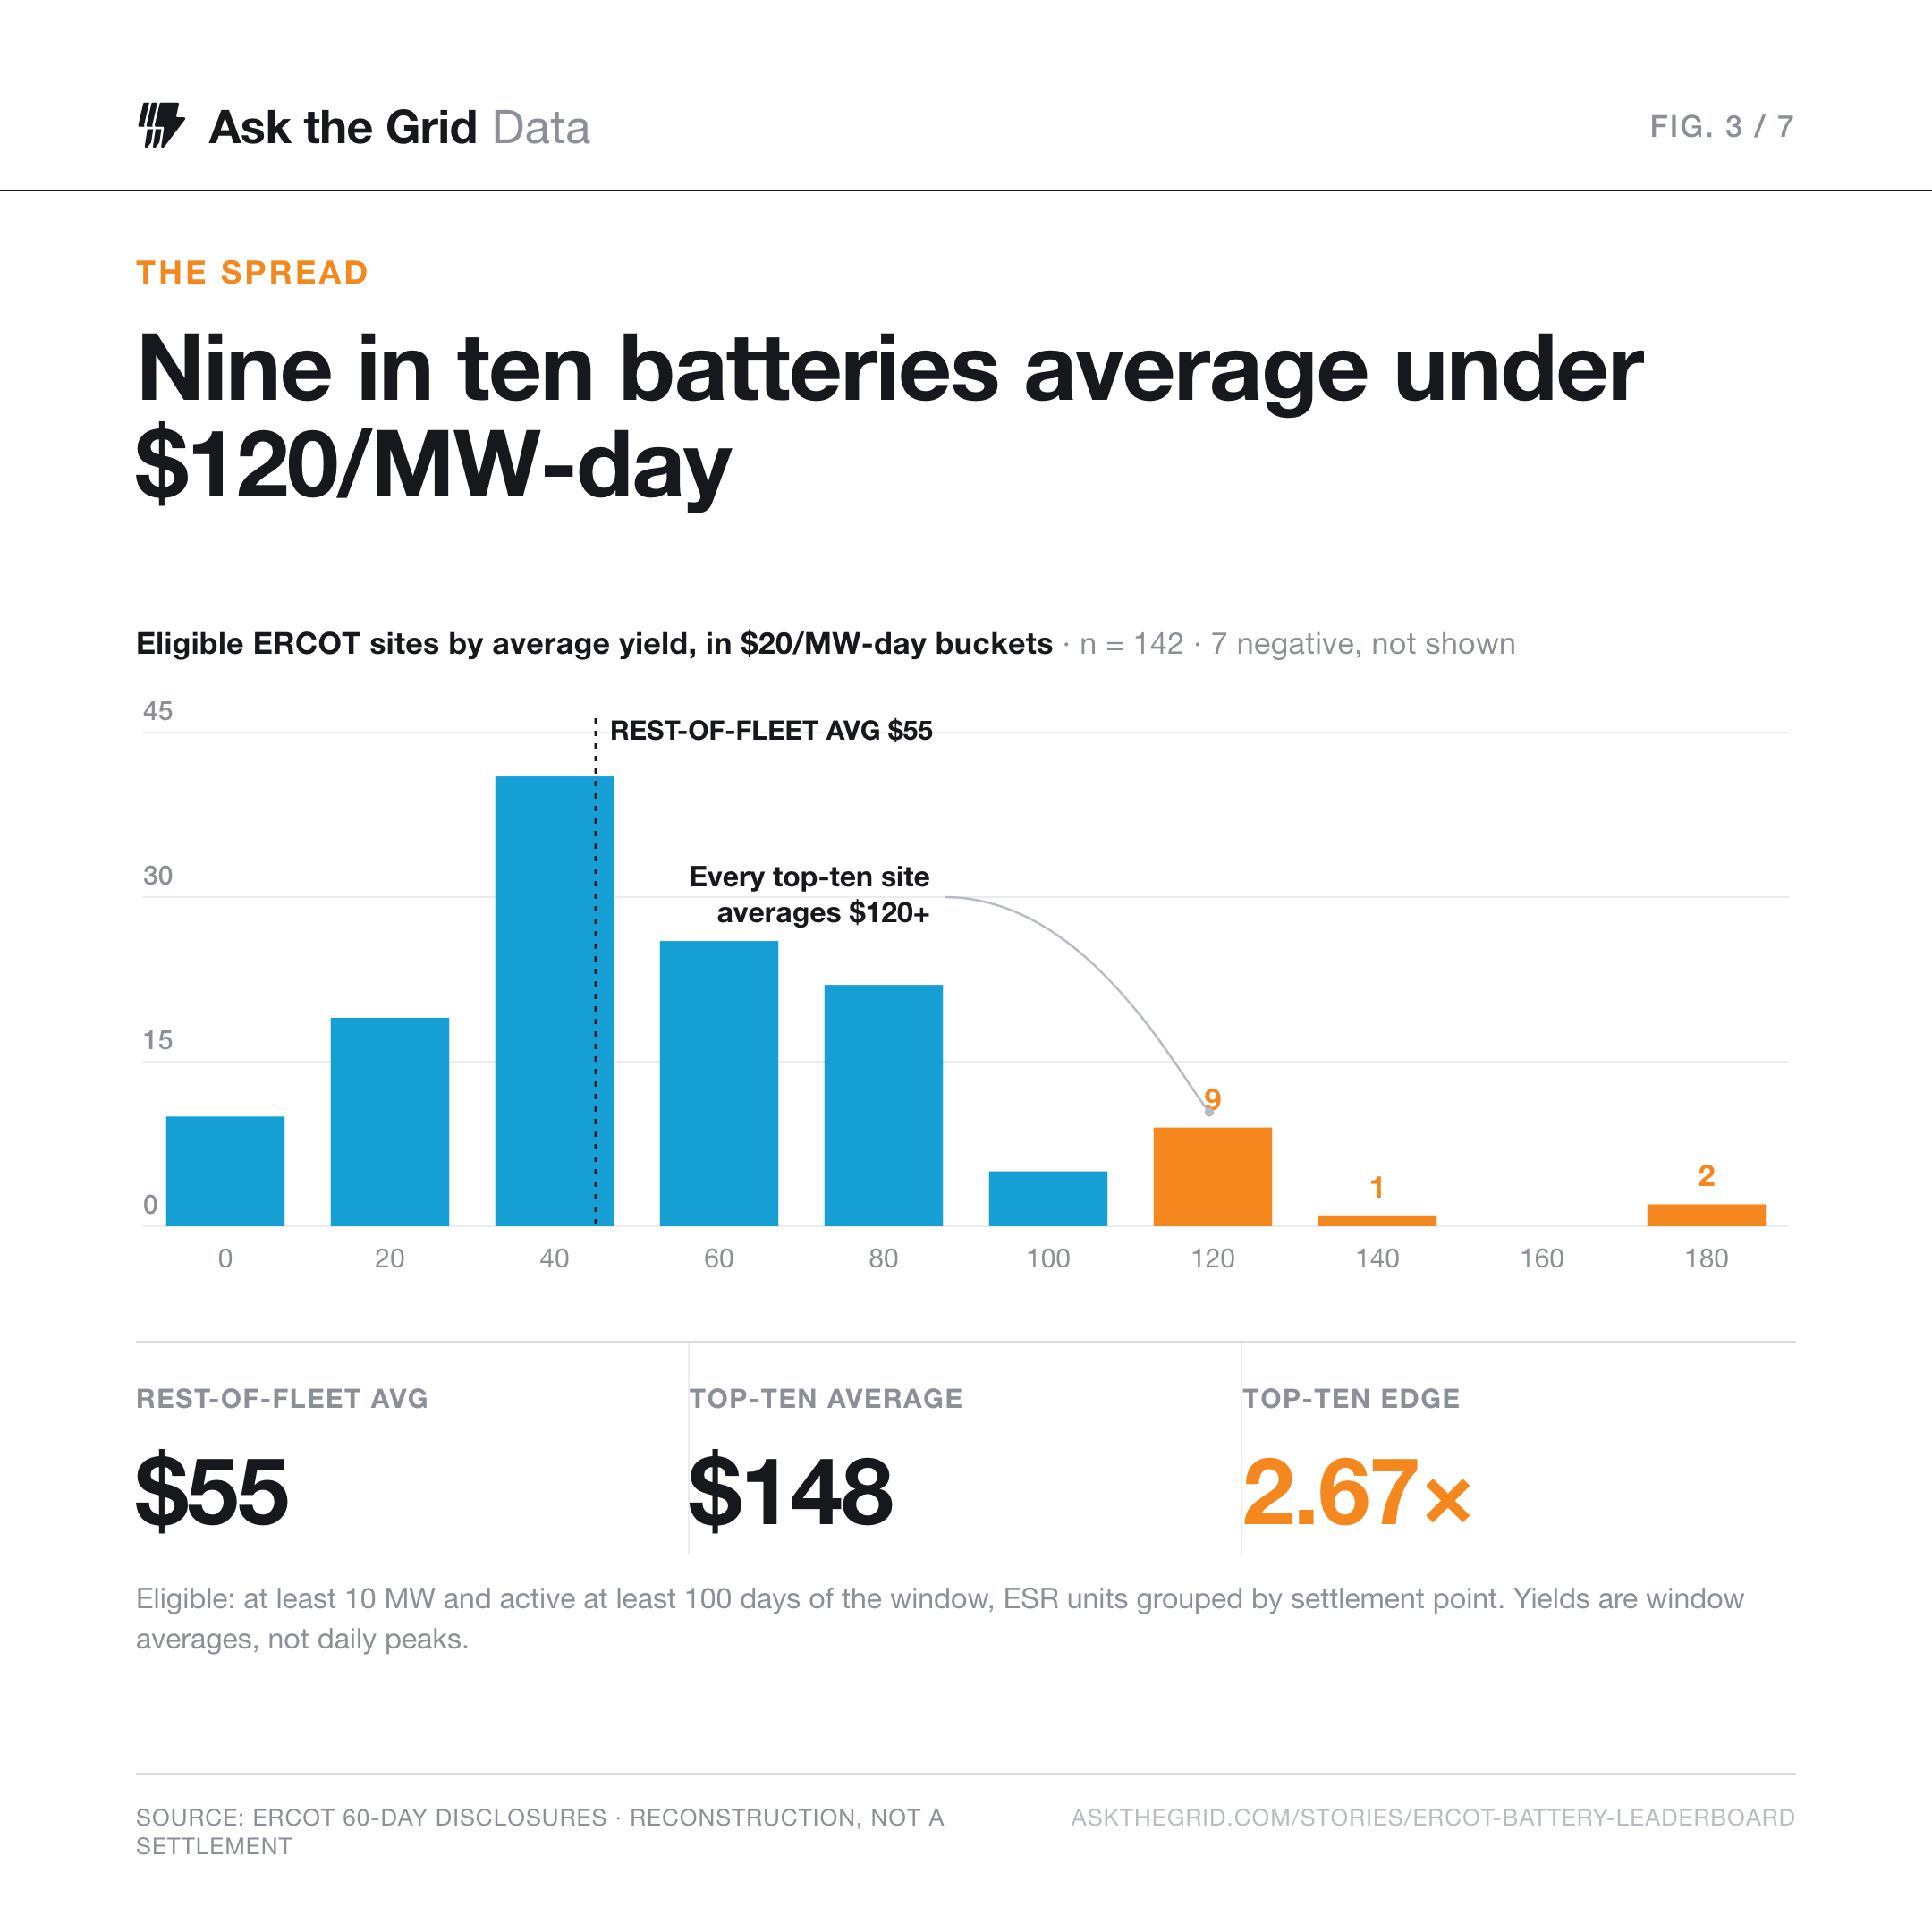
The gap between the top and the rest is the whole point. Across the 142 batteries that ran the full window, the field outside the top ten averaged about $55 per MW-day. The ten above averaged $148, a 2.67x edge over the field. Put the whole fleet in one picture and the shape is a fat middle around fifty to a hundred dollars and a thin, lonely tail past a hundred and twenty, where every one of the top ten lives.
That tail is not mostly hardware. Several sites outside the top ten are larger and newer than the ones on it. The evidence points to operating strategy, how a battery splits its capacity between reserves and energy and how hard it leans into the handful of hours that pay, working alongside nodal position, storage duration and availability. The clearest way to see it is to break each winner's revenue into where it actually came from.
Two ways to win#
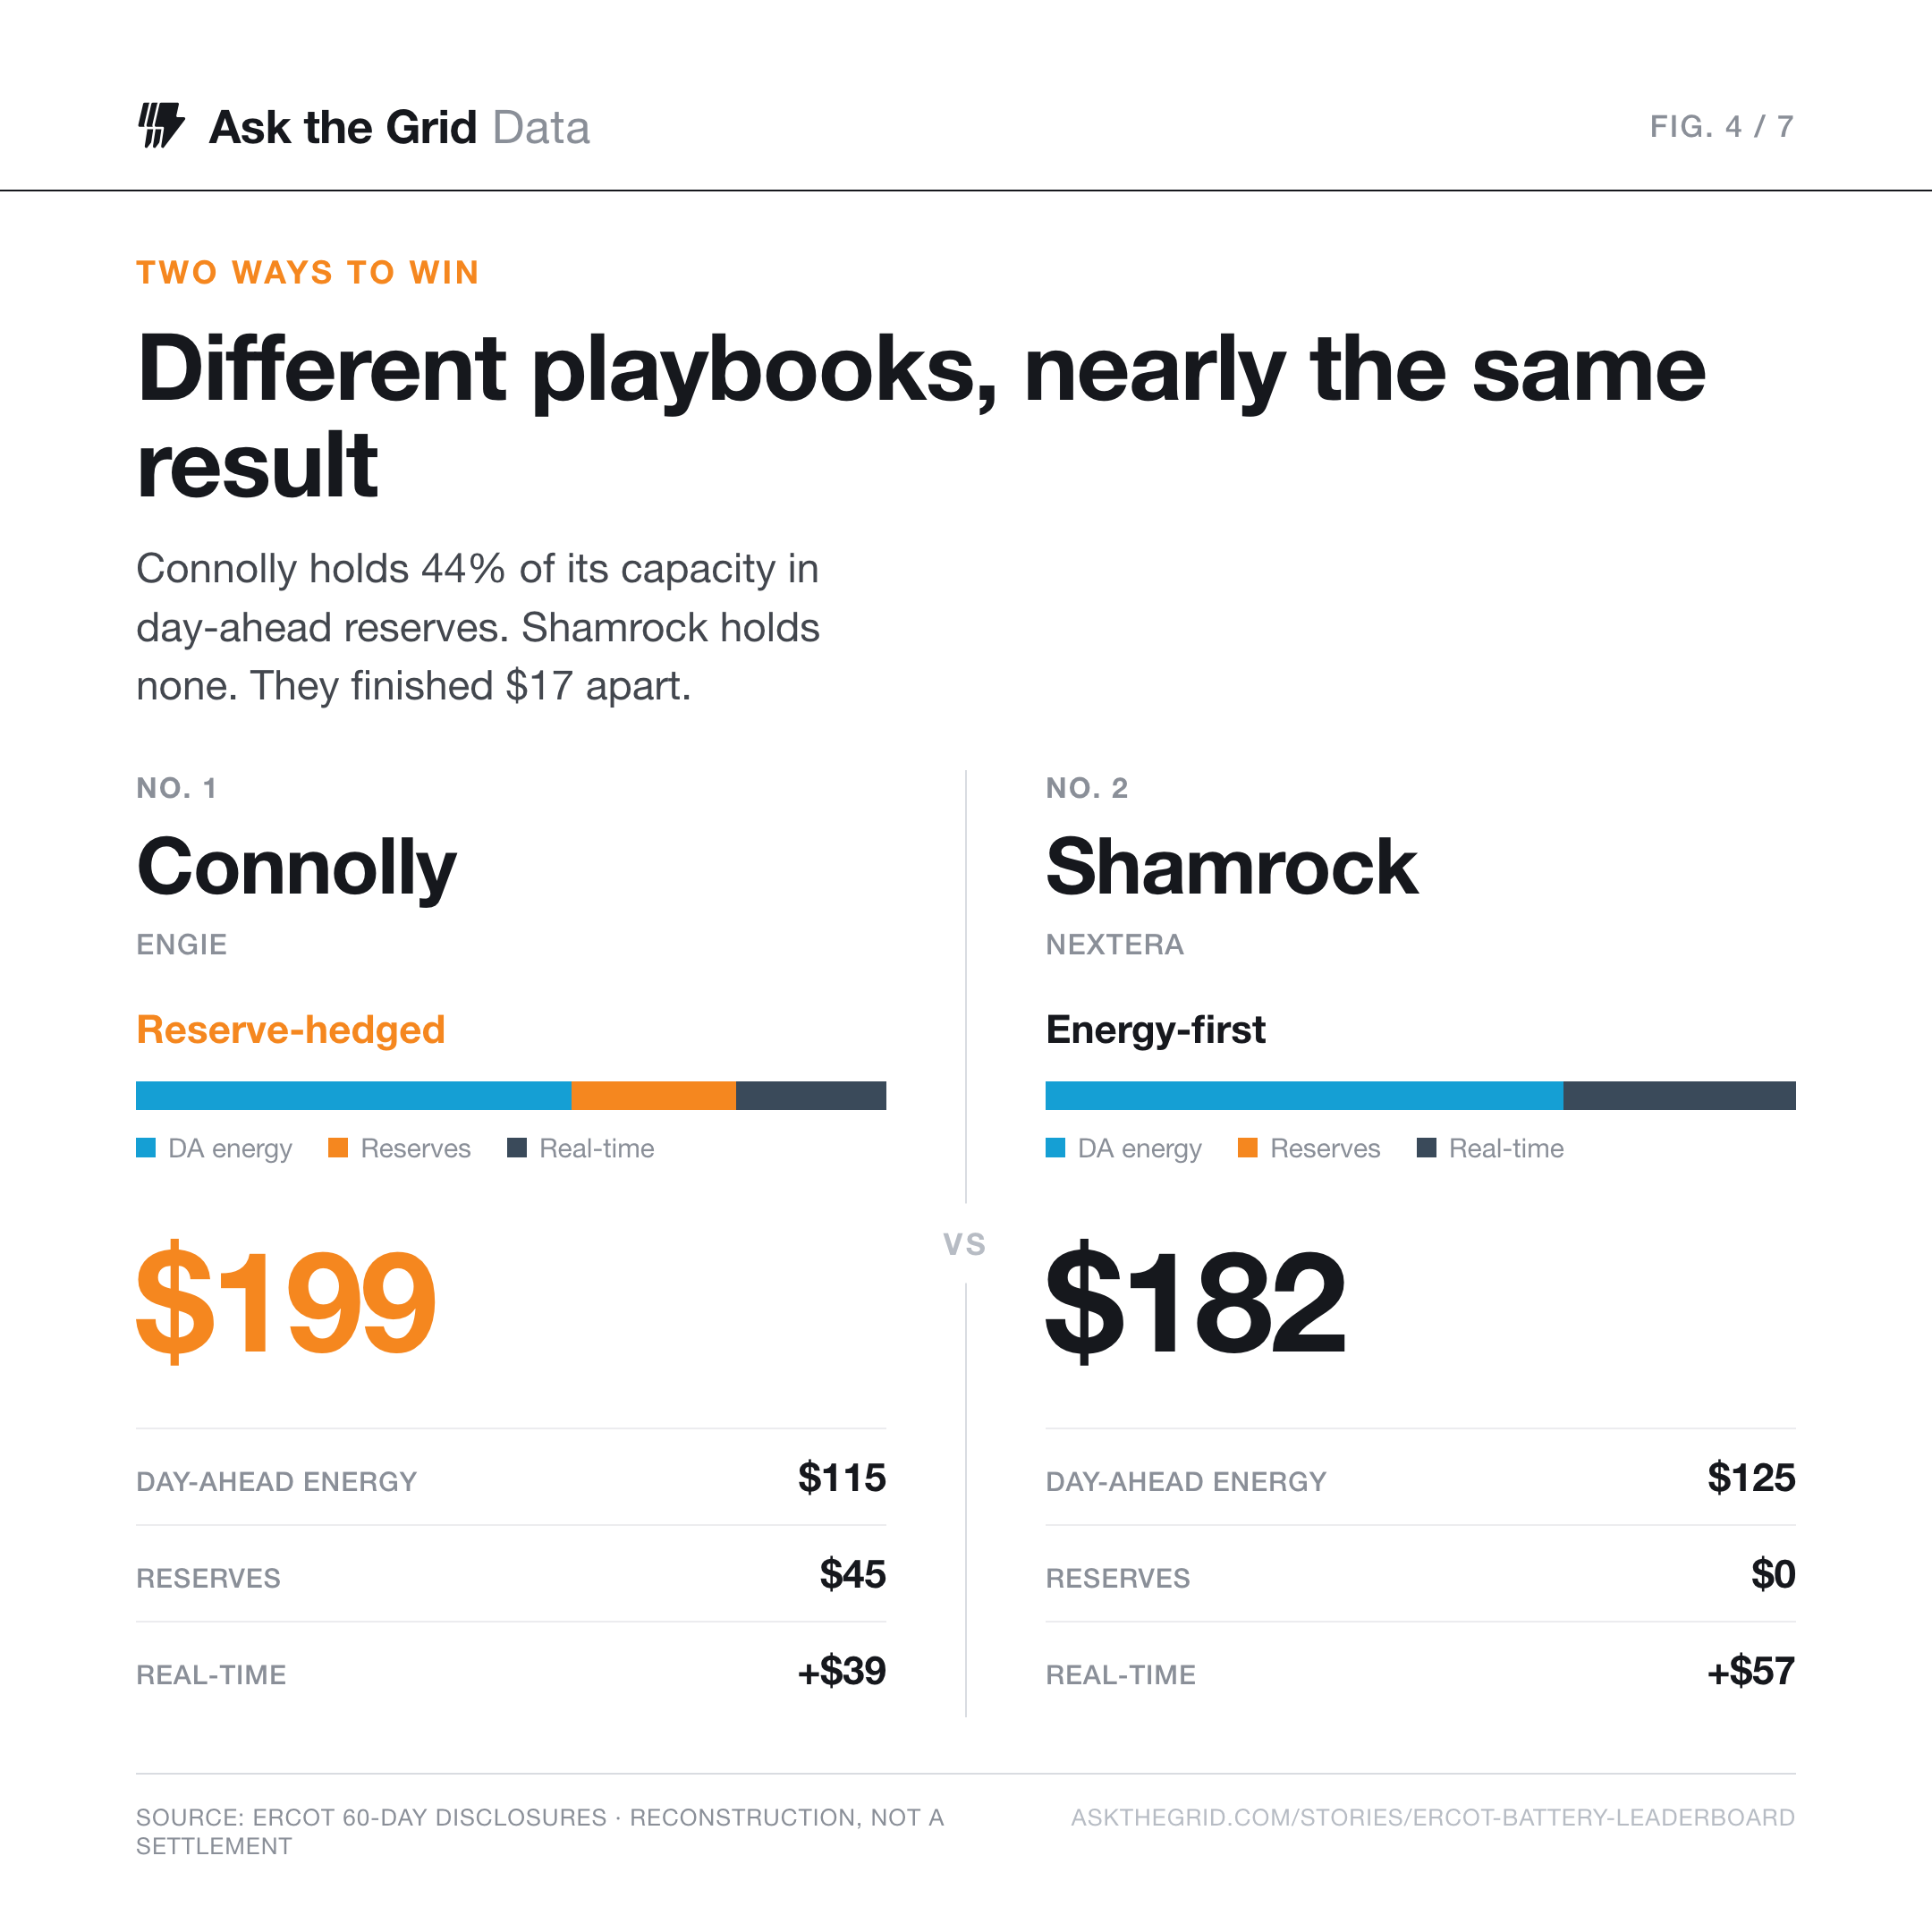
The market rewards two almost opposite playbooks, and the top of the board shows both. , scheduled by ENGIE, tops the list at $199/MW-day on a diversified book: day-ahead energy is its biggest line at $115/MW-day, but it also commits about 44 percent of its capacity to day-ahead reserves and adds $38/MW-day in real time. , a NextEra site, sits second at $182/MW-day with the opposite shape: zero day-ahead ancillary, pure energy, splitting $125/MW-day in the day-ahead market and $57 in real time. Same market, same five months, two philosophies, about seventeen dollars apart.
Read down the board and the split is almost tribal. NextEra runs its three sites, Shamrock, Roadrunner and Inertia West, as a pure merchant energy desk: no day-ahead ancillary at all, the biggest real-time lines on the board (Inertia books $81/MW-day in real time), betting the whole book on catching price swings. ENGIE, working the former Broad Reach Power fleet, does the opposite, parking roughly 44 percent of Connolly, Antlia and Avila into day-ahead reserves and collecting the steady capacity payment as a hedge. Neither is obviously right; both land in the top ten. What separates the winners from the field is not which playbook they run but how cleanly they run it.
The one clear way to lose is bad real-time timing, and duration is the tell. , at number six, is the shortest-duration site on the board at barely two hours of storage, and it swings the hardest: it booked the board's highest day-ahead energy at $168/MW-day, then handed back $72/MW-day in real time as its output ran the wrong way against a moving price. A short battery has to make concentrated bets, and when a bet misses, the co-optimized engine settles it in the next five-minute interval. Its day-ahead position was the only thing that kept it in the top ten.
The steel is a commodity#
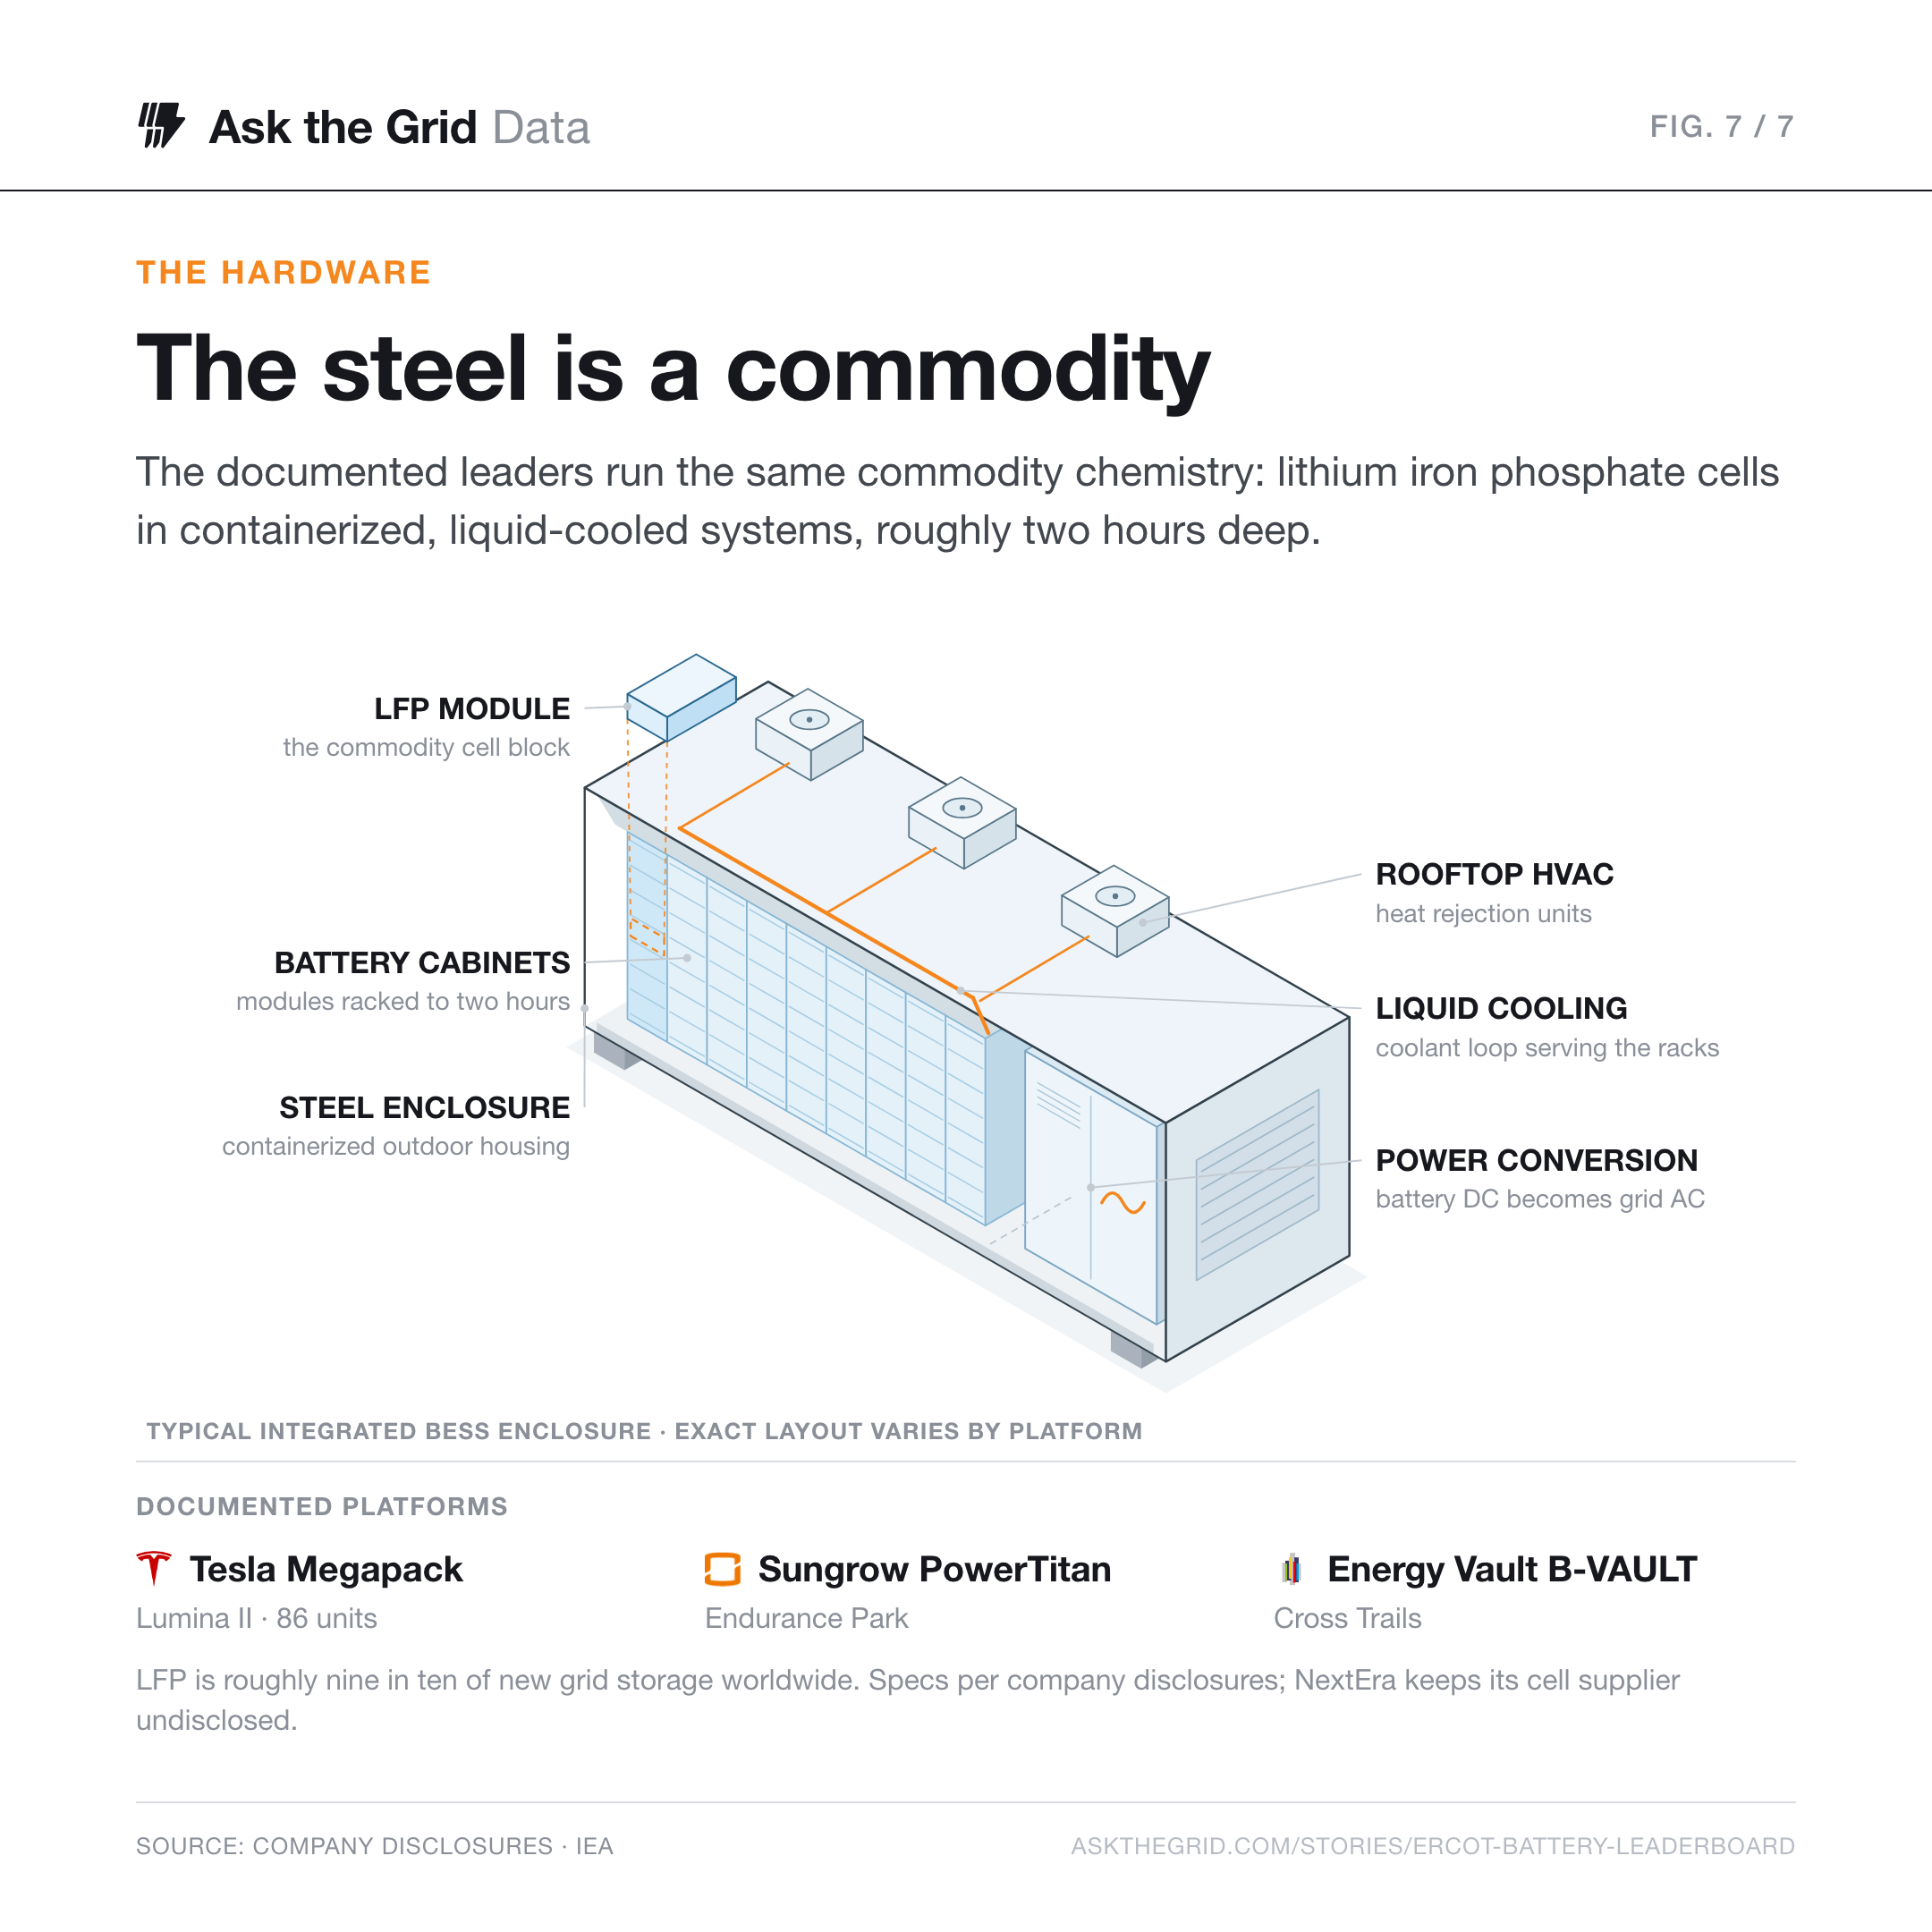
If the edge is not hardware, it helps to see how little the hardware actually varies. Where the batteries are documented, the cell is the same commodity. runs 86 Tesla Megapacks; Key Capture's Endurance Park runs Sungrow's PowerTitan; Cross Trails is Energy Vault's own second-generation B-VAULT AC platform. All three are lithium iron phosphate, all liquid-cooled, all roughly two-hour systems, and LFP now takes something like nine in ten of new grid-storage deployments worldwide while higher-density NMC has all but left the grid. The cell is a global commodity, and every serious operator is buying the same one.
The tell is the sites that disclose nothing. NextEra builds through the contractor Ryan Companies, whose public project pages show Shamrock's 93 battery containers and Inertia's 24 containers with four integrated inverters, but never whose cells sit inside them. When the most effective merchant operator on the board treats its battery supplier as a secret, that is a signal the supplier is not the moat.
The one piece of hardware that does shape the outcome is duration, and even it does not decide the ranking. The fleet has standardized on two to three hours as ERCOT's money moved from ancillary services toward energy arbitrage. But plot each site's storage duration against its yield and there is no line to draw.
That is the thesis in a single chart. With the chemistry converged and the duration set, what a battery earns comes down to how it is run. The honest caveat: the hardware levers that could still move the number, round-trip efficiency, cell augmentation and parasitic load, are not disclosed for any of these sites, so the hardware question cannot be fully retired. What the record does show is that the visible steel is the same across the board, and the results are not.
Where they sit#
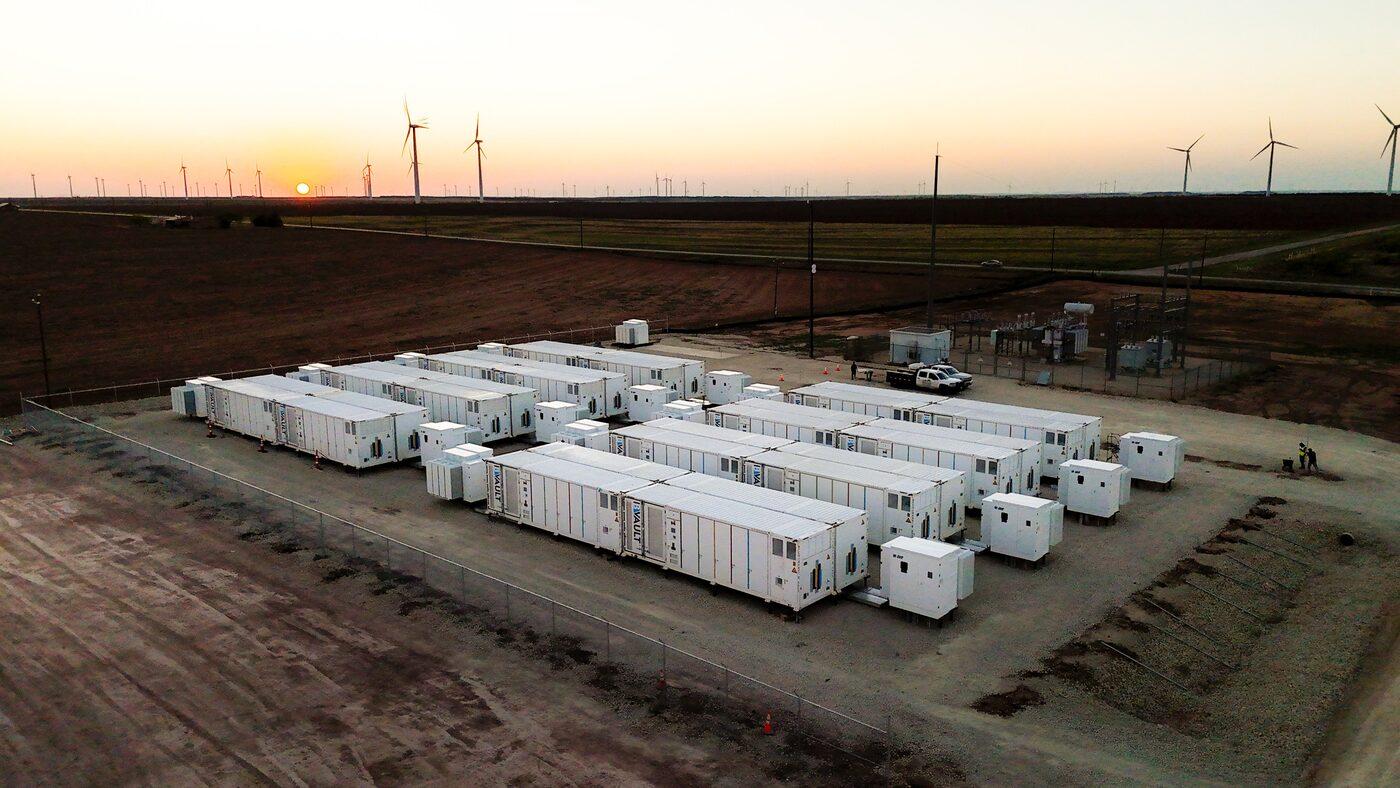
Most of the top of the board is out in West and North Texas, clustered around the wind and solar build-out. That is not a coincidence: the widest, most frequent intraday price swings, the raw material a battery arbitrages, are largest where variable generation is thickest and the transmission out is tightest. From above, the sites are unglamorous, a gravel pad of battery containers wired into a substation, dropped into ranchland or a cotton field. Four of the top ten are below in public-domain USDA NAIP aerials; click any to open it on the live map.
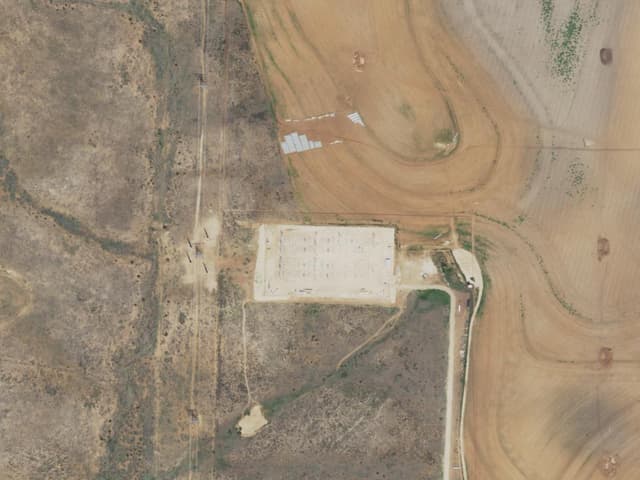
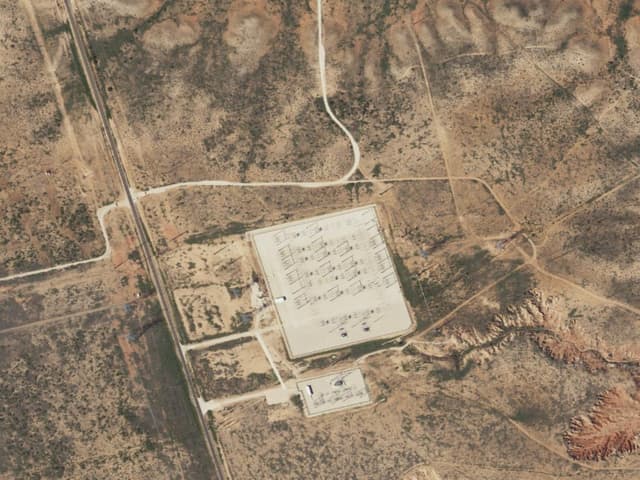
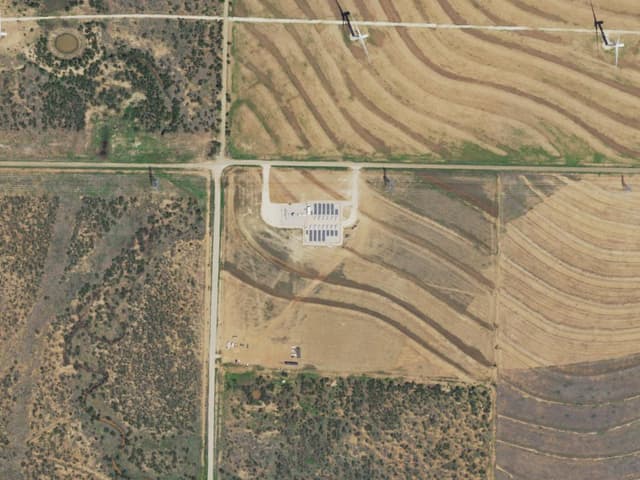
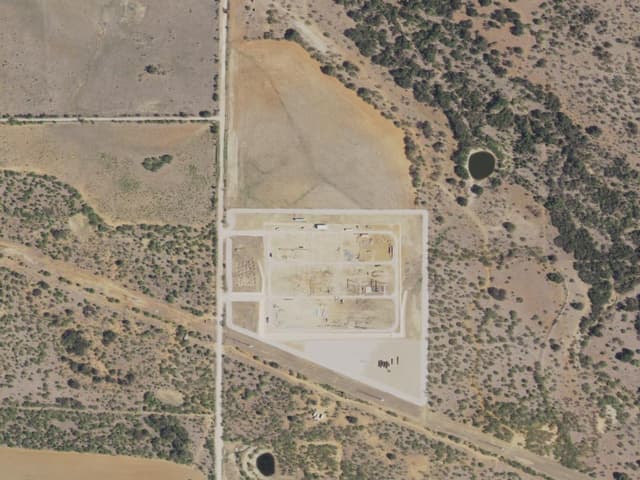
Open the map, scrub the stress day, and inspect any settlement point to see the price a battery there was actually working.
The edge concentrates on stress days#
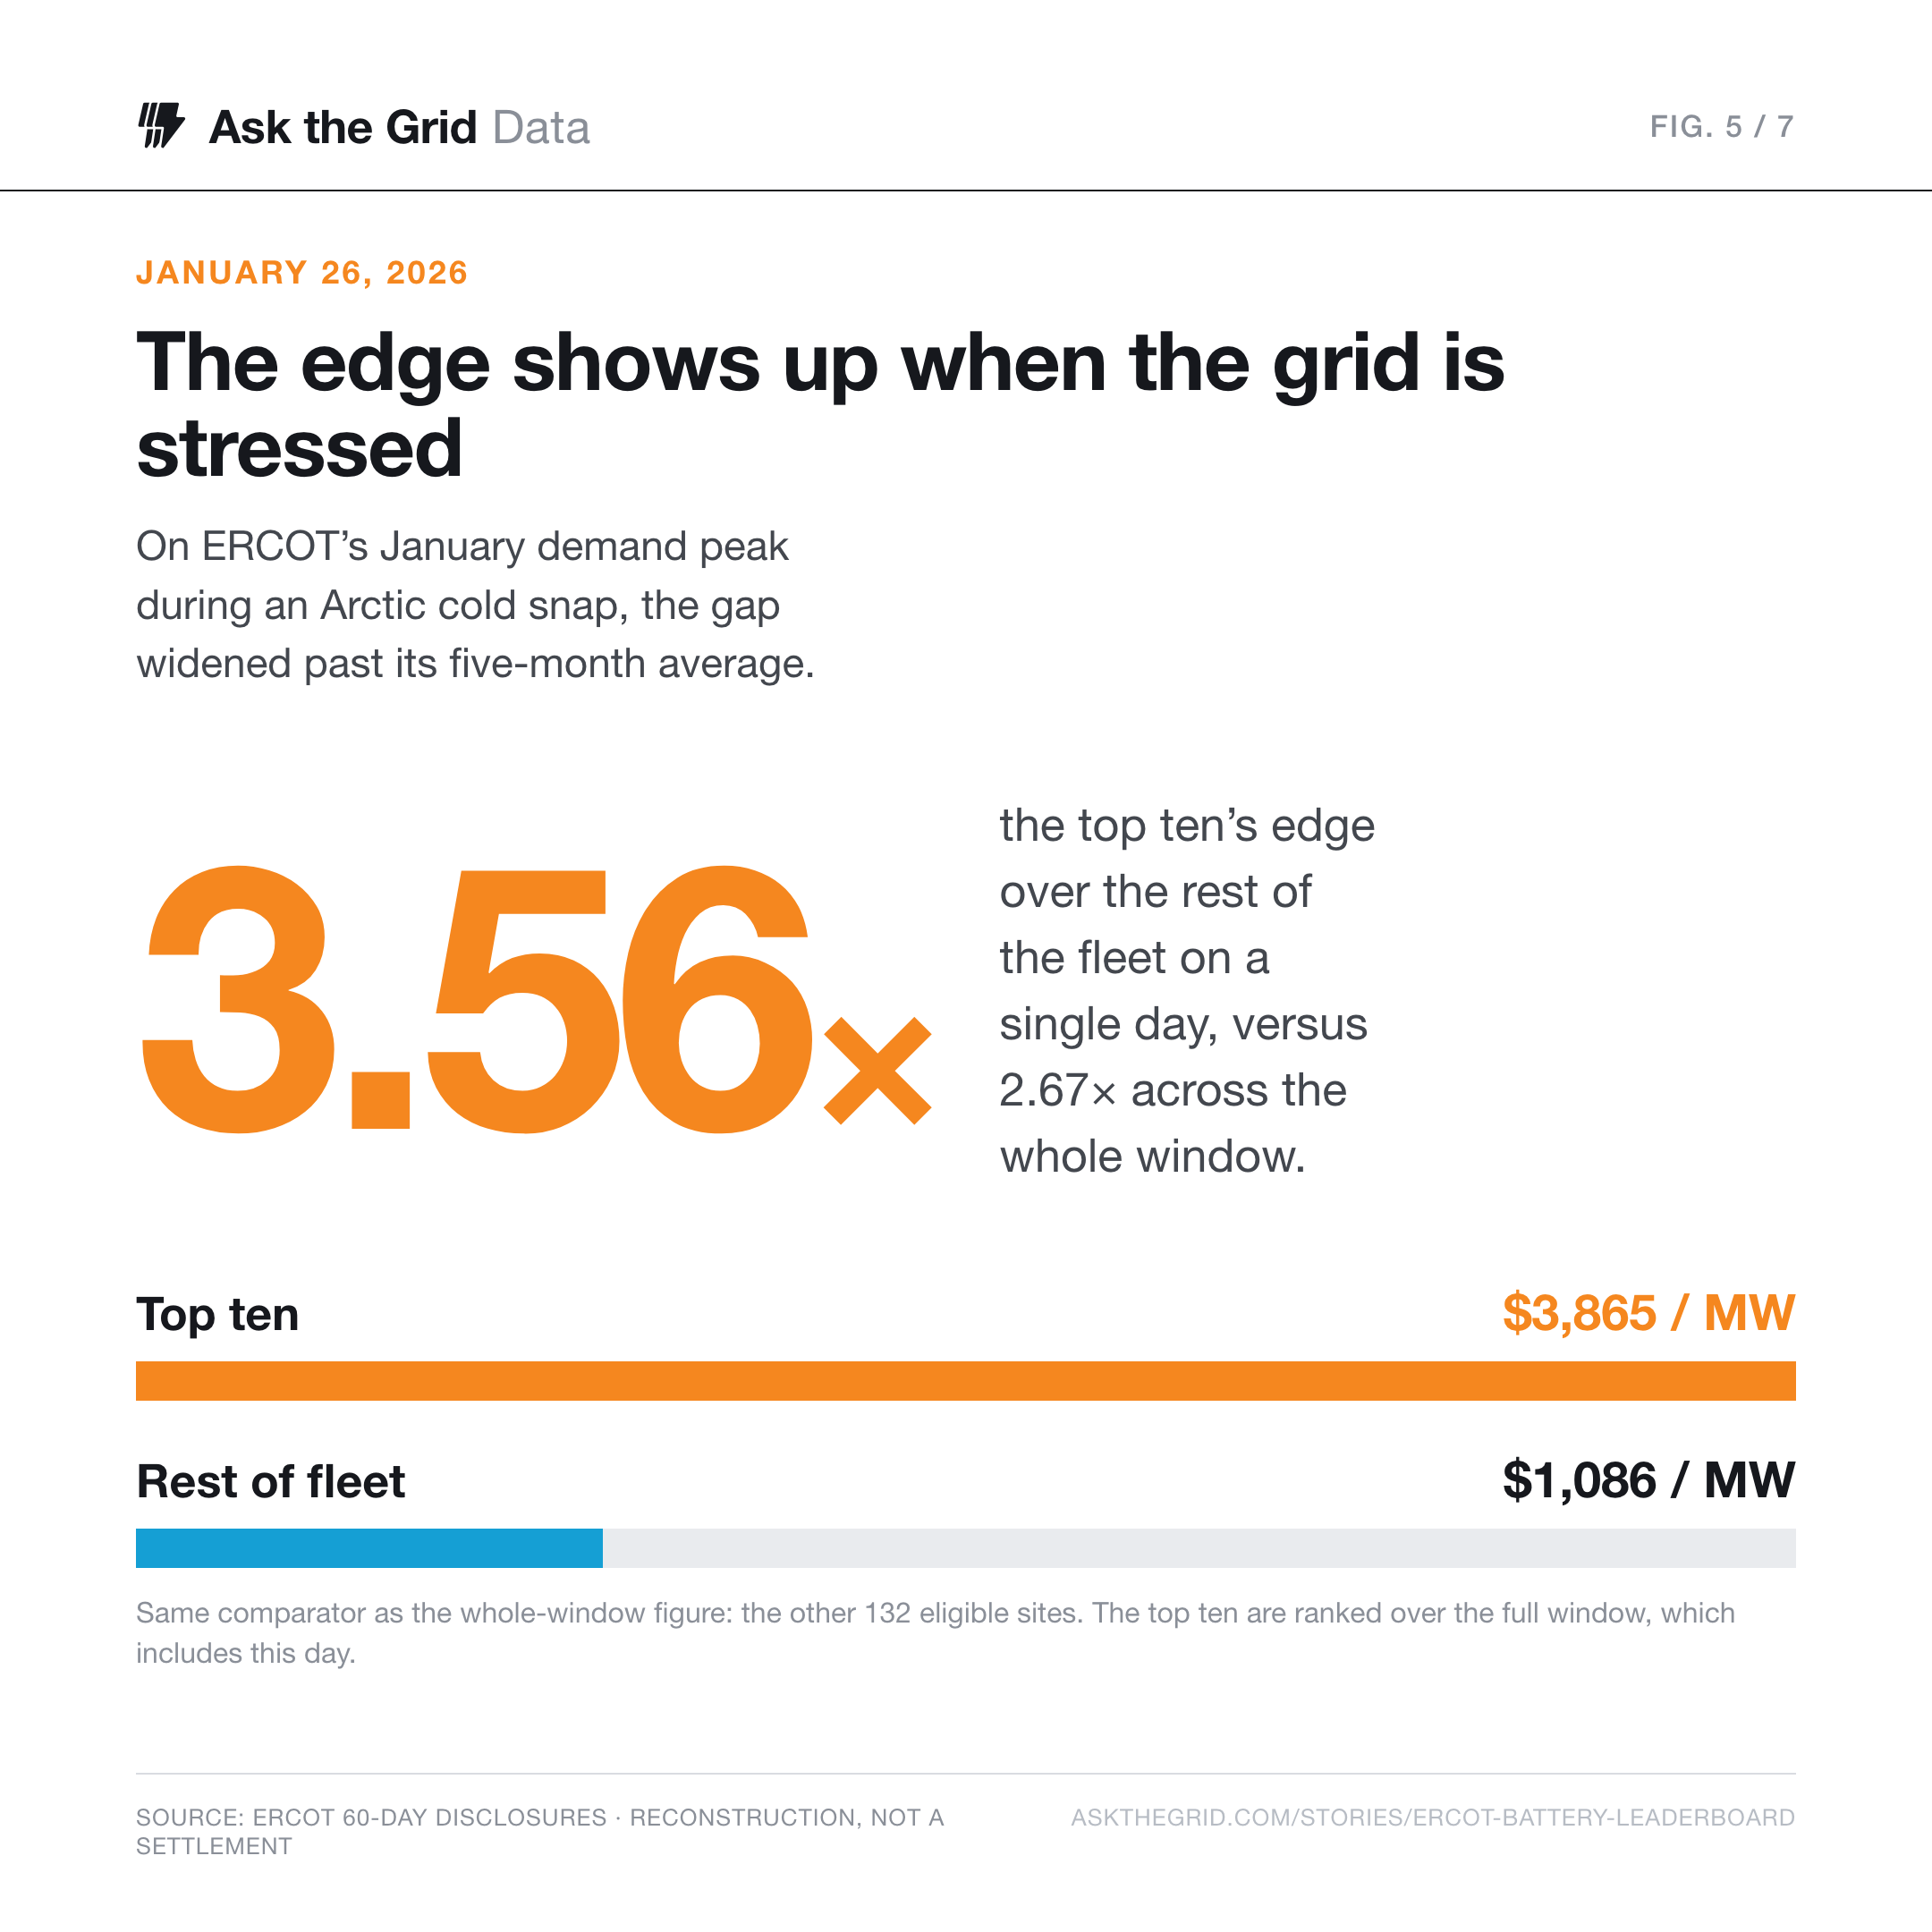
The advantage is not spread evenly across the calendar. It concentrates on the days the grid is under stress. On January 26, 2026, ERCOT's January demand peak during an Arctic cold snap, the top ten earned about $3,865 per MW against $1,086 for the rest of the fleet, a 3.56x edge on a single day, wider than their 2.67x edge across the whole window. The honest caveat: the top ten are ranked over a window that includes this day, so read the single-day gap as how the leaders made their money, not an independent test of the ranking. It was a cold-driven demand peak rather than a systemwide scarcity emergency, but it is exactly the kind of day a co-optimized market pays the most and asks the most, and the top of this board is positioned for it.
Who runs the board#
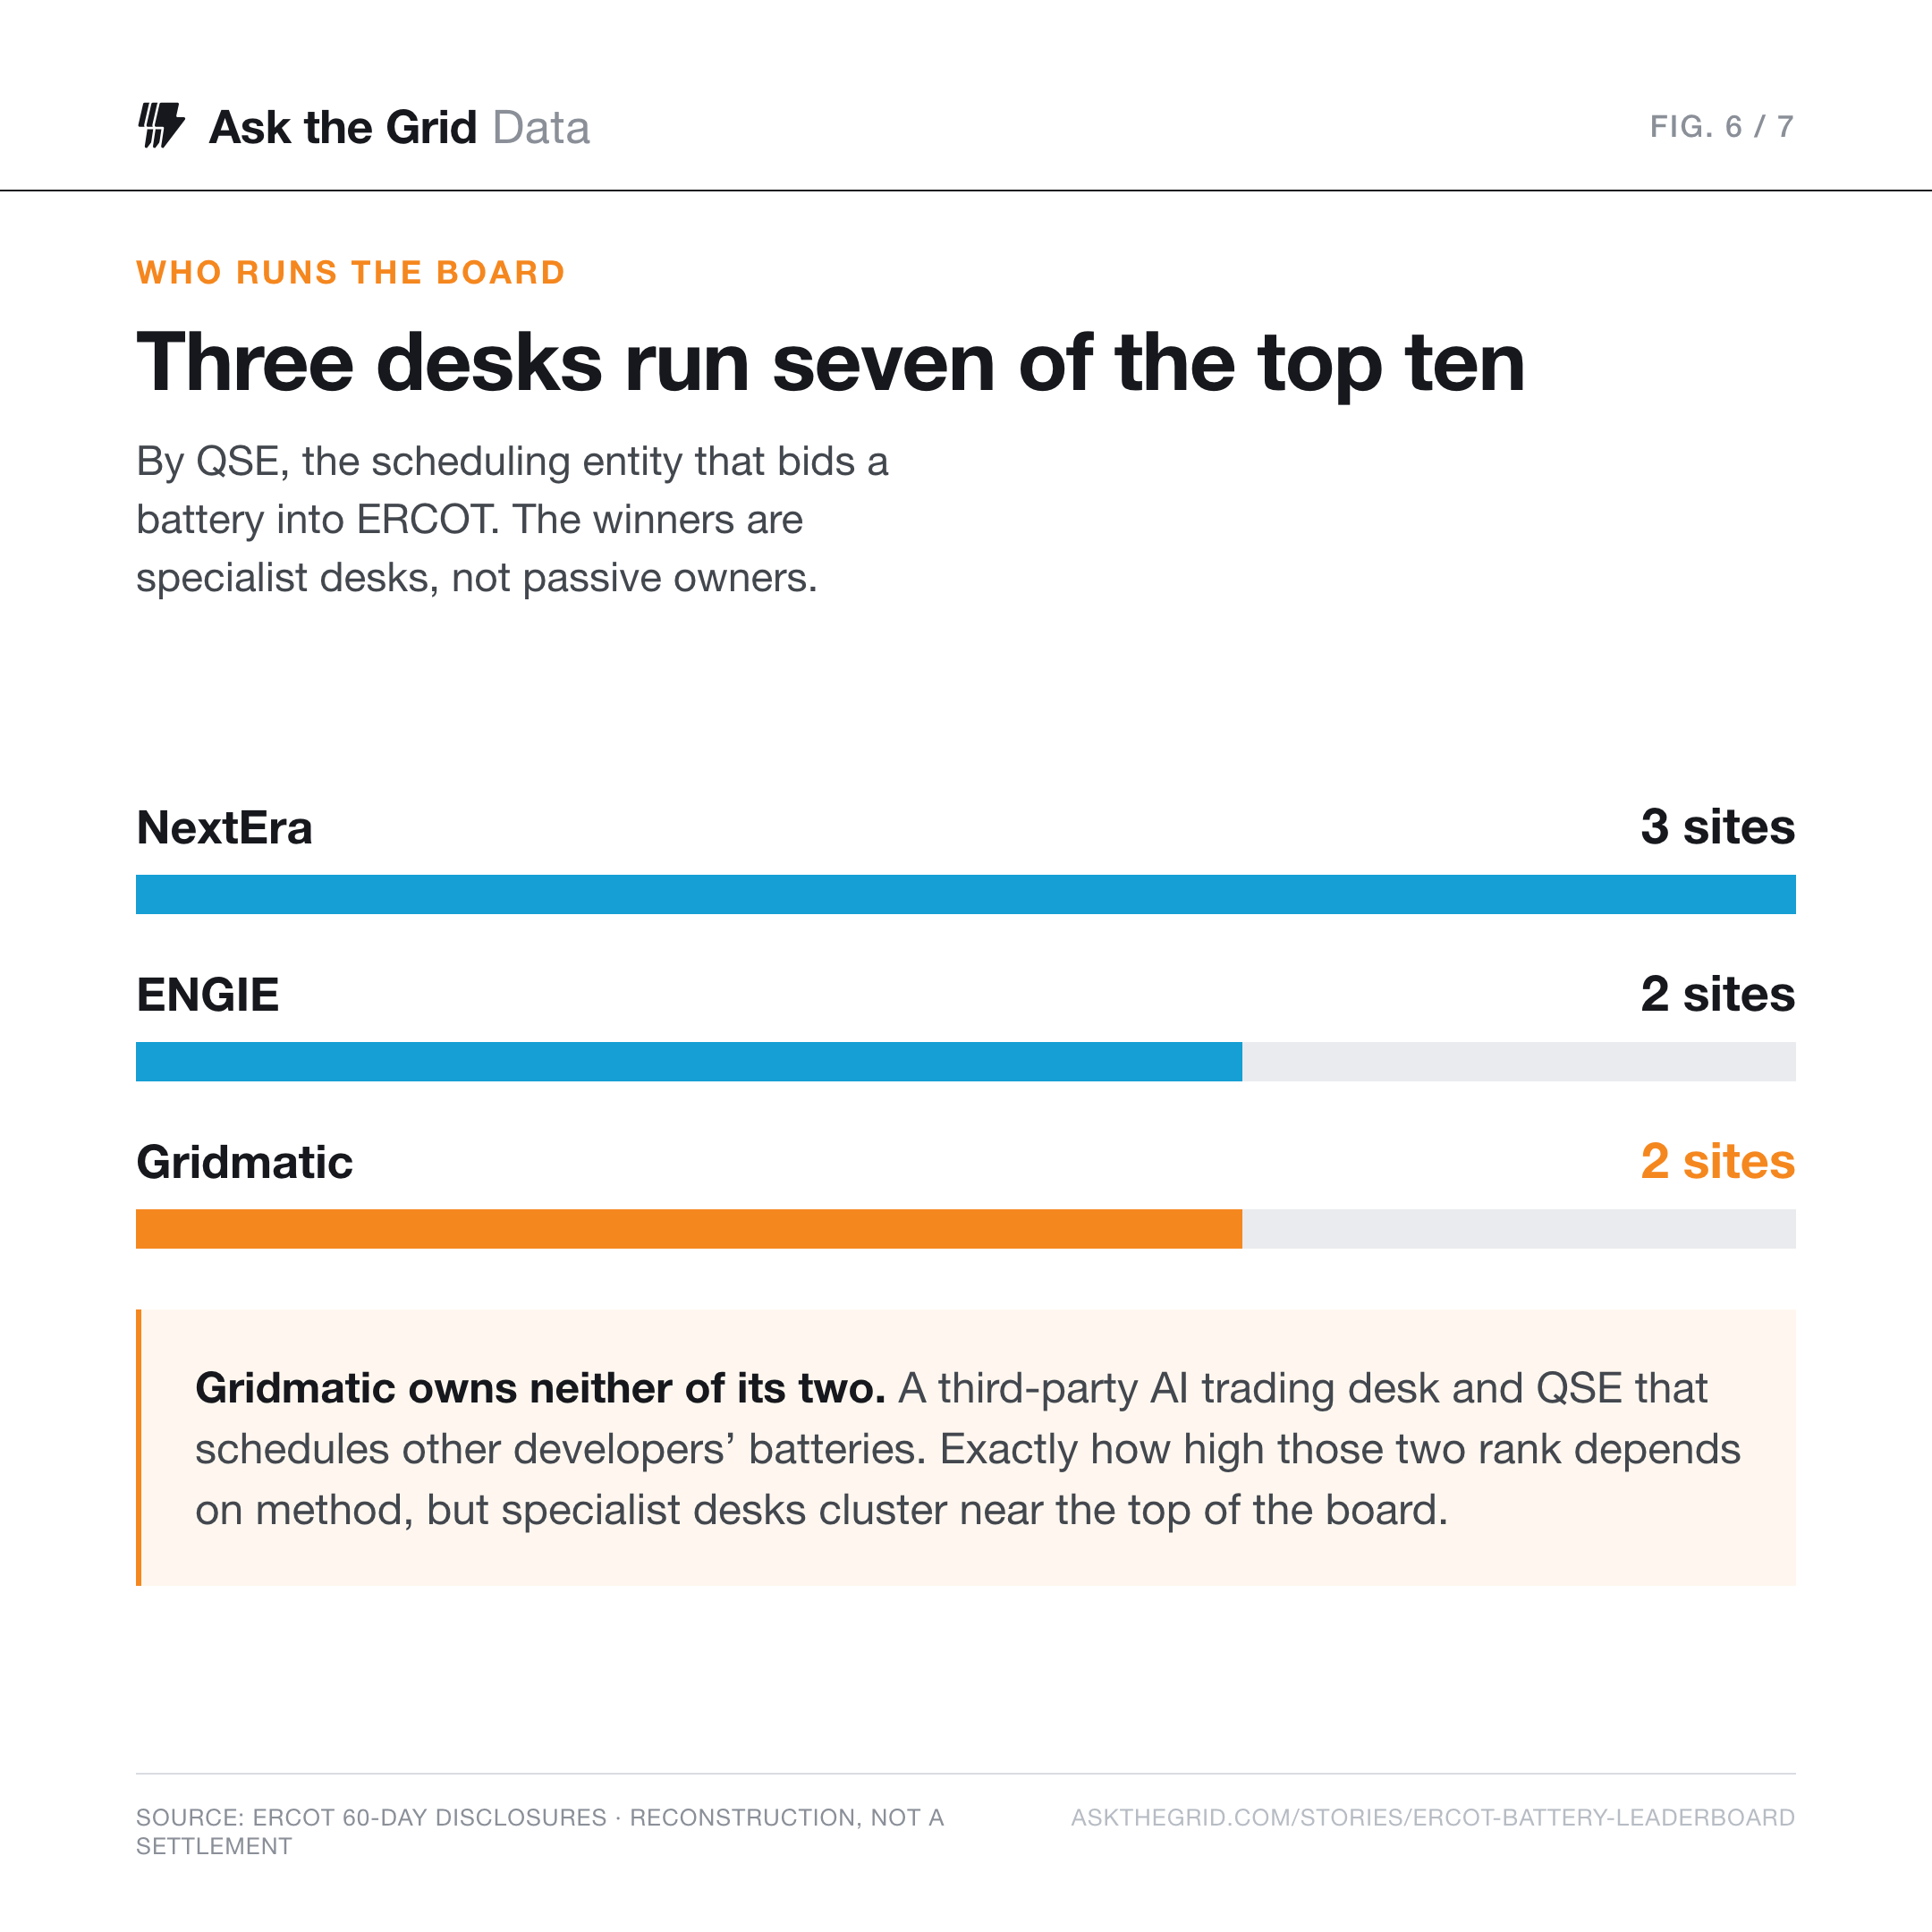
Read the ranking by scheduler and the winners are not household utilities; they are the storage desks and QSEs that specialize in this. By QSE, NextEra schedules three of the top ten and ENGIE two (Connolly and Antlia, from the Broad Reach Power fleet it acquired). The more interesting name is Gridmatic, which schedules two more, and . Gridmatic owns neither: Endurance Park is Key Capture Energy's asset and Cross Trails is Energy Vault's. Gridmatic is a third-party optimizer, an AI trading desk that runs other developers' batteries. How high those two sites rank is method-sensitive: our by-settlement-point reconstruction puts them in the top ten, while an independent board that ranks individual units and normalizes by active days places them nearer the twenties. Under either method, specialist optimizers show up out of proportion to the batteries they own. Read that as a correlation the board points to, not a law it proves: as the market gets more complex, the edge looks less like who owns the steel and more like who runs the algorithm.
IPX Power, the independent producer that absorbed Intersect's Texas fleet after Google's March 2026 acquisition, self-schedules Lumina II, though its dispatch runs on Tesla's Autobidder; Aypa Power's Borden County trades through the TRQ desk; and the new entrant, Key Capture Energy's Hummingbird project up in Denton County, cracked the top ten in its first full window under a different scheduler than its other site. These are scheduling and registered-entity roles, not beneficial ownership: the QSE submits the offers, the Owner RE is ERCOT's registered Resource Entity, and who ultimately owns each project is a separate question this board does not settle.
The market is five months old and the ranking will move. What it already shows is that co-optimization did what it was designed to do: it made battery operating strategy a bigger part of what decides who earns, and it made the difference legible in public data. Everything above is built from ERCOT's own disclosures, the same feeds behind Ask the Grid. Open ERCOT on the main map to find these sites live.