The Day PJM Broke Its Demand Record
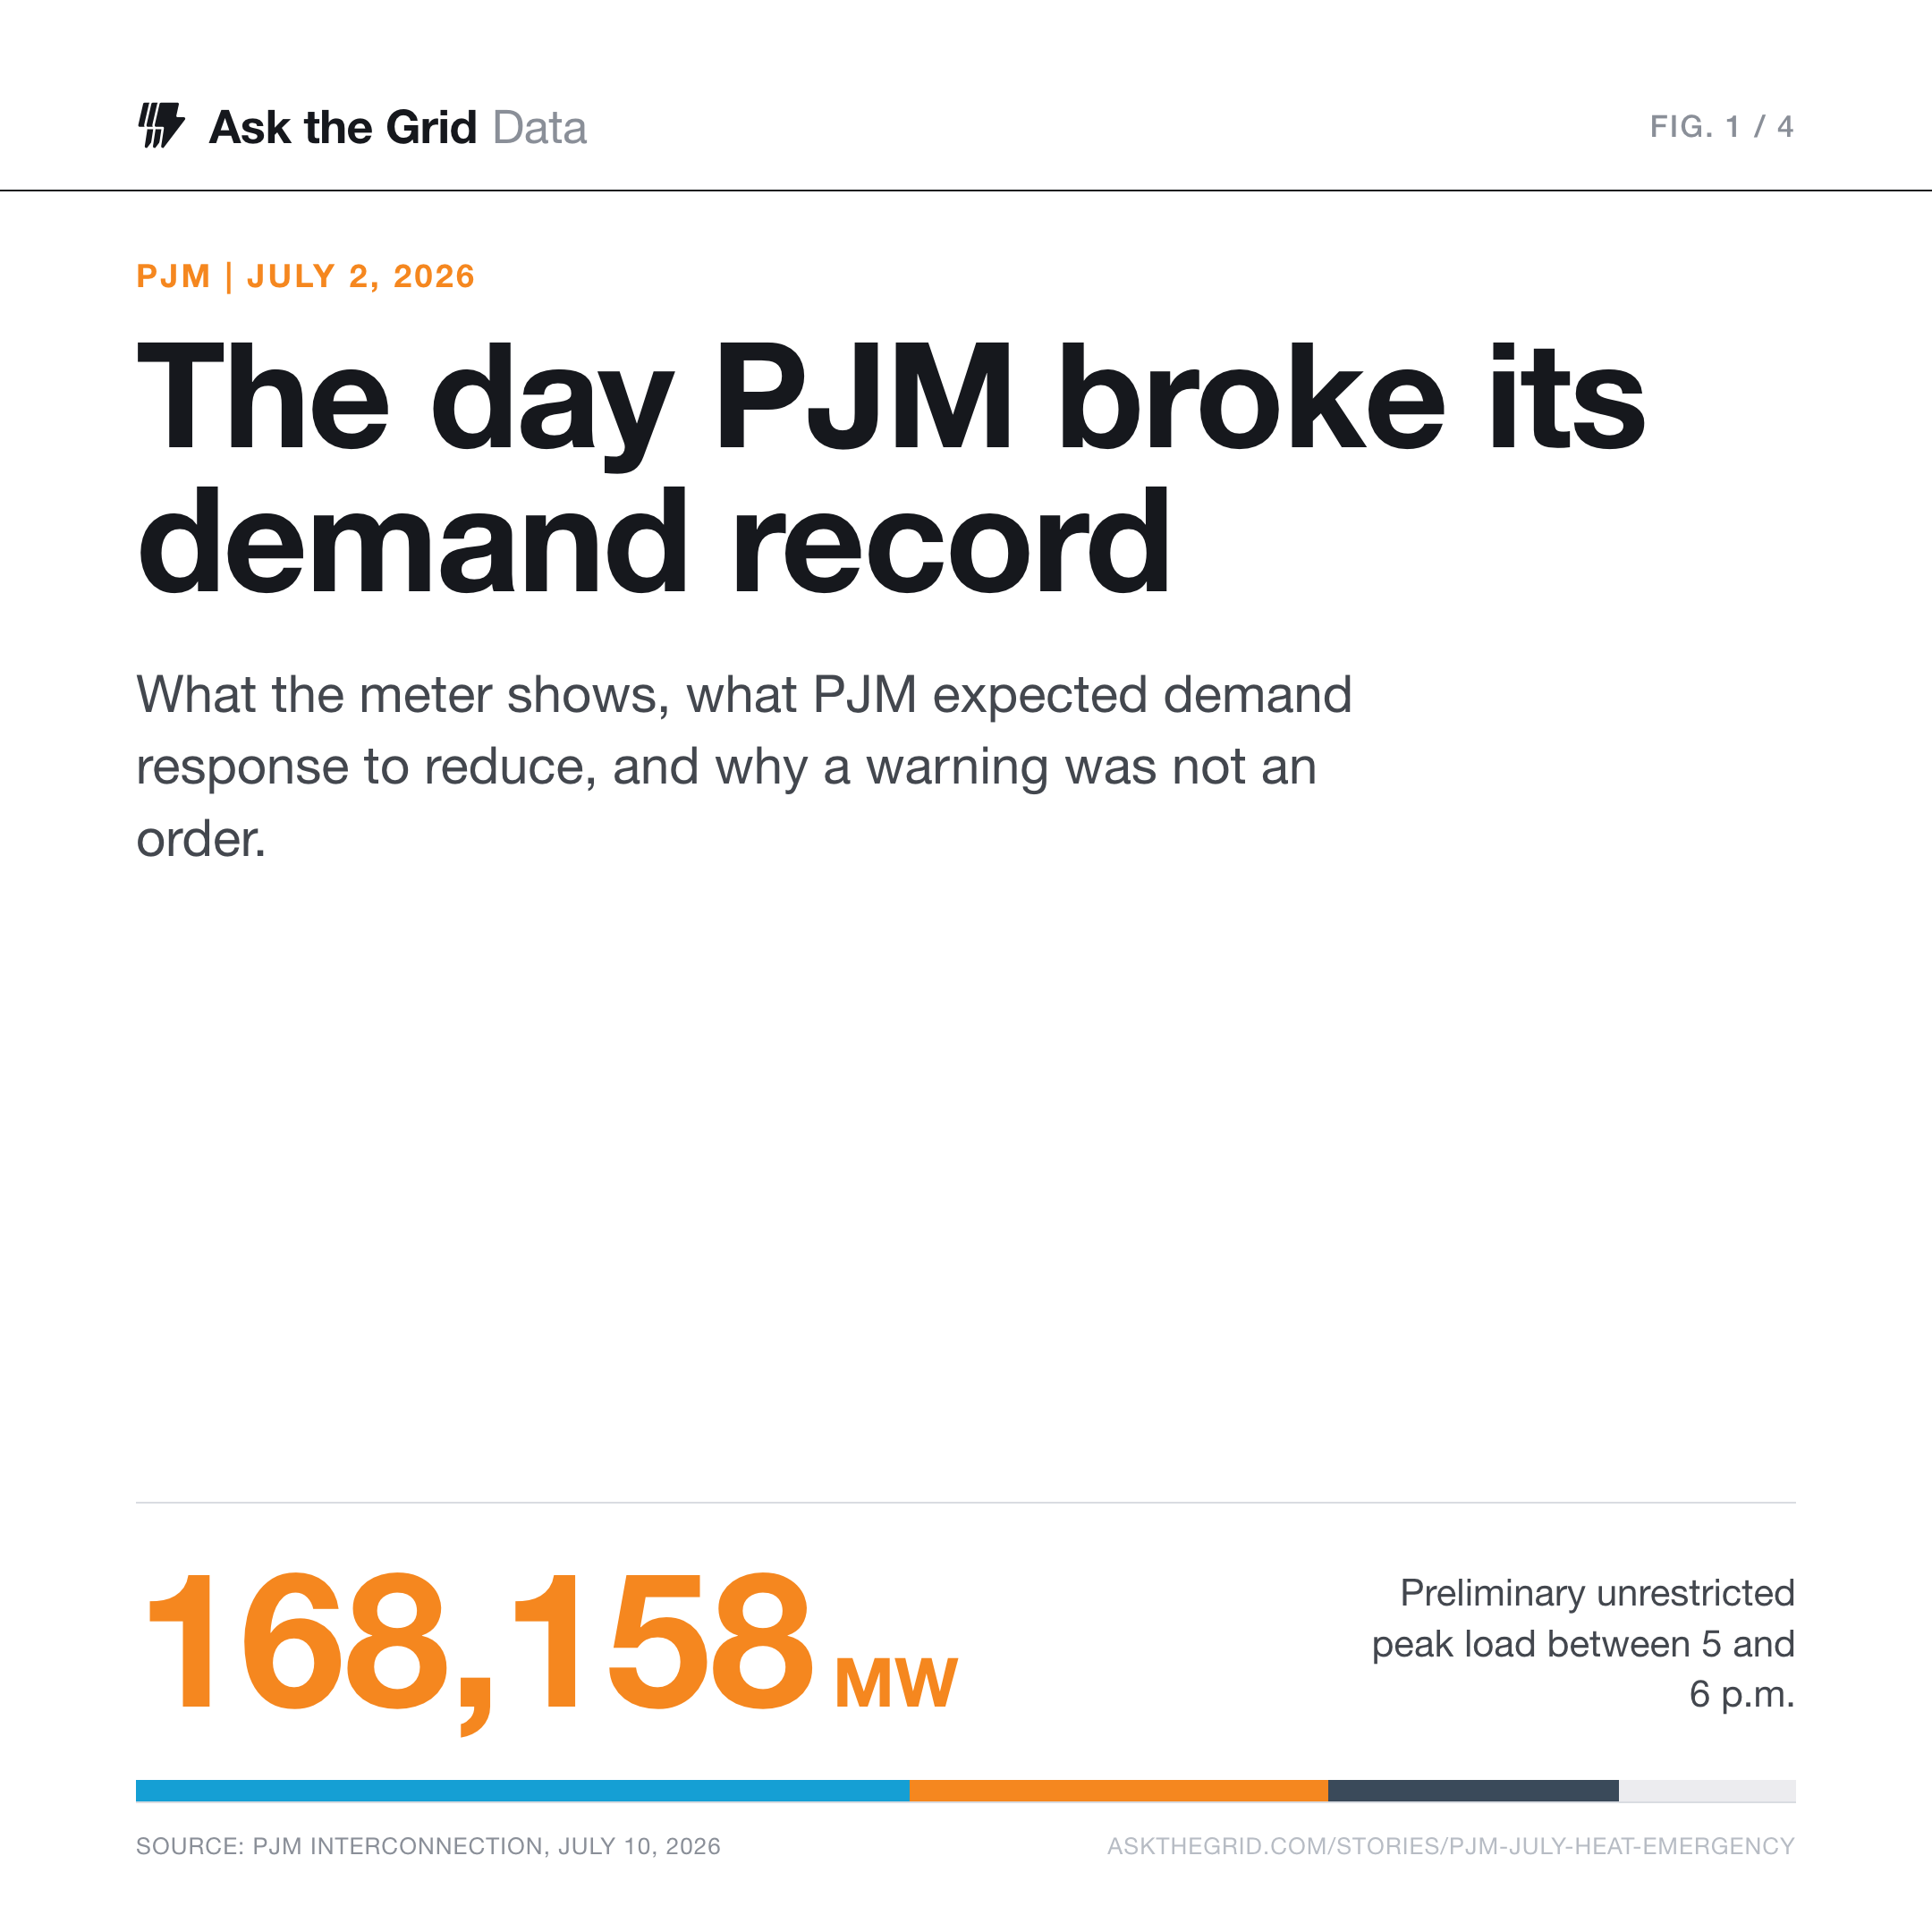
July 2, 2026. Extreme heat pushed preliminary unrestricted demand to 168,158 MW. Demand response, available generation, and federal permit relief helped PJM maintain reliability; separate backup authority for large loads was never activated.
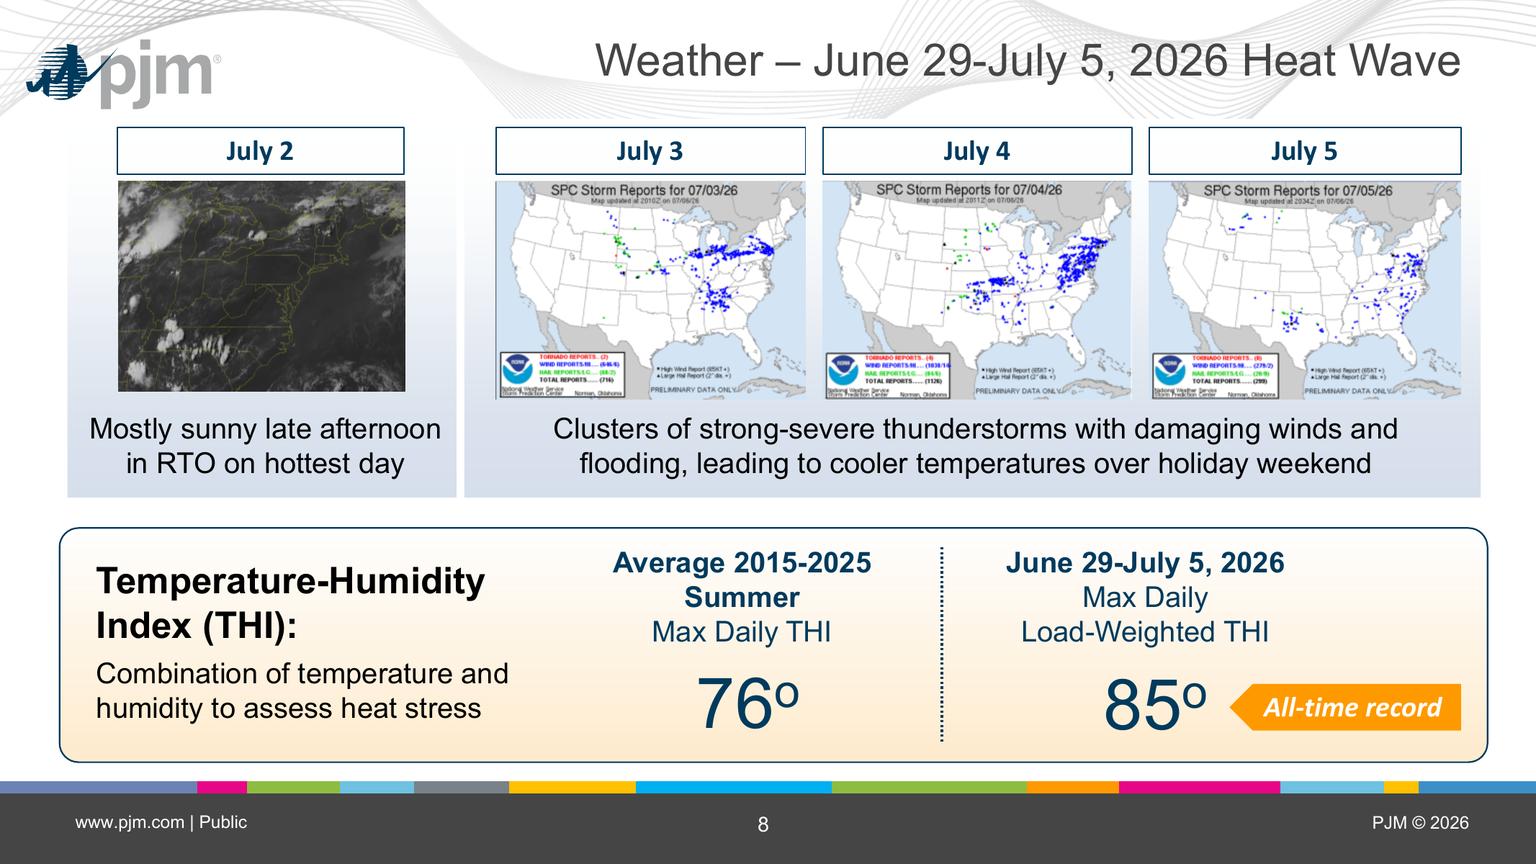
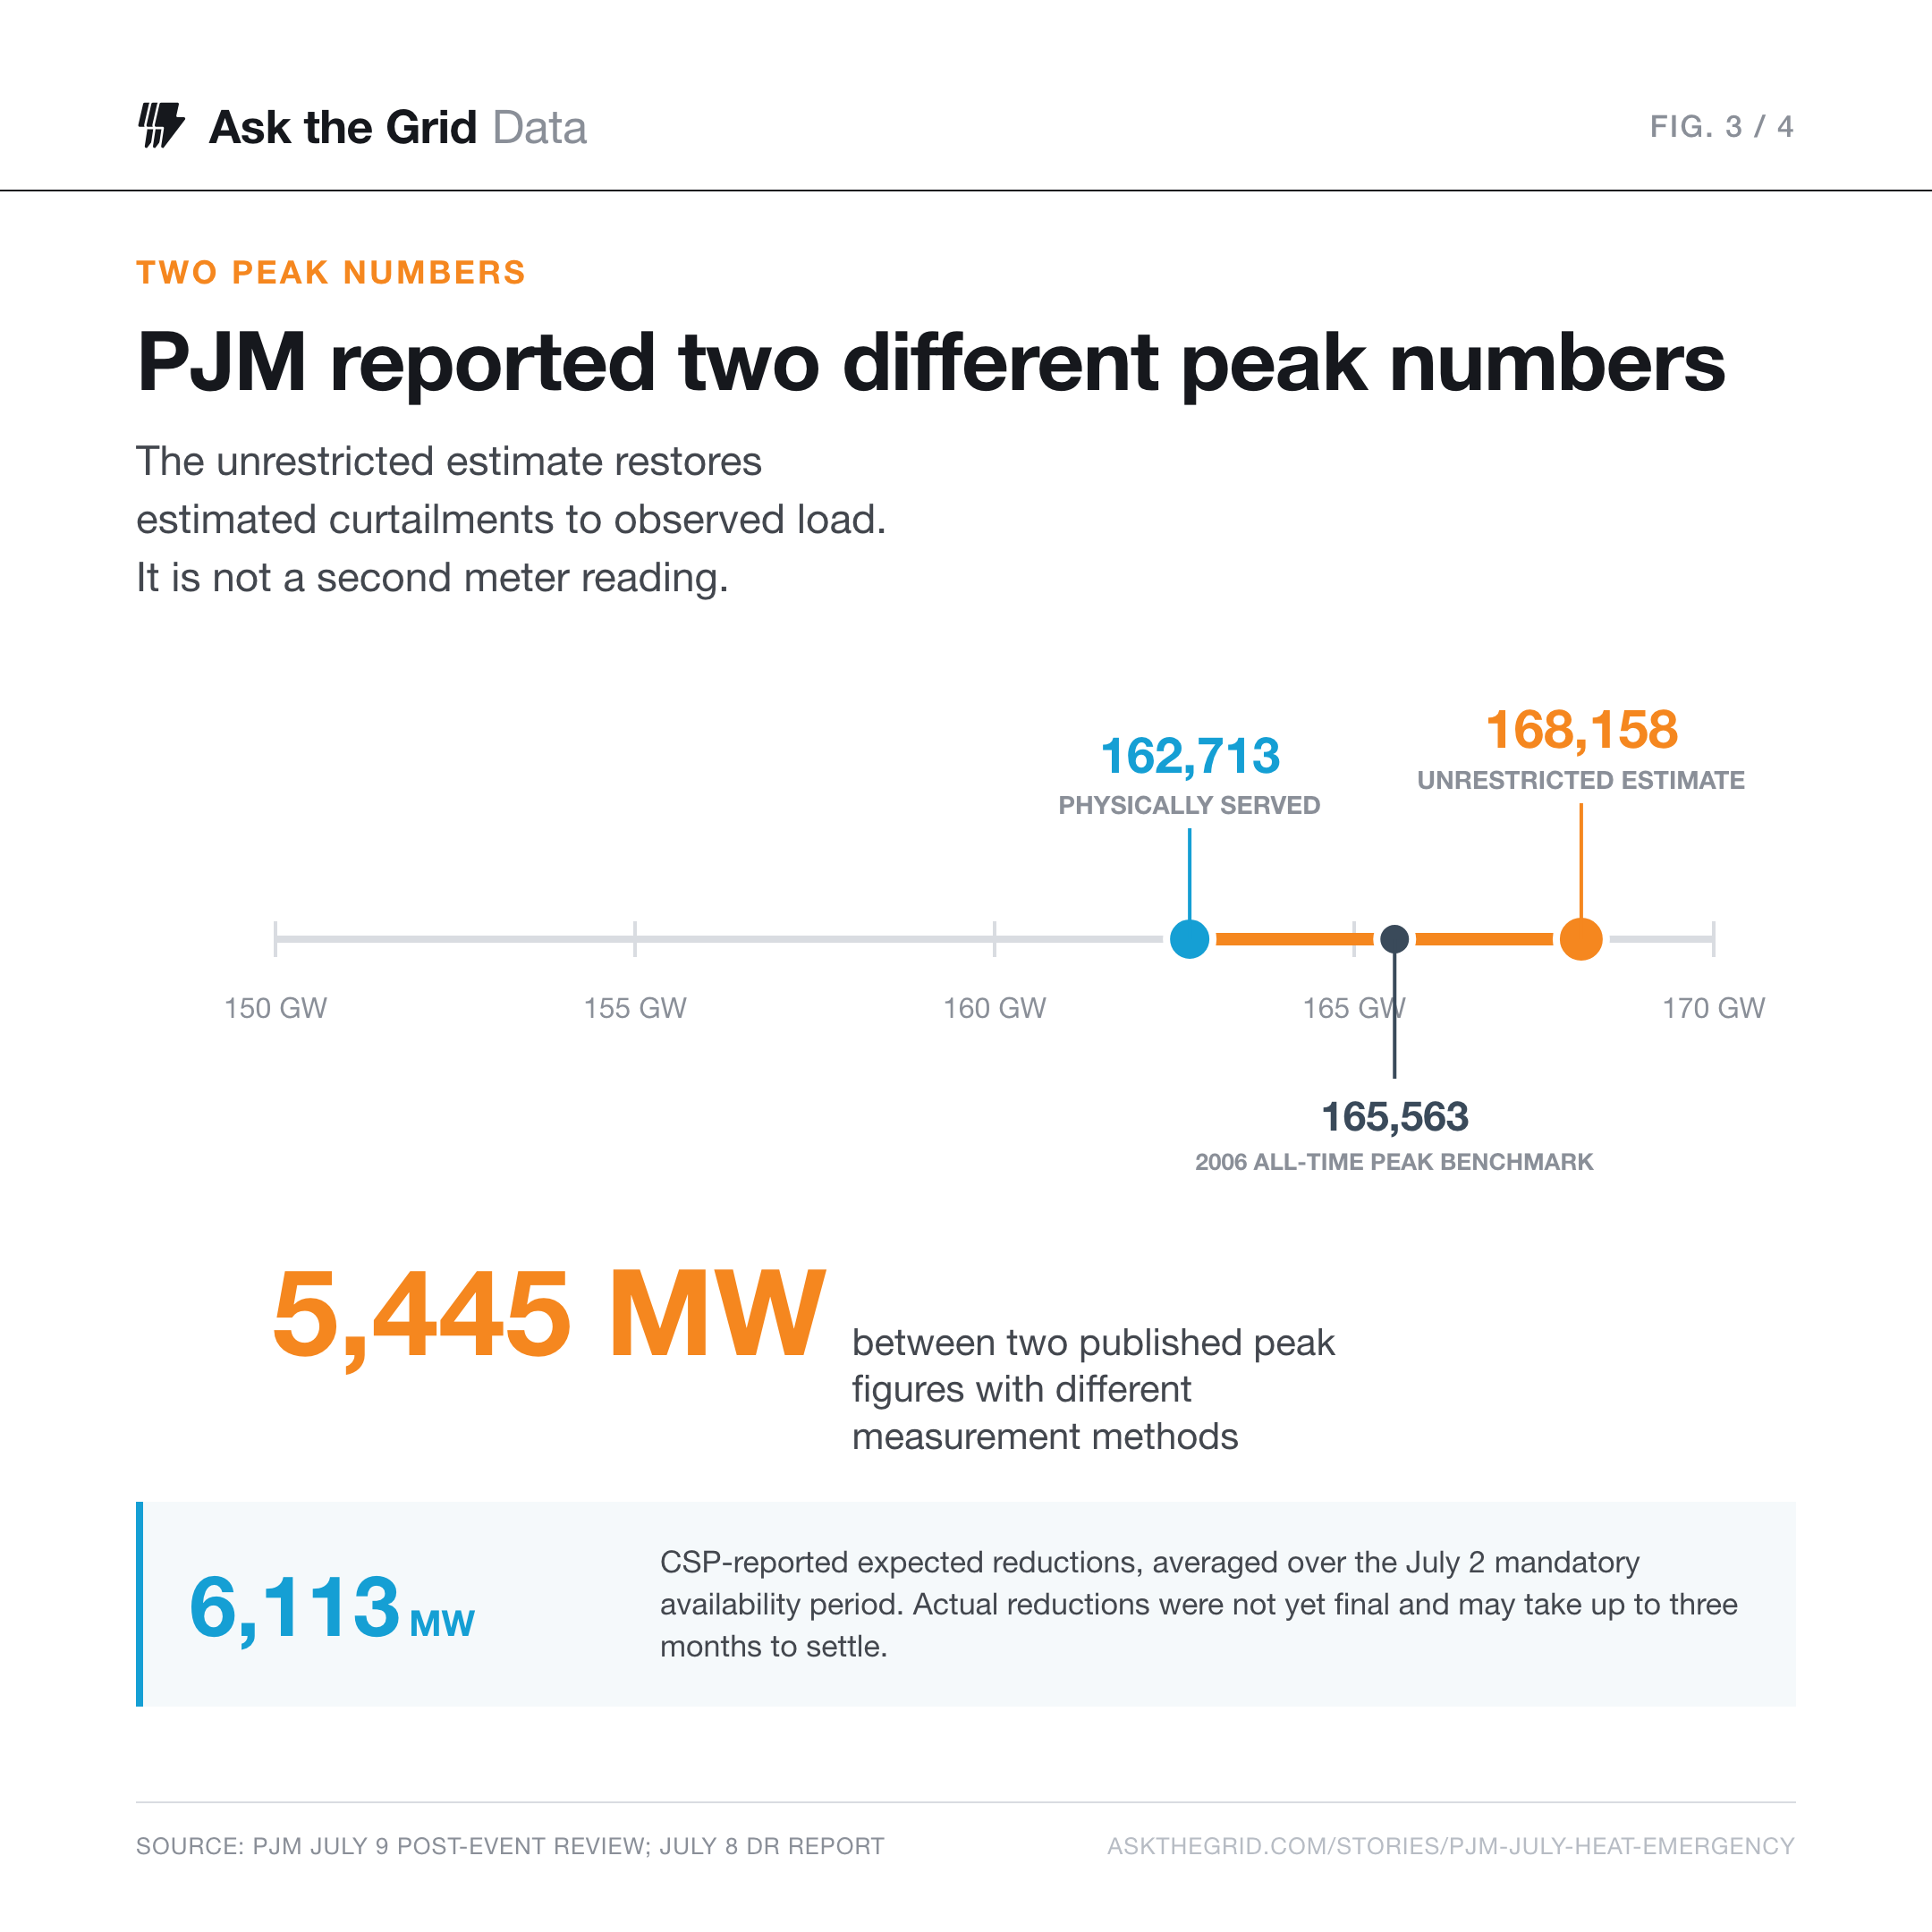
On July 2, extreme heat pushed PJM to a preliminary all-time unrestricted peak of 168,158 MW. The system physically served an instantaneous peak of 162,713 MW while PJM deployed demand response, called available generation in constrained areas, and relied on a federal order allowing selected generators to operate beyond normal environmental permit limits. Those measures helped PJM maintain reliability. A separate federal order authorizing backup generation at large loads, including data centers, was available but never activated.
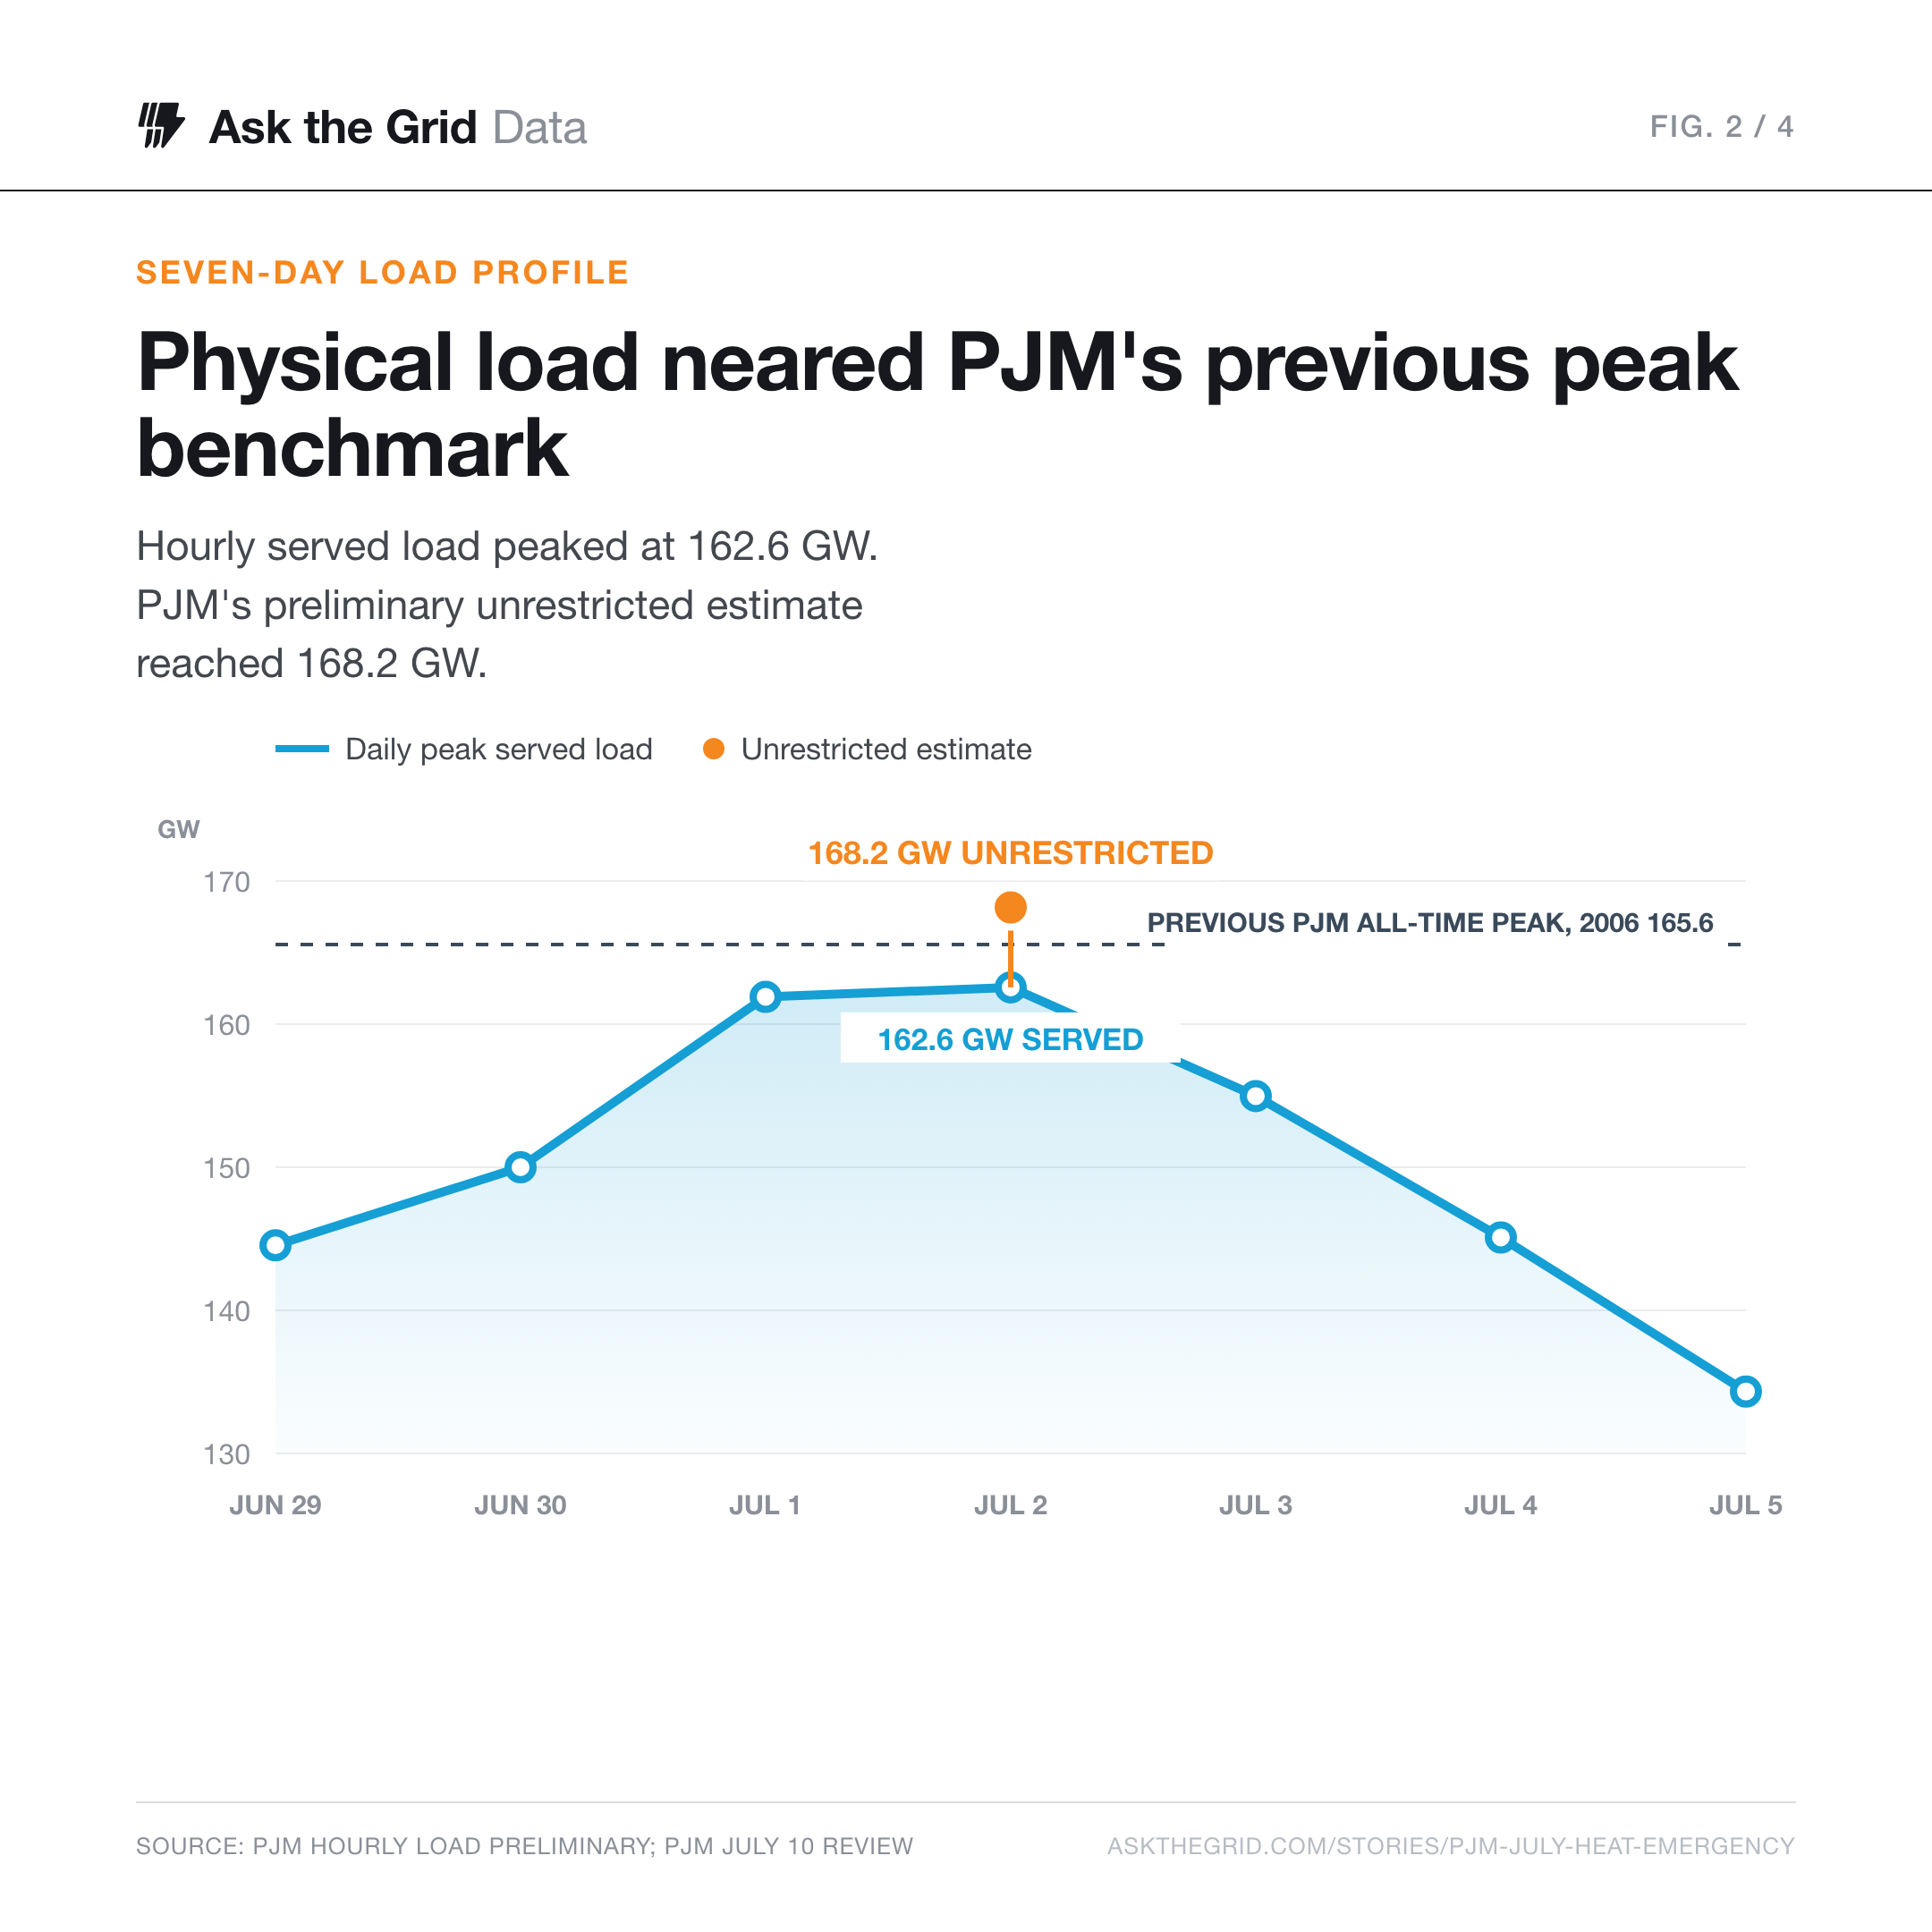
The larger number is an estimate of demand before curtailments, not electricity that flowed through the system at one moment. It stands 2,595 MW above PJM's previous all-time peak benchmark of 165,563 MW, set in 2006. Both July figures remain preliminary.
The record is bigger than the meter#
Ask the Grid's hourly series reaches 162,569 MW at 5 p.m., almost exactly matching PJM's 162,713 MW instantaneous reading at 5:55. The difference is measurement: our line is an hourly average assembled from PJM's load areas; PJM's figure is the single highest instant.
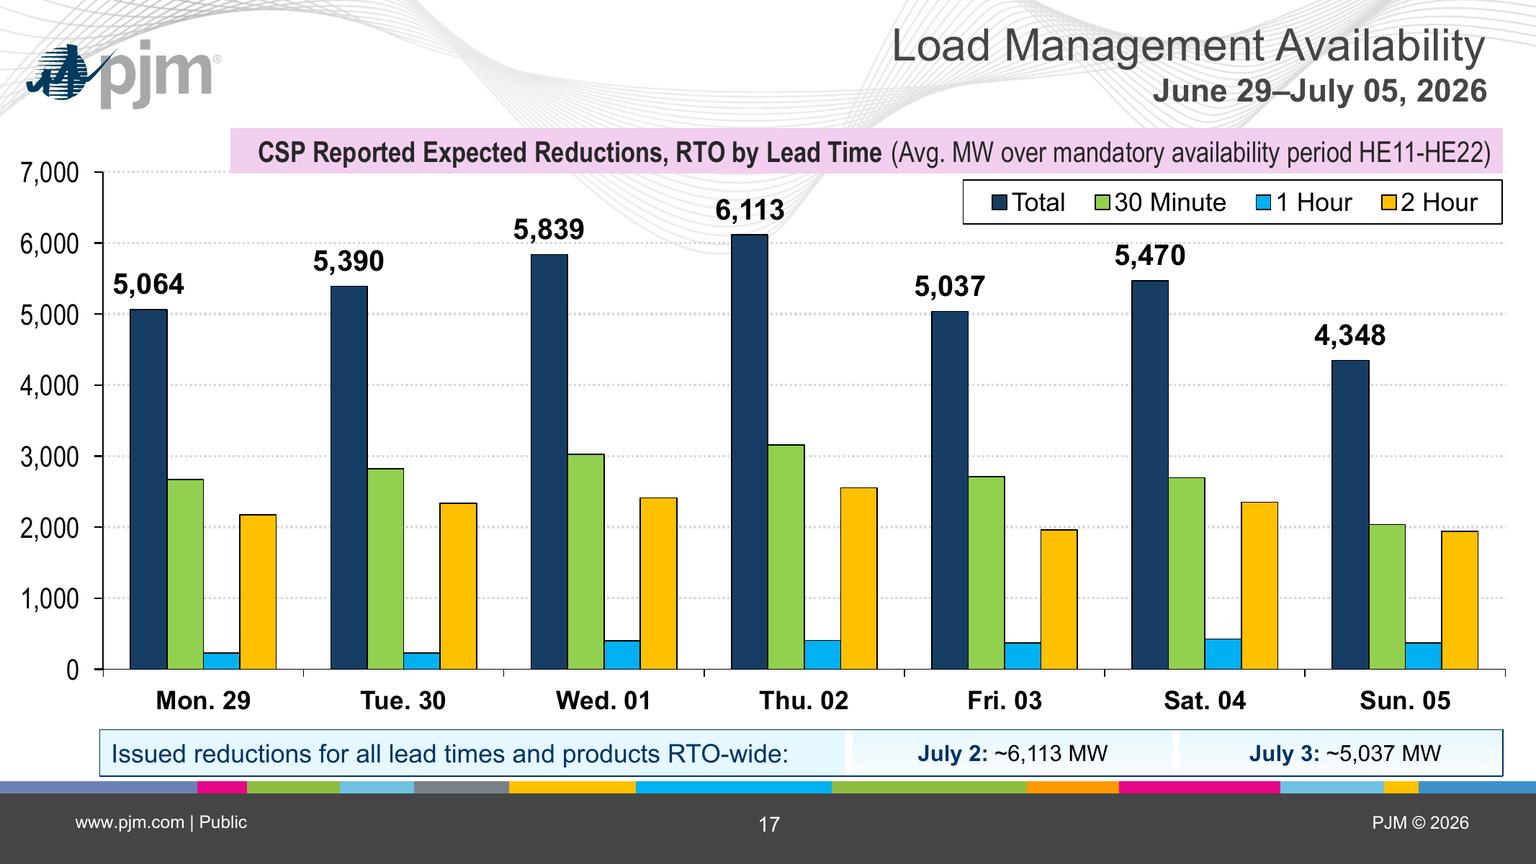
Curtailment service providers reported an average of approximately 6,113 MW of expected reductions during the July 2 mandatory availability period. Actual demand-response performance remained preliminary and could take up to three months to finalize.
That figure cannot simply be added to the metered peak. It is an average expectation across hourly-ending periods 11 through 22, while 162,713 MW is an instantaneous reading at 5:55 p.m. and 168,158 MW is PJM's preliminary unrestricted estimate. The three figures describe different measurements of the event.
At 5:18, the emergency stopped being theoretical#
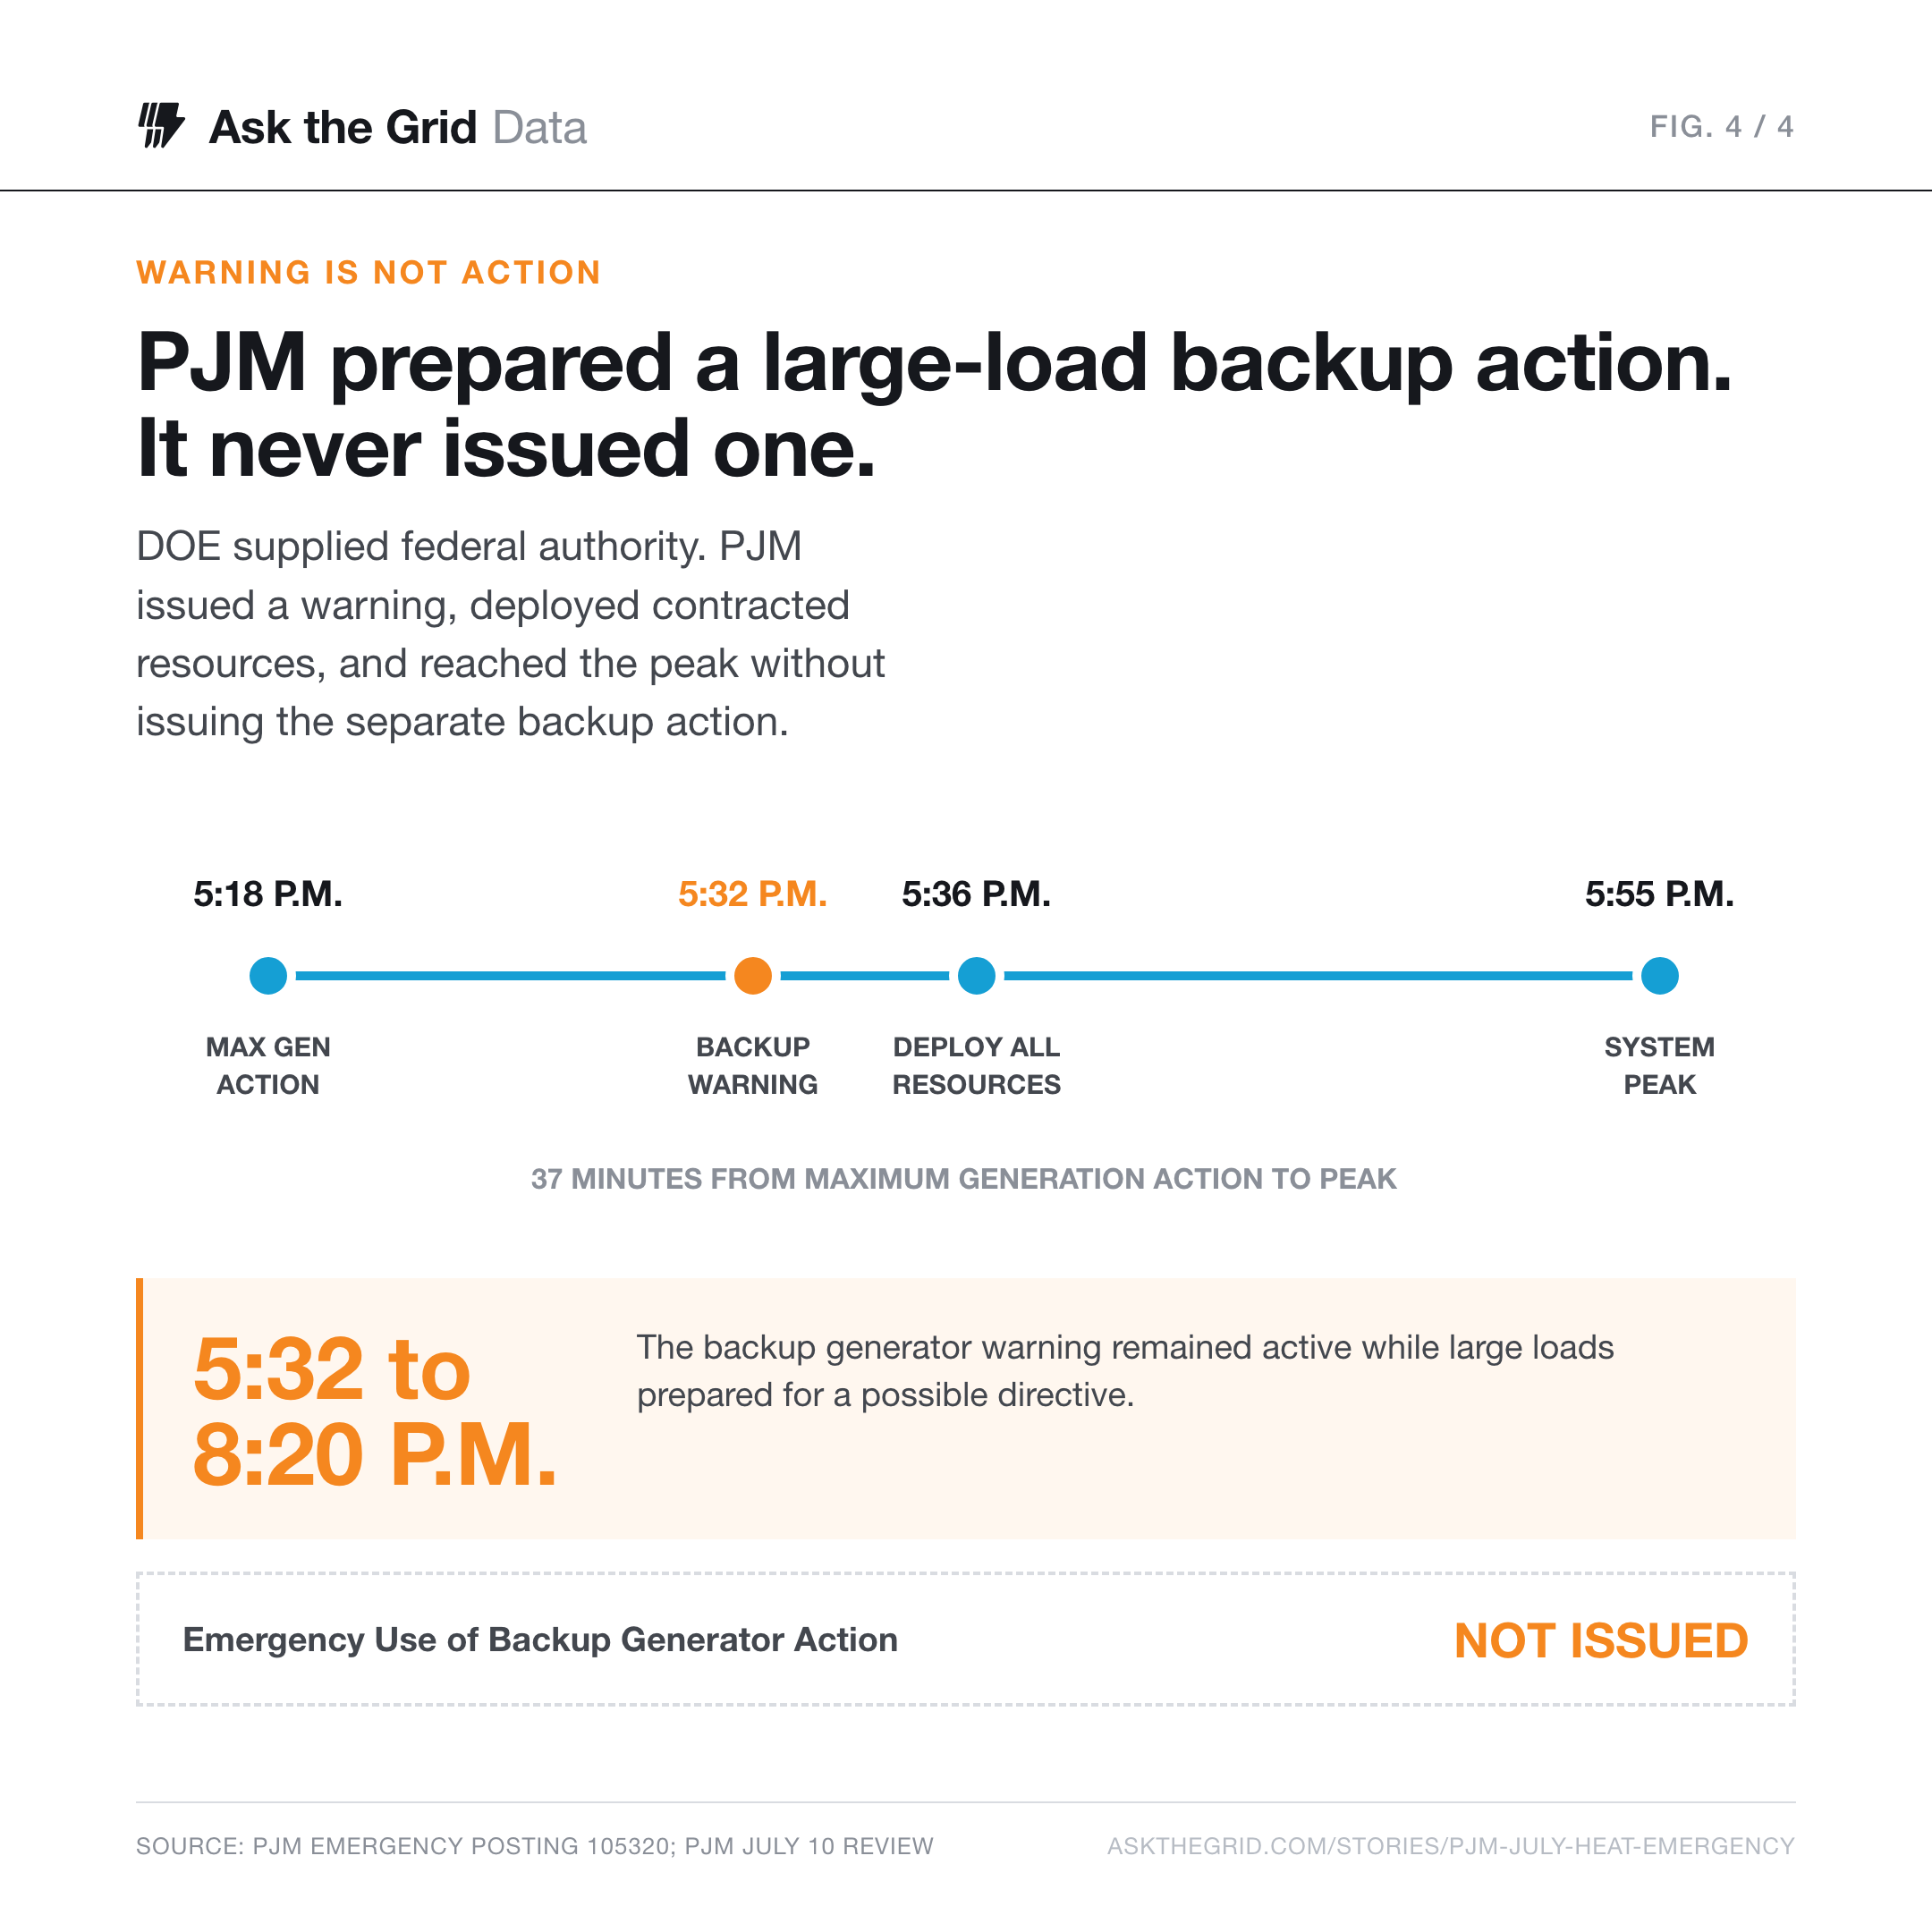
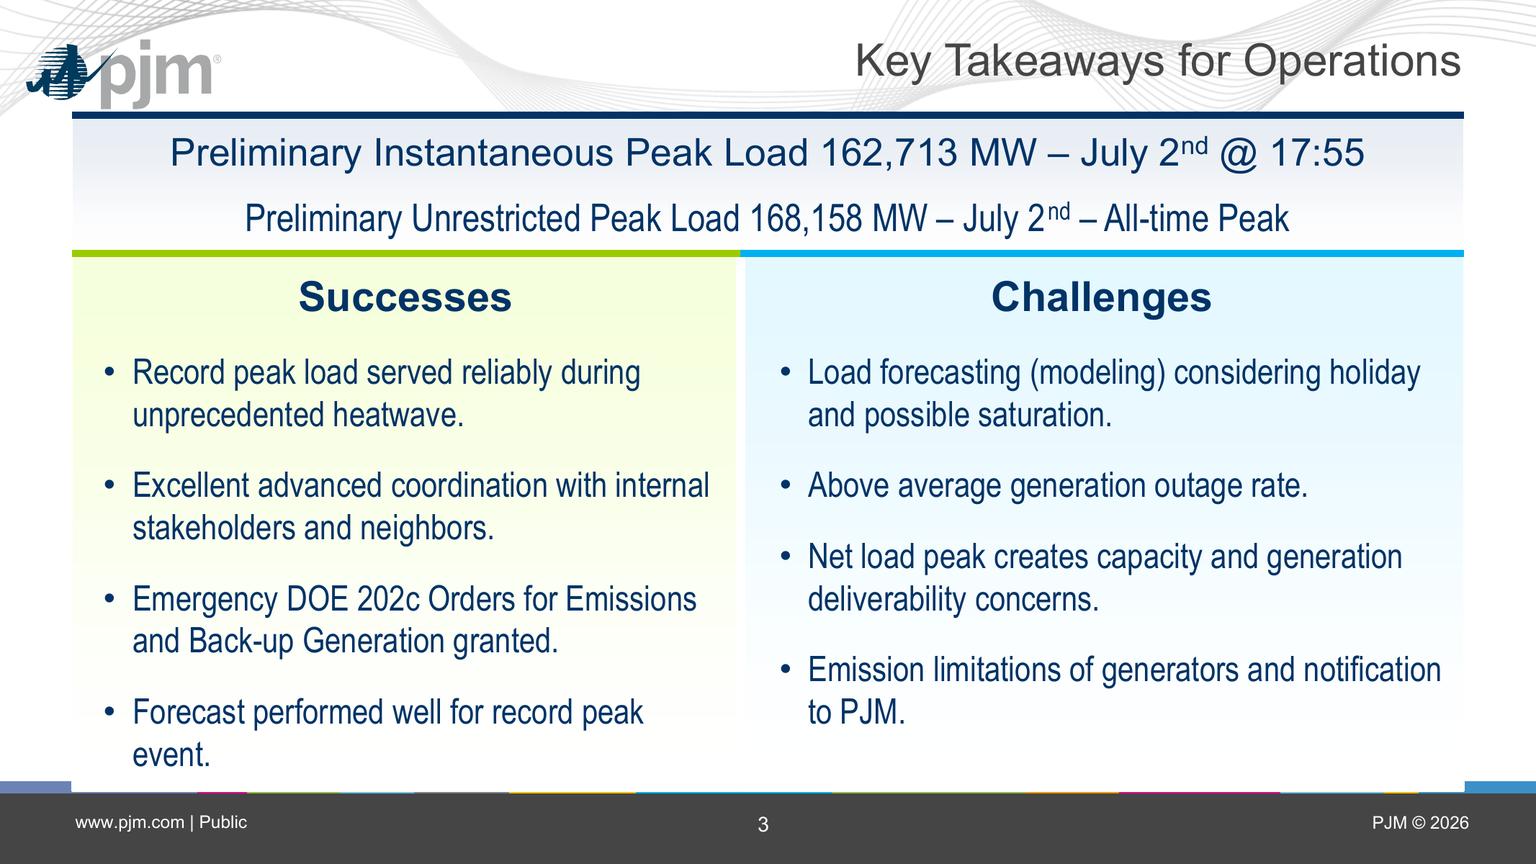
The public operations log lets us rebuild the critical 37 minutes. At 5:18 p.m., PJM declared a Maximum Generation Emergency Action for the Mid-Atlantic and Southern regions. Every available online unit was to move toward emergency maximum output.
At 5:32 p.m., PJM issued an Emergency Use of Back-Up Generator Warning. Large loads in the two regions were being told to prepare for the possibility that they would have 15 minutes to disconnect from utility power and move onto their own generators.
At 5:36 p.m., it issued a Deploy All Resources Action specifically for BGE, PEPCO and Dominion. Generators were ordered to full output, offline generation was to start as quickly as possible, and dispatched load-management customers were to reduce consumption immediately. The instantaneous peak arrived 19 minutes later.
| Time (ET) | PJM action | What changed |
|---|---|---|
| 5:18 p.m. | Maximum Generation Action | All available generation called |
| 5:32 p.m. | Backup Generator Warning | Large-load backup action prepared, not deployed |
| 5:36 p.m. | Deploy All Resources | BGE, Dominion and PEPCO targeted |
| 5:55 p.m. | Estimated instantaneous peak | 162,713 MW physically served |
| 8:40 p.m. | Maximum Generation ended | Emergency actions cleared |
The large-load backup action never came#
The word warning is doing crucial work.
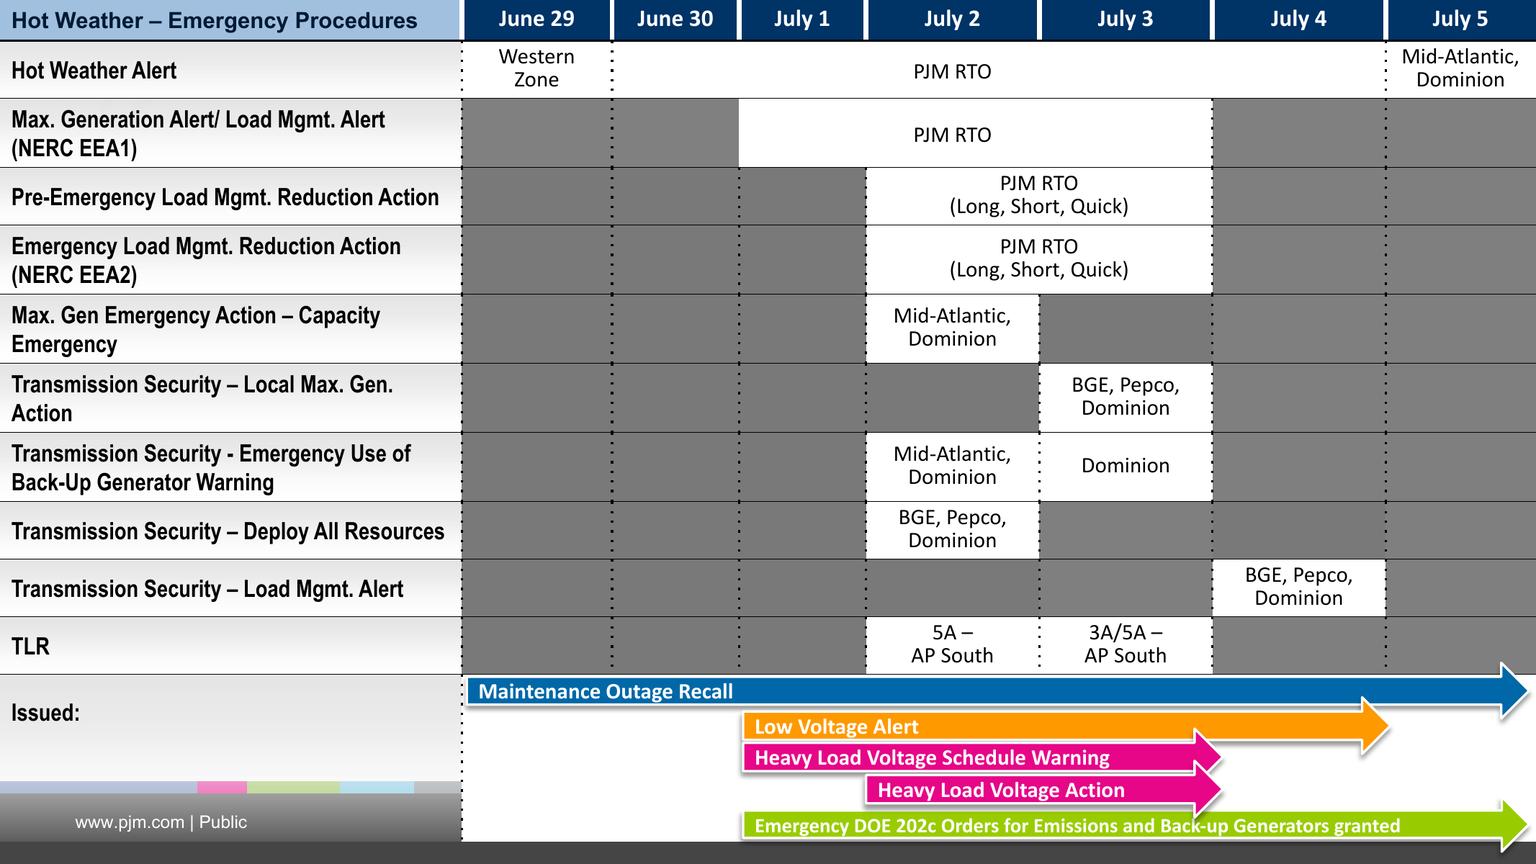
Five days earlier, on June 27, PJM had applied for emergency authority to call backup generation at large loads, including data centers and other industrial and commercial facilities. Its application defined large loads as sites with at least 50 MW at each delivery point or point of interconnection. DOE granted the authority on June 30 in Order 202-26-33.
But authority is not activation. PJM's public emergency log contains the 5:32 warning and no Emergency Use of Back-Up Generator Action. PJM's own post-event report is explicit: the action was not needed and was never issued.
The public record therefore does not support the claim that PJM ordered data centers onto diesel generators on July 2. It supports a narrower and more revealing statement: the system got close enough that operators warned large loads to be ready.
The six-gigawatt figure was not yet settled#
This does not mean behind-the-meter generators stayed idle. PJM's separate, market-based demand-response programs were already running. Pre-emergency resources began reducing load at 1:30 p.m. Emergency products followed later, including resources PJM defines as behind-the-meter generators whose permits require an EEA2 condition before they can operate.
The difference is between PJM dispatching registered resources under existing demand-response programs and issuing the federal last-resort action aimed at large loads. The market dispatch happened. The federal action did not. Final measured performance for the market dispatch was still unsettled.
| Day | CSP-reported expected reductions | Measurement window |
|---|---|---|
| July 2 | 6,113 MW average | Mandatory availability period, HE11-HE22 |
| July 3 | 5,037 MW average | Mandatory availability period, HE11-HE22 |
Public data gives the program-level result, but not the customer list. It does not say which participants were data centers, how many megawatts they curtailed, or which facilities started engines. A data center could have participated as registered demand response without being ordered to do so under the federal authority. PJM does not publish enough detail to separate those cases.
Oil went from spare tire to six-gigawatt resource#
While demand moved down, the generation stack moved up. At the 5 p.m. hourly peak, natural gas supplied 70,435 MW, nuclear plants 31,704 MW, and coal 28,761 MW. Solar was still producing 11,477 MW. The unusual resource was oil.
At 6 a.m. Eastern, oil was supplying 639 MW. Eleven hours later it was producing 6,194 MW, and it reached 6,425 MW at 7 p.m. Oil is expensive and emissions-intensive, and much of this fleet exists for exactly these hours: when the system has exhausted cheaper options.
The most expensive power was where the grid was tightest#
The stress was not evenly distributed. PJM's deploy-all-resources action named BGE, PEPCO and Dominion, the same Mid-Atlantic corridor where heat, outages and transmission constraints converged.
Day-ahead prices had already anticipated trouble. In BGE, the July 2 hourly price reached $1,598.77/MWh. PEPCO reached $1,533.62/MWh. The PJM-wide reference reached $1,219.91/MWh an hour later. Most days in the preceding week averaged tens of dollars per megawatt-hour at PJM-RTO.
This is evidence of wholesale system stress, not a direct measure of anyone's electric bill. Retail customers buy through utilities, suppliers, hedges and regulated procurement plans. Emergency costs may also be allocated later through uplift. The event created expensive wholesale hours; the public data cannot turn those hours into a universal household bill increase.
Generation outages rose during the heat event#
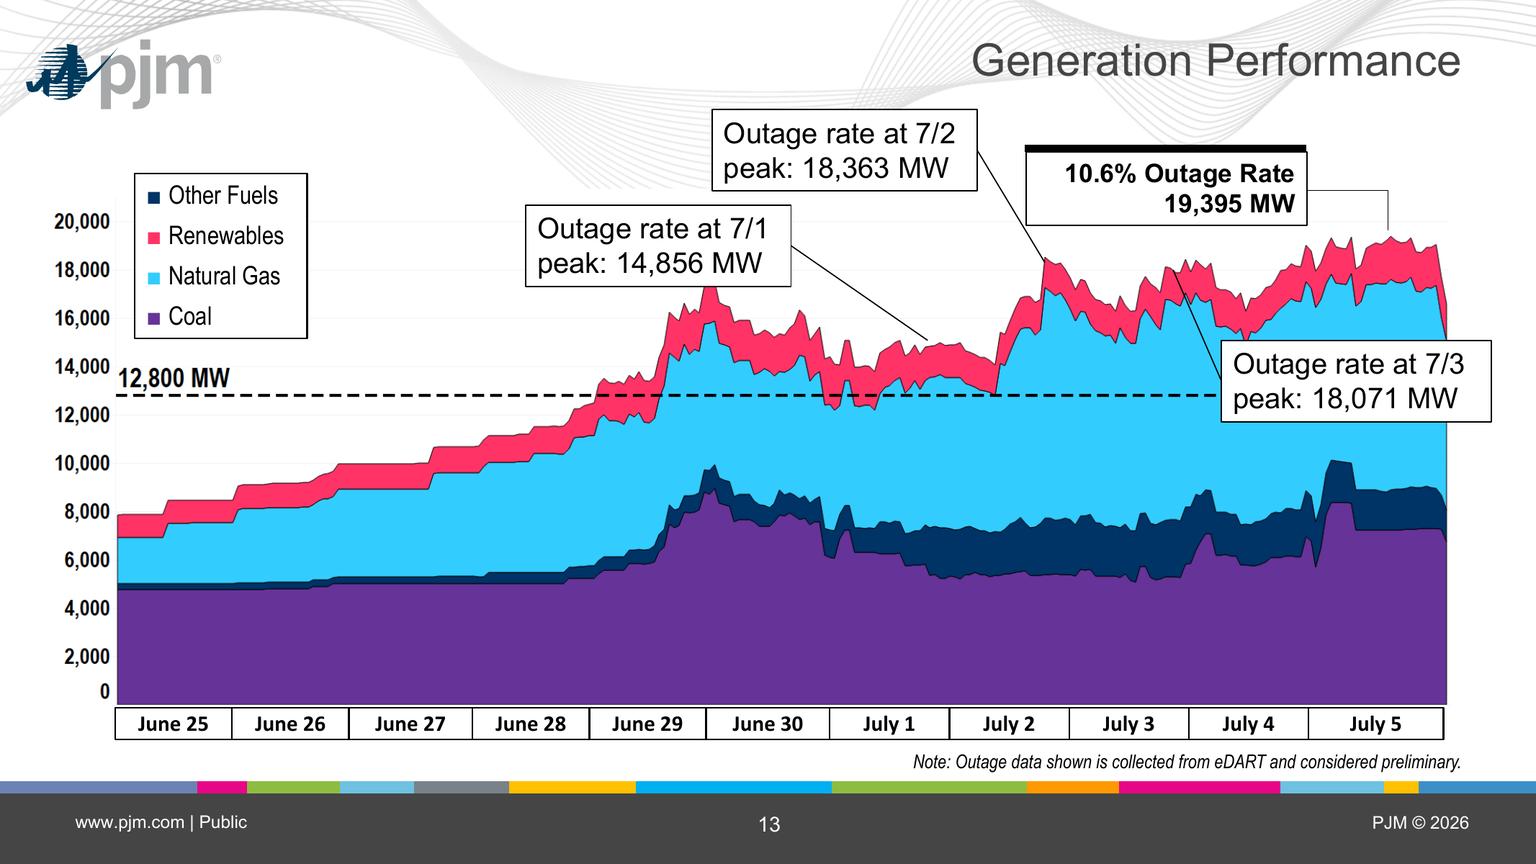
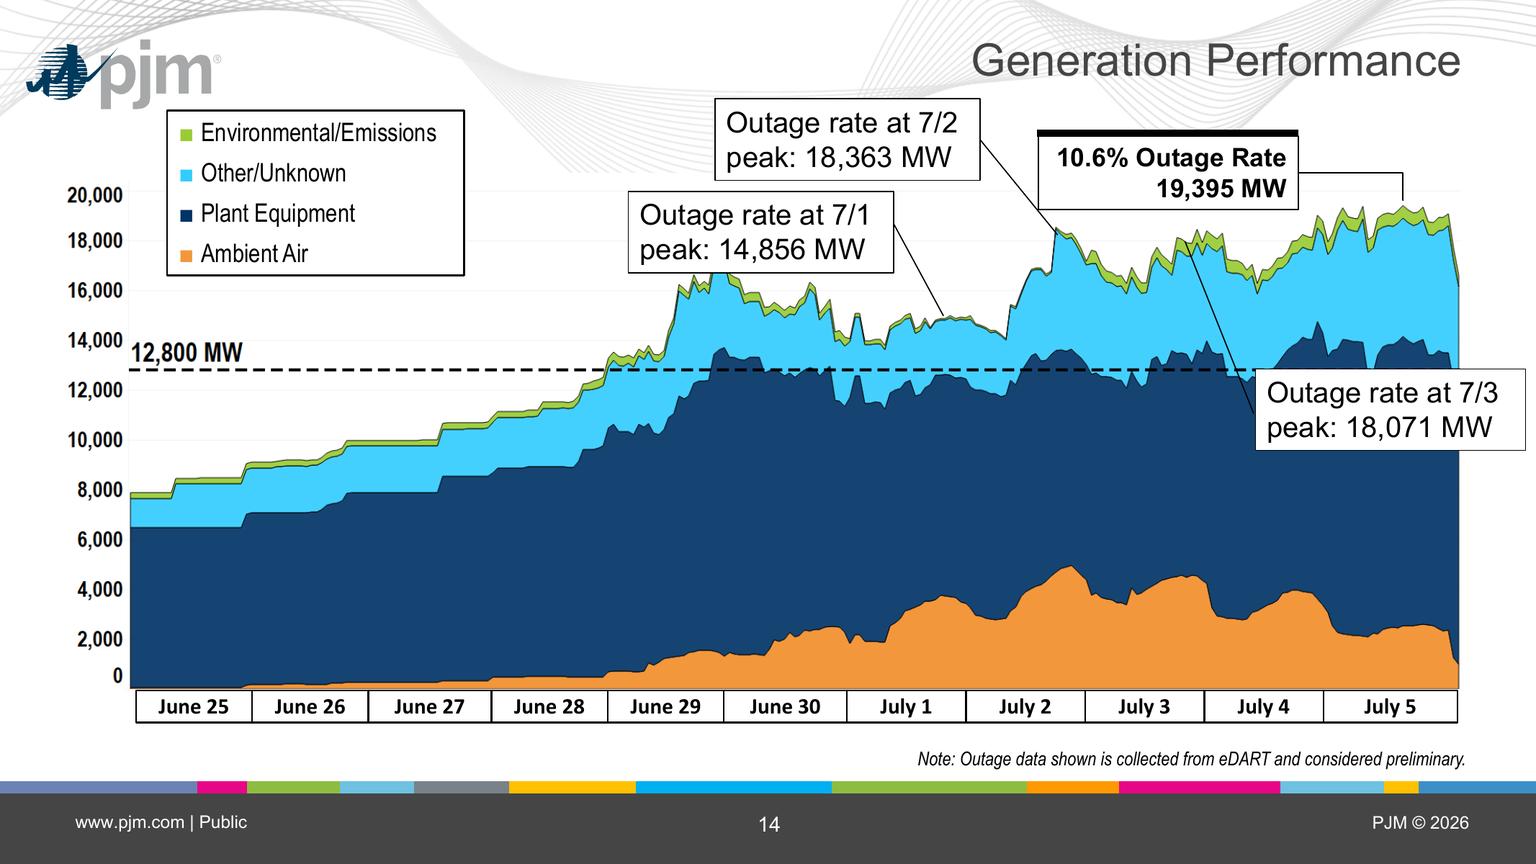
Demand alone did not create the emergency. PJM reported 18,363 MW of generation outages at the July 2 peak and 18,071 MW at the July 3 peak, compared with roughly 12,800 MW on the ten highest summer peak days of the previous three years. Its preliminary event-period chart subsequently reached 19,395 MW around July 5.
Generation outages and derates were elevated during the heat event. Plant-equipment problems accounted for the largest category, while ambient-air limitations and other or unknown causes were also significant.
Ninety-four generators crossed permit lines#
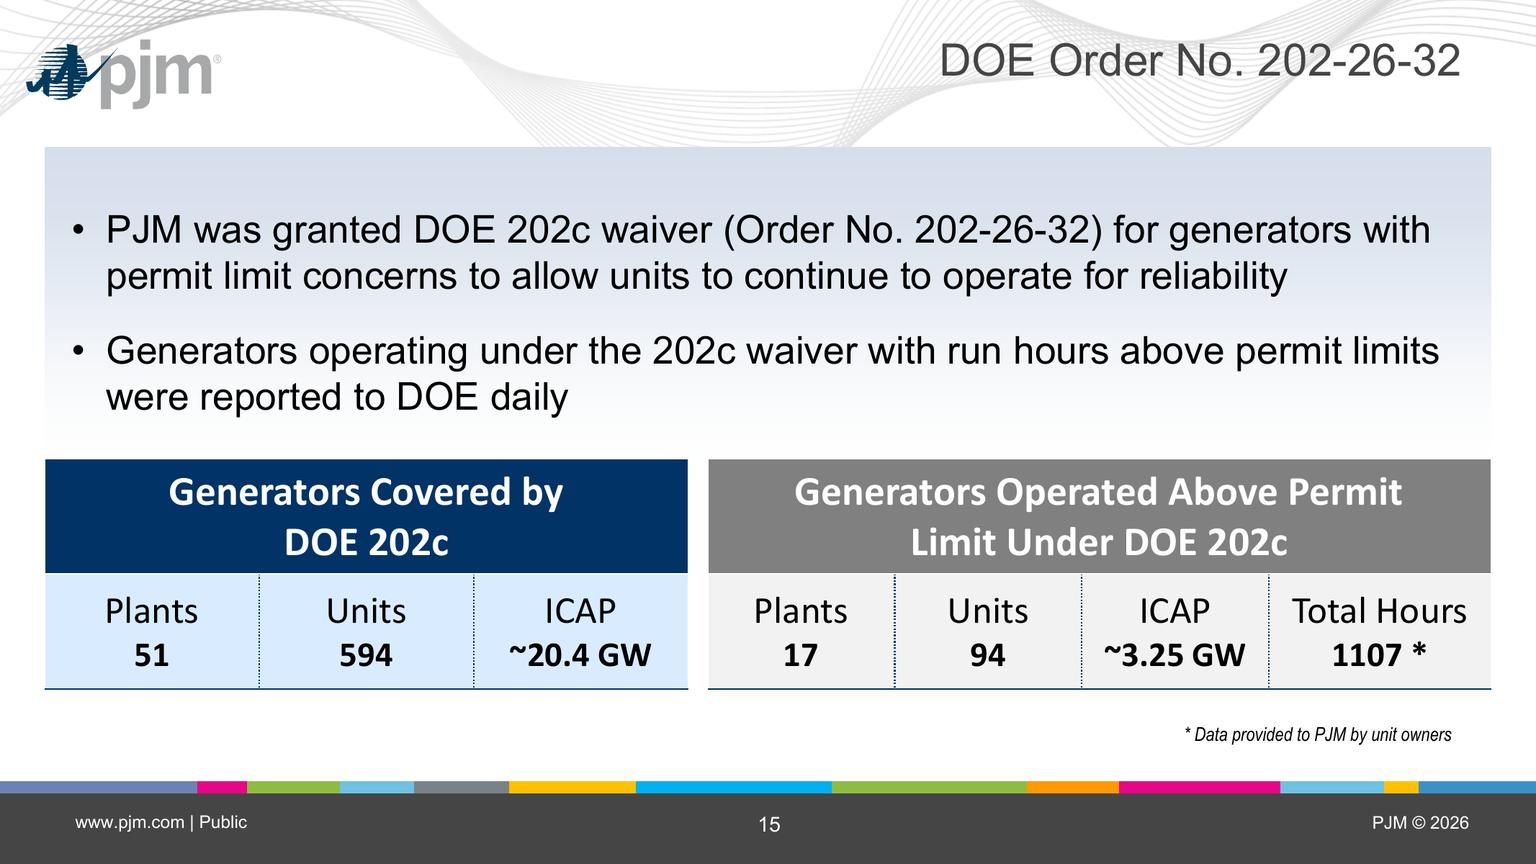
DOE's other order, 202-26-32, addressed the supply side. It covered 594 units at 51 plants, about 20.4 GW of installed capacity, whose environmental permits or operating restrictions could limit them during the emergency.
PJM now says 94 units at 17 plants, representing approximately 3.25 GW, actually ran beyond permit limits under that authority. Together they accumulated 1,107 unit-hours above those limits.
| Monitor | July 2 ozone AQI | Category |
|---|---|---|
| Edgewood | 136 | Unhealthy for sensitive groups |
| Essex | 115 | Unhealthy for sensitive groups |
| Fair Hill | 108 | Unhealthy for sensitive groups |
| Aldino | 105 | Unhealthy for sensitive groups |
| Southern Maryland | 101 | Unhealthy for sensitive groups |
That is an unusually concrete environmental finding. It is also the boundary of the public record. PJM says unit owners reported waiver-dependent operations daily, but the unit-level notices are not posted alongside DOE's order. DOE publishes changing lists of eligible units; those lists are not proof that every listed plant ran or exceeded a permit.
AirNow monitors recorded unhealthy-for-sensitive-groups ozone in parts of Maryland on July 2, including AQI 136 at Edgewood. Those readings cannot attribute a monitor result to the federal waiver. Heat and sunlight drive ozone formation, and power plants are only one source among several. The supportable conclusion is that plants operated beyond permit limits. The unsupported one is that the order caused a particular community's bad-air day.
Data centers are part of the load, not a smoking gun#
Data centers are not incidental to PJM's load forecast. PJM's May forecast-accuracy report puts the 2026 data-center July peak at 11,479 MW. That is equivalent to 6.8 percent of a peak the size of 168,158 MW.
| Area | Share of 2026 forecast at July peak |
|---|---|
| Dominion | 61.6% |
| AEP | 23.5% |
| ComEd | 7.7% |
| PS | 2.7% |
| Other zones | 4.4% |
| PJM forecast total | 11,479 MW |
The forecast is geographically concentrated. PJM assigns 61.6 percent of the 2026 data-center July peak to Dominion and 23.5 percent to AEP. ComEd accounts for 7.7 percent and PS for 2.7 percent. Those are PJM's published rounded zone shares, not event-hour meter readings.
But a structural driver is not the same as an event trigger. PJM does not publish actual data-center demand for 5:55 p.m. on July 2. It does not publish a site-by-site curtailment list. It does not identify operators or owners within the 6,113 MW of CSP-reported expected reductions. The forecast can tell us how large the sector has become, not which server hall created the final megawatt of the emergency.
The public record ends before the site gate#
PJM got through the hottest regional day it has measured without voltage reduction, manual load shed, or the special backup-generator action. It deployed load management, ordered all available resources in affected areas, and used supply-side federal authority that allowed 94 units to operate beyond permit limits. Those measures helped PJM maintain reliability.
The affected areas included Dominion, which contains PJM's largest concentration of forecast data-center load, alongside BGE and PEPCO. PJM attributed the regional constraint to interface and reactive-transfer limits; the published evidence does not establish that data centers caused it.
That is more consequential than saying data centers caused an emergency. It shows exactly how close the system came, exactly which levers operators pulled, and exactly where public transparency stopped.
We know the grid warned large loads. We know PJM dispatched pre-emergency and emergency demand-response products, including a product class that can contain registered behind-the-meter generators. We know 17 plants exceeded permit limits. We know PJM's forecast data-center peak is almost 7 percent of a system peak this size.
We still do not know which data centers reduced load, which ones started generators, or what they emitted. For a resource PJM may increasingly depend on during emergencies, that is not a small missing field. It is the next story.
The charts above are frozen from the PJM data behind Ask the Grid at publication. Open PJM on the main map and replay July 2, 2026.