The agent
Ask about one market or compare several, inspect sources, attach map context, and continue from any claim or chart.
- Status
- Live
- Access
- Free account
- Reading time
- 12 minutes
- Reviewed
- Sep 11, 2026
- Maintained by
- Product
The agent is an investigation surface attached to the active grid, not a detached general-purpose chat. It can search the source-aware catalog, inspect schemas, run bounded queries, read operator material, resolve assets, calculate comparisons, drive the map, and render a chart while keeping those actions visible above the answer.
Market scope is part of the question. The selected grid, map assets, pins, timeline, images, and chosen answer passage can all become explicit context. Sources and execution rows make the result checkable; when the necessary evidence cannot be aligned in scope, time, or units, narrow the question rather than mixing unlike values.
On this page
Ask and verify
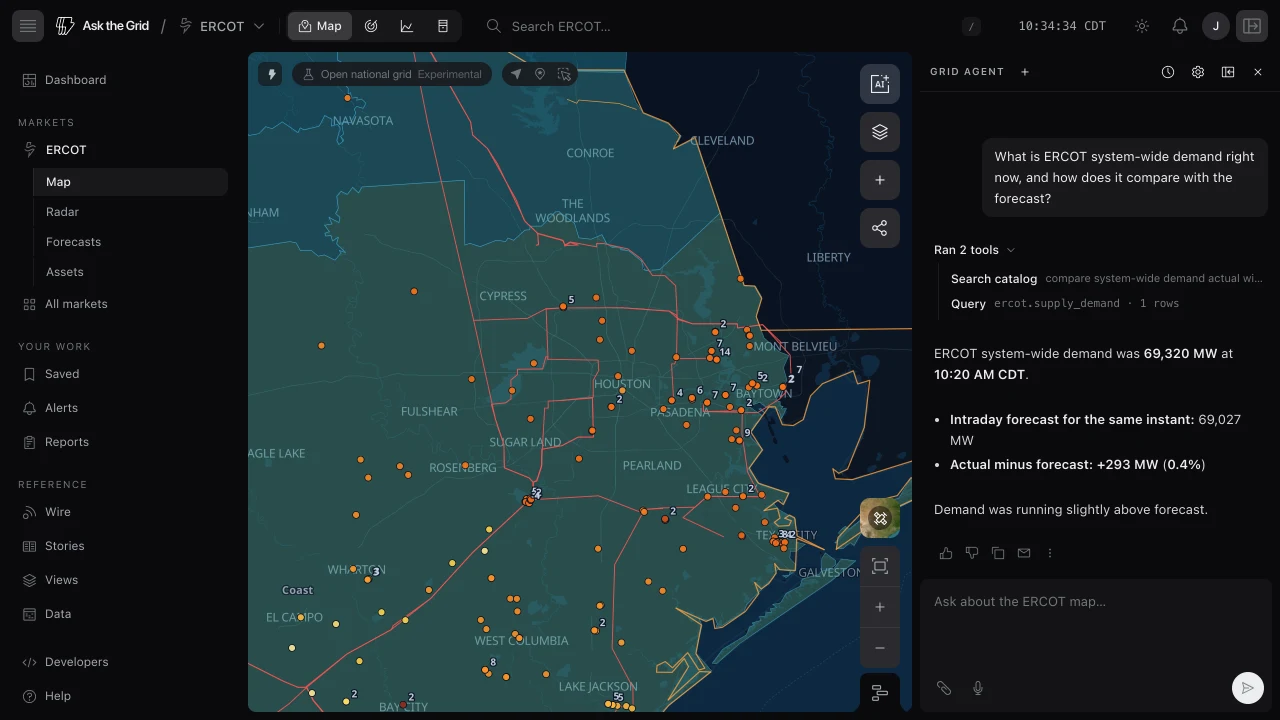
Plain-English answers, grounded in live data
Ask about demand, prices, generation, congestion, weather, or a specific asset. The agent answers and, when it helps, moves the map, scrubs time, or draws a chart to show you.
Stuck for a first question? The empty state suggests prompts based on what's on your screen right now.
It can drive the map for you
The agent can pan and zoom to a plant, zone, or node, jump the timeline to a moment you name, turn map layers on or off, select assets, and pull up structured cards for any asset — so its answer and the map stay in sync.
Scope, sources & deeper work
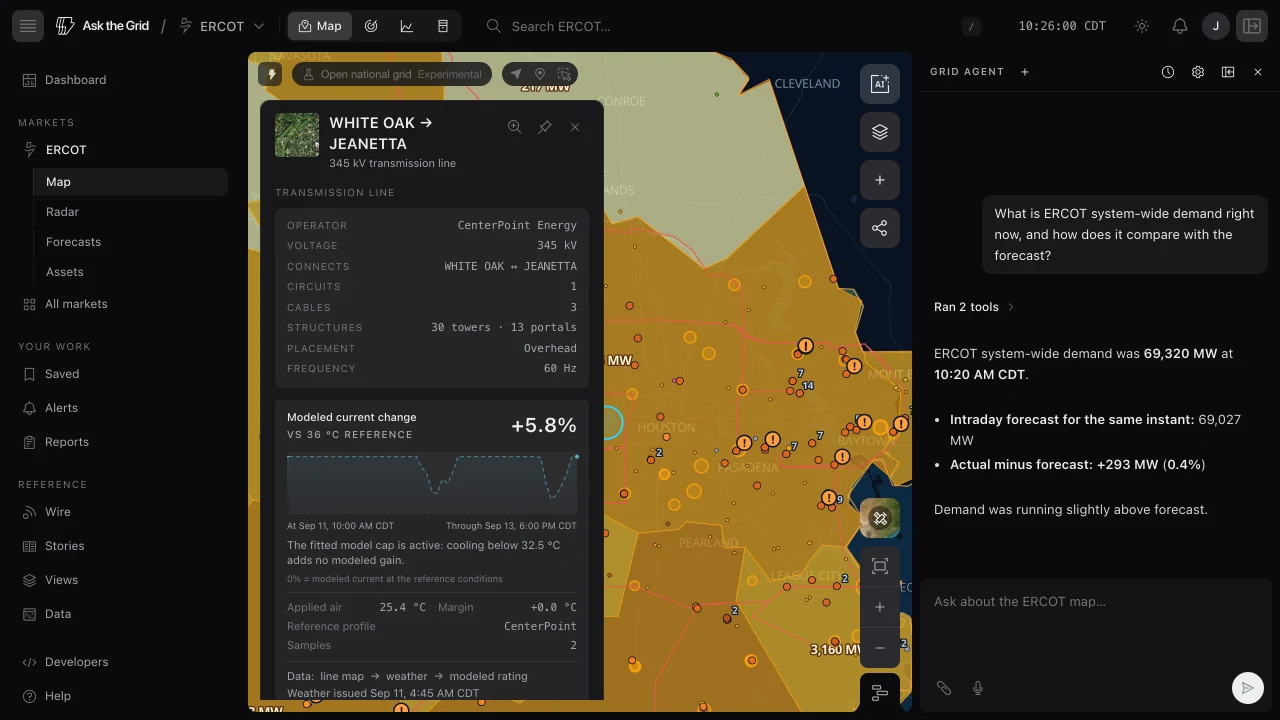
Compare markets without moving the map
The grid open on the map is the default when your question does not name a market. Name another market—or several—to investigate them in the same conversation without switching views. For comparisons, specify the date, time, and market product you mean. The agent keeps each observation's market, units, and interval meaning attached, and reports missing or incompatible values separately rather than forcing a ranking.
Ask explicitly to switch grids when you want the map to move. A question about another market does not move it.
Check the sources
Answers list the catalog datasets they queried under Sources, each linking to its dataset page, and link any operator reports or official pages they read. Open Worked through N steps above the answer to see each search, query, and result in order. Verify important decisions against the original publisher.
Ask multi-step questions
The agent can work through several lookups and calculations in one investigation. If a lookup fails, it can recover and continue; when the question is too broad, it gives a clear stopping point so you can narrow or continue.
Choose the depth of your question
Sign in with a free account and ask for what you need: a quick value, a short explanation, a chart, or a multi-step investigation. The agent adapts its work to the question; there is no model setting to choose.
Give it context
Attach assets from the map
Add a plant, zone, node, or dropped pin to your message as a context chip, so "compare these two" or "what's this?" just works. Attaching never sends the message; type your question, then send.
- 1Select an asset, then choose Ask the agent on its info card.
- 2Or Shift-drag a box (or use the lasso) to select several assets, then choose Ask the agent about these on the selection card.
- 3Right-click the map and choose Ask about this location to drop a pin and attach it.
- 4Type @ in the composer to find an asset in the active market and attach it without touching the map.
- 5With the Here tool open, the clicked point attaches as a zone and nearest-node chip.
Add images
Paste, drag, or pick images (up to four per turn) — a screenshot, a chart, a diagram, or an iPhone HEIC photo — and ask the agent about them. Images up to 32 MiB are converted and resized in your browser before sending; their full proportions are preserved.
Talk to it
Use the microphone to dictate your question instead of typing. Your speech is transcribed straight into the composer.
Make it answer your way
Set a style and tone
Open Settings from the agent panel's header, or go to Settings → Preferences → Grid agent. Choose a base style: Default leads with the answer and the evidence that decides it; Efficient gives the answer and the numbers behind it and little else; Thorough walks through the evidence, the method, and the caveats; Explanatory uses plain language, defines market terms, and explains the mechanics. Then set Warmth, Enthusiasm, and Headers and lists to Less, Default, or More.
Tell it how you work
Custom instructions are standing requests the agent applies to every answer, such as quoting prices in $/MWh to one decimal place or ending with a one-line bottom line. About you describes your role and the markets and assets you follow, so answers are framed around what you decide; the agent uses it to set emphasis and does not repeat it back. Each field holds up to 1,500 characters.
Where your settings apply
Settings save as you change them, follow your account to every device, and apply from your next question, including in a conversation already under way. They shape tone, length, structure, and focus; every figure is still grounded in the data the agent queries. Turn off Personalize answers to get the default agent without losing what you set.
Where the agent opens, as a floating panel or a sidebar, is saved on each device instead, since a layout that suits a wide monitor rarely suits a laptop.
Charts and evidence
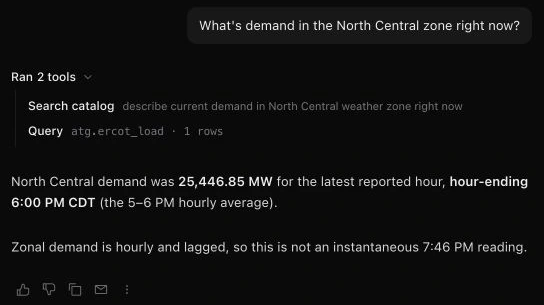
Charts
The agent renders line and area charts for time series and bar charts for categories such as generation by fuel, inline, when a number is better seen than described. Highlight a passage in any answer to ask it to Explain, Show the data, or Chart it.
Rate & revisit
Feedback, copy, and email
Hover or focus any answer to rate it with thumbs up or down, copy its text, or choose Email me this answer to send it to your account email address. Your feedback helps us make the agent better.
Conversation history
A free account keeps every conversation in History across devices, so you can reopen a past thread and pick up where you left off. Open Conversation history from the agent panel's header to reopen a recent thread in place without leaving the page; a conversation from another market opens on that market's map, and See all conversations opens the full History page.
Turn the work into a report
Ask the agent to write up a session as a report, or to set up a recurring brief such as a weekly congestion review. The report is created in Reports under your account and its first issue starts generating immediately.
Free question limits
The grid agent is part of the free workspace. A Free account can ask up to 40 questions per hour; invitations can add bonus capacity. Enterprise is for unlimited, shared, or private-data workflows.
Did this guide get you unstuck?
One click is enough. No message or account required.