New England Wind Output Reached 2 GW During September’s Nor’easter
The storm lifted wind generation while causing customer outages and limited disruption to the regional transmission system.

New England’s combined wind output reached approximately 2,000 MW on September 27 as a strong nor’easter crossed the region. ISO New England’s October operations report also identifies an offshore wind high of roughly 1,100 MW on September 24, earlier in the same storm.
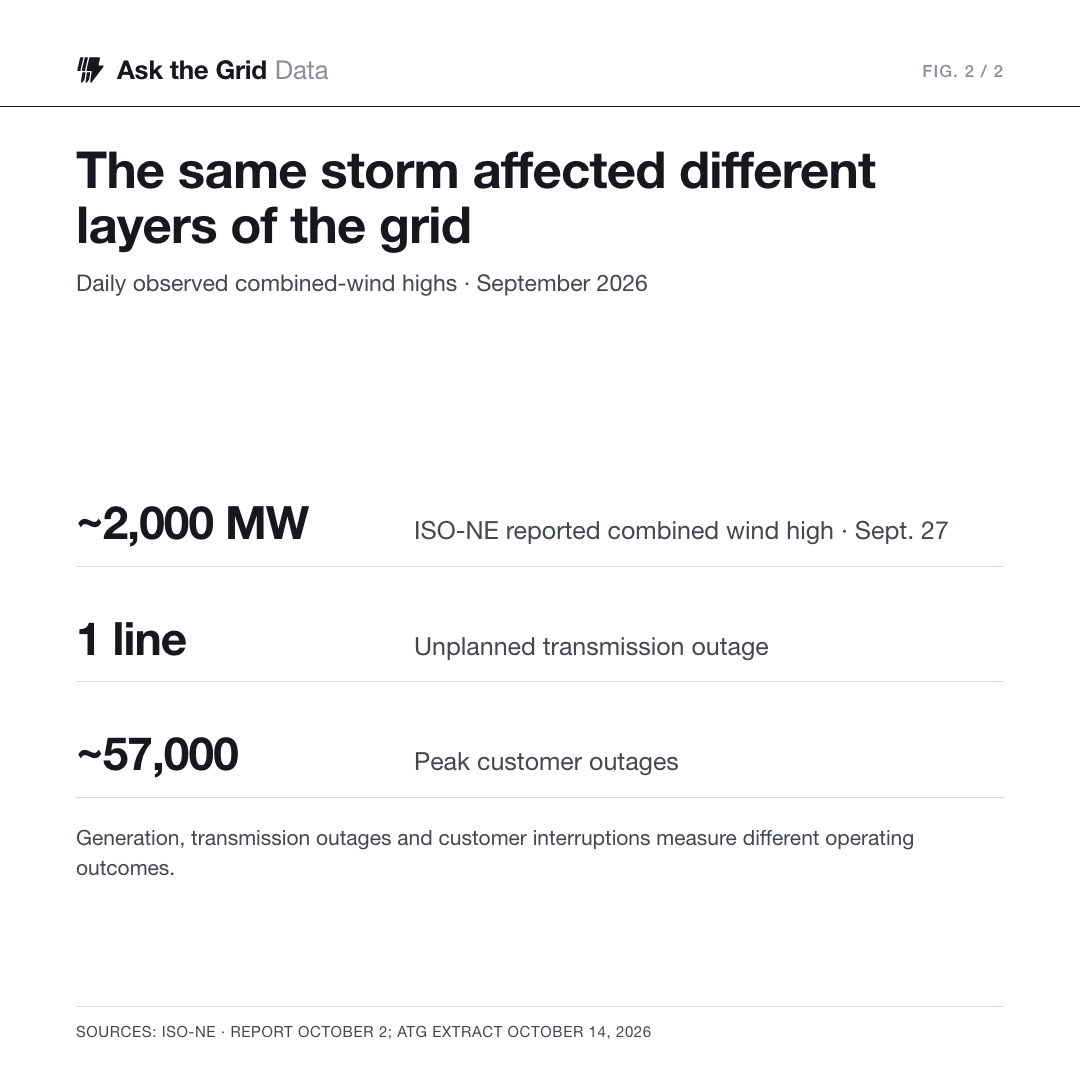
The event produced two simultaneous experiences of the grid. Wind generation increased, while high winds and rain interrupted customer service. ISO-NE reports approximately 57,000 customer outages at the peak and only one unplanned transmission-line outage. Those measures describe different layers of the electricity network.
The wind high arrived over several days#
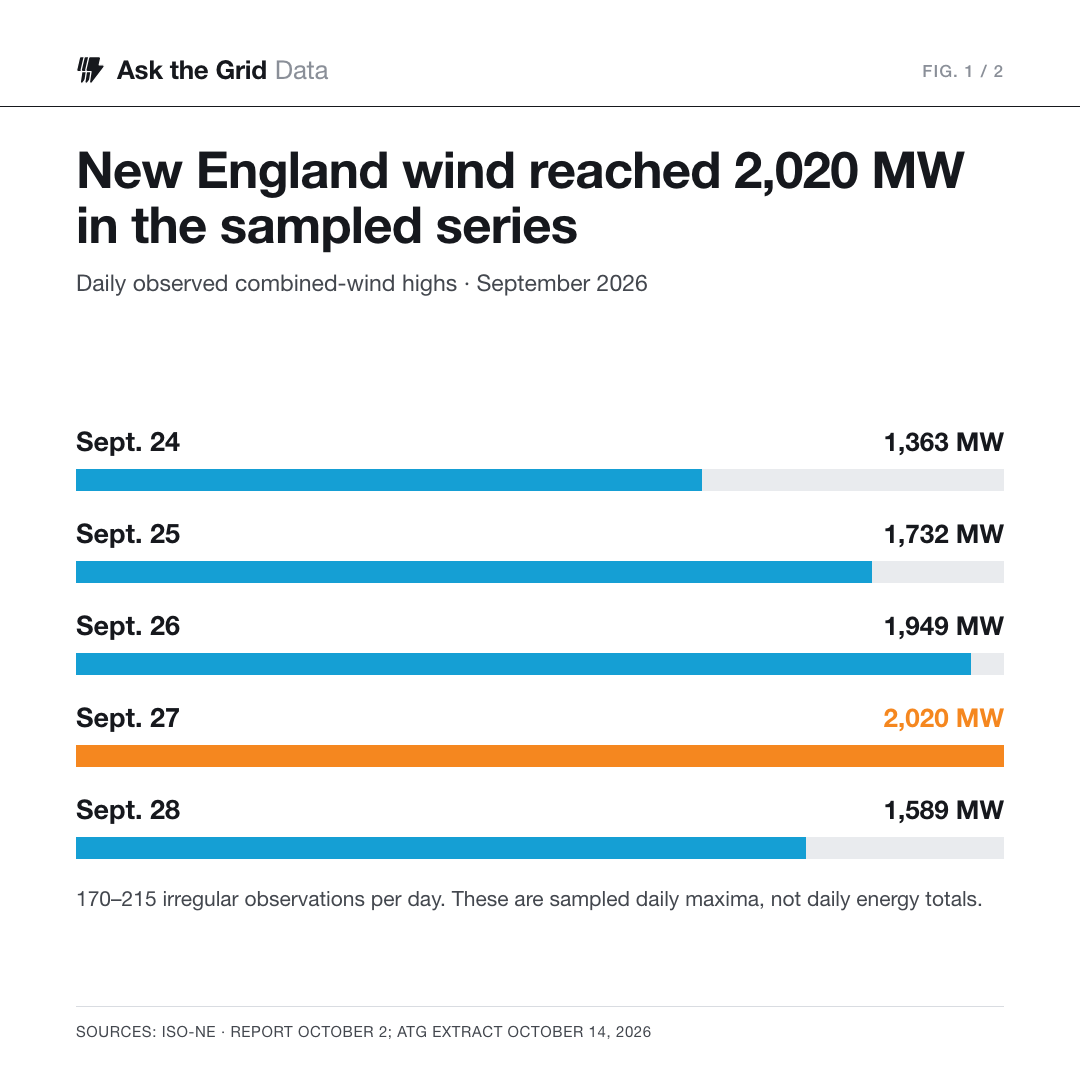
ATG’s frozen regional generation series contains a 2,020 MW observation at 6:45:50 a.m. Eastern on September 27. That is consistent with the operator’s rounded combined-wind figure. Daily observed highs in the extract rose from 1,363 MW on September 24 to 1,949 MW on September 26, before reaching 2,020 MW on September 27.
These are maxima among irregularly timed published observations. The extract contains between 170 and 215 observations per day, rather than a complete set of evenly spaced five-minute measurements. It can verify the observed high and the shape of the sampled series; it does not establish the exact continuous-time maximum or total wind energy over the storm.
Offshore output and total wind answer different questions#
| Measure | ISO-NE report | What it describes |
|---|---|---|
| Offshore wind high | Approximately 1,100 MW · September 24 | Offshore output; a separate date from combined high |
| Combined wind high | Approximately 2,000 MW · September 27 | Onshore plus offshore instantaneous output |
| Transmission effects | One unplanned line outage | Regional transmission system |
| Customer outages | Approximately 57,000 at peak | Customer service interruptions |
| Storm period | September 24–28 | Weather-event window |
The approximately 1,100 MW offshore figure comes directly from ISO-NE’s report. The normalized ATG series combines onshore and offshore wind, so it cannot independently reproduce the offshore split. It would also be wrong to add the reported offshore high on September 24 to the combined high on September 27: they have different dates and the combined value already includes offshore production.
The useful comparison for the operating system is how wind contributed alongside other supply and interchange at the same time. A high output value describes the fleet’s production in that interval. It does not guarantee that the same fleet can supply that amount during the next peak-demand event.
A storm can increase generation while interrupting service#
ISO-NE reports gusts above 70 mph in southeastern New England and Long Island, with five to eight inches of rain in southern New England. It describes minimal disruption to the transmission system during the September 24–28 event. That account is compatible with substantial customer outages because a customer can lose service through damage farther down the network.
The distinction matters when reading a generation chart against an outage headline. Strong regional supply does not demonstrate that every distribution circuit remained connected. Conversely, a count of customers without electricity does not measure a shortage of generation across the regional market.
The market backdrop was a lower-demand week#
ISO-NE’s weekly summary for September 21–27 recorded a real-time Hub average of $28.19/MWh, down from $44.27 the previous week. Its initial revenue-quality system peak was 14,246 MW, also lower than the preceding week. Those weekly comparisons establish context, not the isolated price effect of the storm or of wind generation.
Weather, demand, gas prices, imports, outages and generator availability can all affect wholesale prices. Attributing the whole weekly price decline to wind would require a counterfactual analysis that these summary statistics do not supply. The supported finding is narrower: higher observed wind output occurred within a week of lower regional demand and lower average real-time Hub prices.
The next comparison is output during system stress#
For operators and planners, the next useful evidence is the wind fleet’s production across a range of weather and demand conditions, including low-wind peak periods. For readers following the buildout, interval output separated into offshore and onshore resources would make changes in fleet contribution easier to track.
The daily chart uses canonical ISO-NE generation observations retrieved October 14, displayed in America/New_York. It retains the observation counts and does not integrate sparse snapshots into MWh. Weather, offshore output and outage counts are attributed to the October 2 report. Weekly prices and demand come from ISO-NE’s September 21–27 summary. Explore New England’s grid.