MISO Repriced Its July Emergency After Record Imports
Emergency price signals brought power into the Midwest. A later correction changed the economics of the response.
MISO drew a record amount of scheduled power from neighboring grids during the July 15 heat emergency. Then a correction to its emergency prices changed what some of those transactions were worth. In the independent market monitor’s published interface-trading table, an original $8.96 million profit became a $9.86 million loss—an $18.82 million change for the trades in that table.
The operating response and the settlement response happened on different clocks. Power arrived while the system was managing tight conditions. Prices were revised afterward because emergency pricing continued after the demand resources that triggered it had been released. The episode makes the price seen by a participant, the physical action it prompts and the eventual settlement three separate parts of the same event.
Power arrived from neighboring markets#
ReliabilityFirst’s September account puts July 15 net scheduled imports at 17,751 MW during the 8 p.m. hour, exceeding the previous 14,315 MW record from June 2021. PJM and Southwest Power Pool supplied substantial assistance. This is a scheduled-interchange record: it describes market schedules across the boundary, rather than a measurement of every physical tie-line flow.
ATG’s hourly historical schedule series shows the two neighbors’ contributions rising through the afternoon and evening. The published counterparty series is useful for that chronology, but its hour labels and reconciled values should not be substituted for the operator’s separately reported record. The frozen chart retains the source’s UTC timestamps and displays them in Central time.
Emergency pricing outlasted the resource call#
MISO called load-modifying resources, or LMRs, during the emergency. These are demand-side resources that can reduce consumption when dispatched. Emergency offer floors help prevent the extra supply or reduced demand from making the market price look as though the underlying emergency has disappeared.
The market monitor reports that LMRs were canceled after less than an hour, while their price-setting status persisted until almost 8 p.m. because of a software issue. ReliabilityFirst describes approximately three hours of inaccurate pricing near $1,000/MWh and says MISO subsequently corrected prices and implemented a software fix. The monitor says revised prices were posted July 28.
Repricing changed the economics of an action already taken#
| Interface | Original profit / loss | Revised profit / loss | Change |
|---|---|---|---|
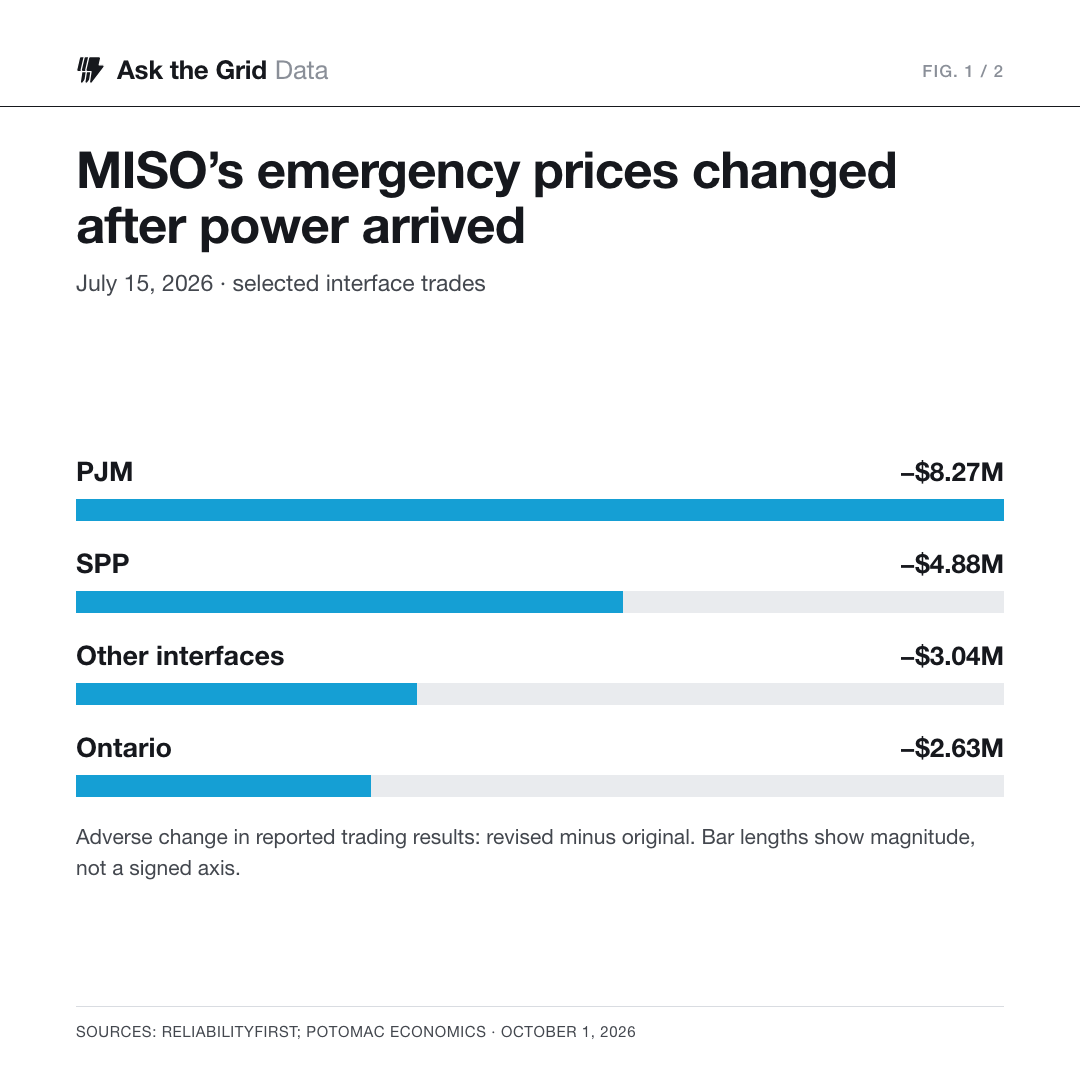
| Ontario | $39,420 | −$2,591,966 | −$2,631,386 |
| PJM | $4,572,762 | −$3,698,480 | −$8,271,242 |
| SPP | $2,674,730 | −$2,203,843 | −$4,878,573 |
| Other interfaces | $1,670,261 | −$1,369,977 | −$3,040,238 |
| Total | $8,957,173 | −$9,864,266 | −$18,821,439 |
Subtracting the original result from the revised result gives an $18.82 million adverse movement across the interfaces in the monitor’s table. PJM accounts for $8.27 million of that change and SPP for $4.88 million. Those are calculations from published trading-result totals; they do not estimate a particular company’s exposure or reconstruct every participant’s settlement.
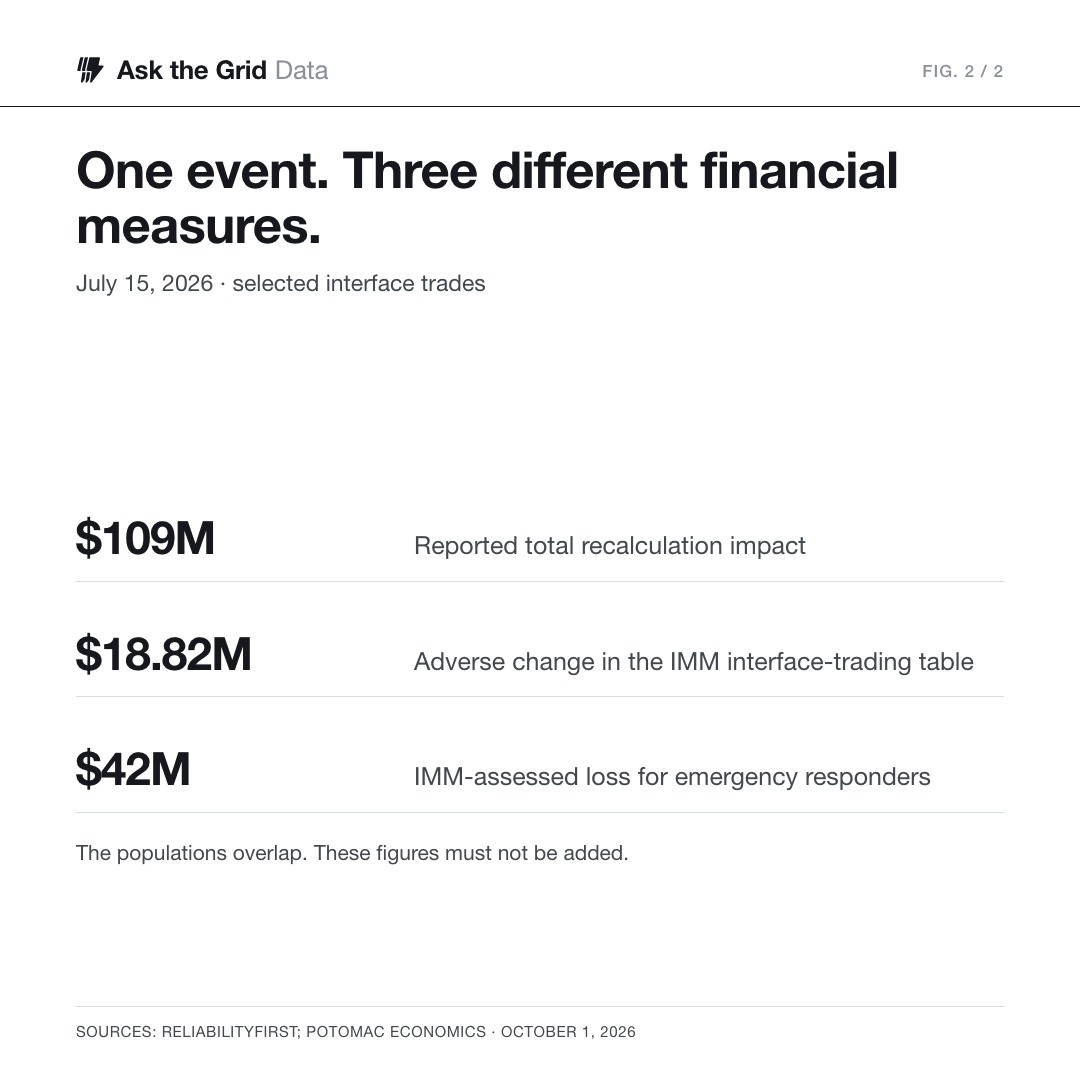
ReliabilityFirst reports a broader $109 million financial impact from MISO’s recalculation. The monitor separately estimates that load, generation and importers that helped respond to the emergency lost $42 million through the revision. Each number covers a different measure. Combining them would double-count effects and obscure what the source actually measured.
| Measure | Amount | Meaning |
|---|---|---|
| MISO recalculation impact | $109 million | Financial impact reported by ReliabilityFirst |
| Selected interface trading result | −$18.82 million change | Original versus revised results in the IMM table |
| Participants responding to emergency | −$42 million | IMM estimate for affected load, generation and importers |
The policy question is about future response#
Potomac Economics says the retroactive changes complied with the tariff while arguing that they harmed confidence in the market. That is the monitor’s assessment. Its concern is that a participant deciding whether to import next time must consider both the current spread and the possibility of later repricing. A corrected price repairs an erroneous settlement input; it cannot undo a dispatch or trading decision already made.
The monitor recommends improvements to LMR scheduling and to treatment of these corrections. MISO’s software fix addresses the reported error. The next test is whether operating procedures, cancellation status and pricing remain aligned during a future emergency, and whether any tariff changes alter how a similar correction would be handled.
Sources and method#
The account uses ReliabilityFirst’s September 24 explanation and Potomac Economics’ October 1 presentation. Interface profit-and-loss changes are revised minus original values from the latter’s table. The scheduled-import chart uses MISO’s reconciled historical hourly publication, with revisions collapsed using FINAL. Historical measurements were retrieved October 14, 2026; they are not archived screenshots of prices visible during the emergency. Explore MISO’s grid or read our PJM maintenance-season reconstruction.