Virginia’s Dominion Zone Fell Below Its Old Median Demand for Just 11 Hours
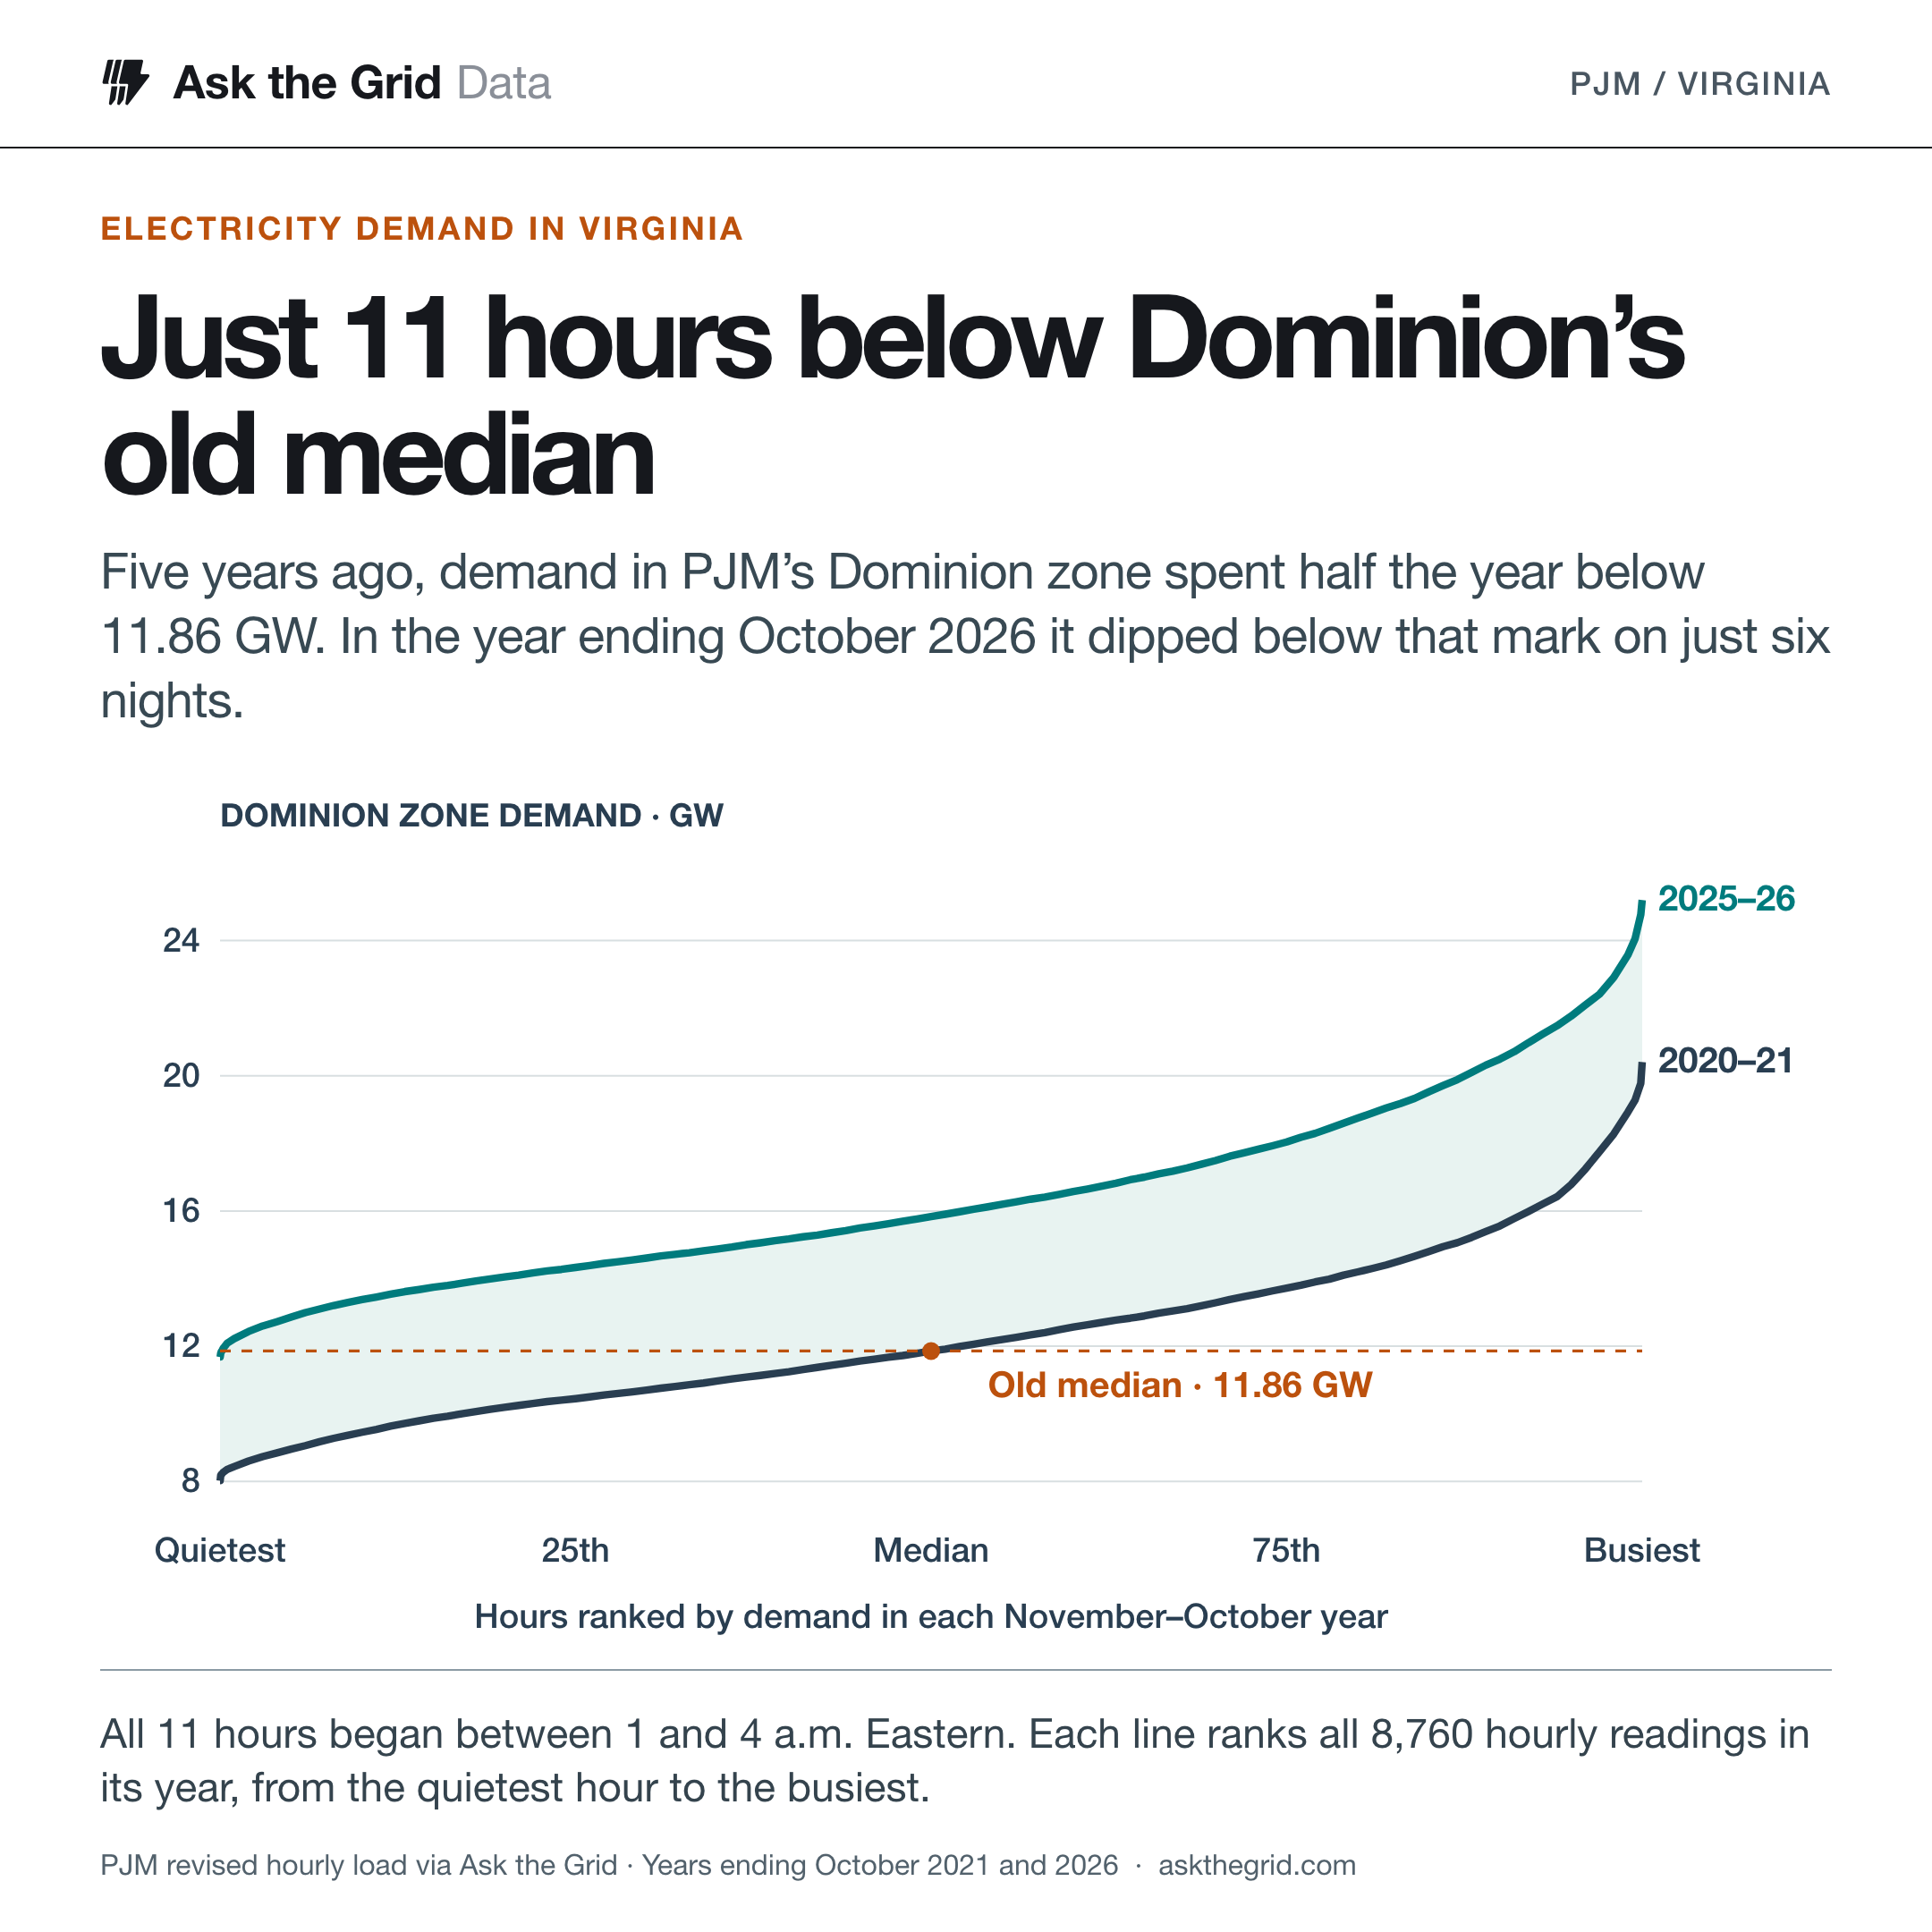
Five years ago, 11.86 GW was a typical hour in the PJM zone that serves Virginia’s data center corridor. In the latest year, it took six quiet nights to find demand that low.
At 3 a.m. on Sunday, November 16, 2025, electricity demand in PJM’s Dominion zone fell to 11,680 megawatts. It was the quietest hour in the year ending October 2026. Five years earlier, demand of 11,857 MW had been unremarkable. It was the median of the entire year.
Ask the Grid checked every hour. In the latest year, the Dominion zone fell below its old median just 11 times in 8,760 hours. Eight of those readings came in November and three in April. Every one began between 1 and 4 a.m. Eastern. From May through October, demand stayed above the old median around the clock. That shift in the low hours helps explain why Virginia’s grid planners are looking so closely at how data centers fill up after they connect.
A quiet hour in 2026 looks like a typical hour in 2021
Demand in PJM’s Dominion zone, gigawatts. Each line ranks 8,760 hourly readings from lowest to highest.
PJM’s revised hourly load, via Ask the Grid. Both years end October 31.
Download chart data (CSV)What counted as a quiet hour changed by nearly 4 GW#
Consider the point near the low end of each curve where 5% of hours draw less power. It rose from 8.96 GW to 12.86 GW, a gain of 3.91 GW. At the busy end, the 95th percentile climbed from 16.78 GW to 21.76 GW. Peak conditions got more demanding, and the network carried more power through the rest of the year too.
The old benchmark disappeared gradually. The zone spent 2,677 hours below it in the year ending October 2023, 1,505 the following year and 578 a year later. The conclusion also holds against a more recent reference point. The zone fell below its 2023 median for only 344 hours in the latest year.
How often did demand fall below an earlier year’s median?
Choose a year ending October 31. Its median becomes the benchmark for every bar.
Benchmark for 2021: 11,857 MW
Each track spans a full year of hourly readings. The year ending October 2024 has 8,784 hours. The others have 8,760.
Download benchmark data (CSV)PJM revised hourly load. Each bar shows the share of that November–October year below the selected benchmark.
The shift was uneven across PJM. Over the same five years, the low-demand threshold rose 44% in Dominion, 23% in AEP and 3% in ComEd. These readings cover all customers in each operating area. Weather, electrification and changes in the mix of customers also affect them. Measuring data centers’ own demand takes another set of meters.
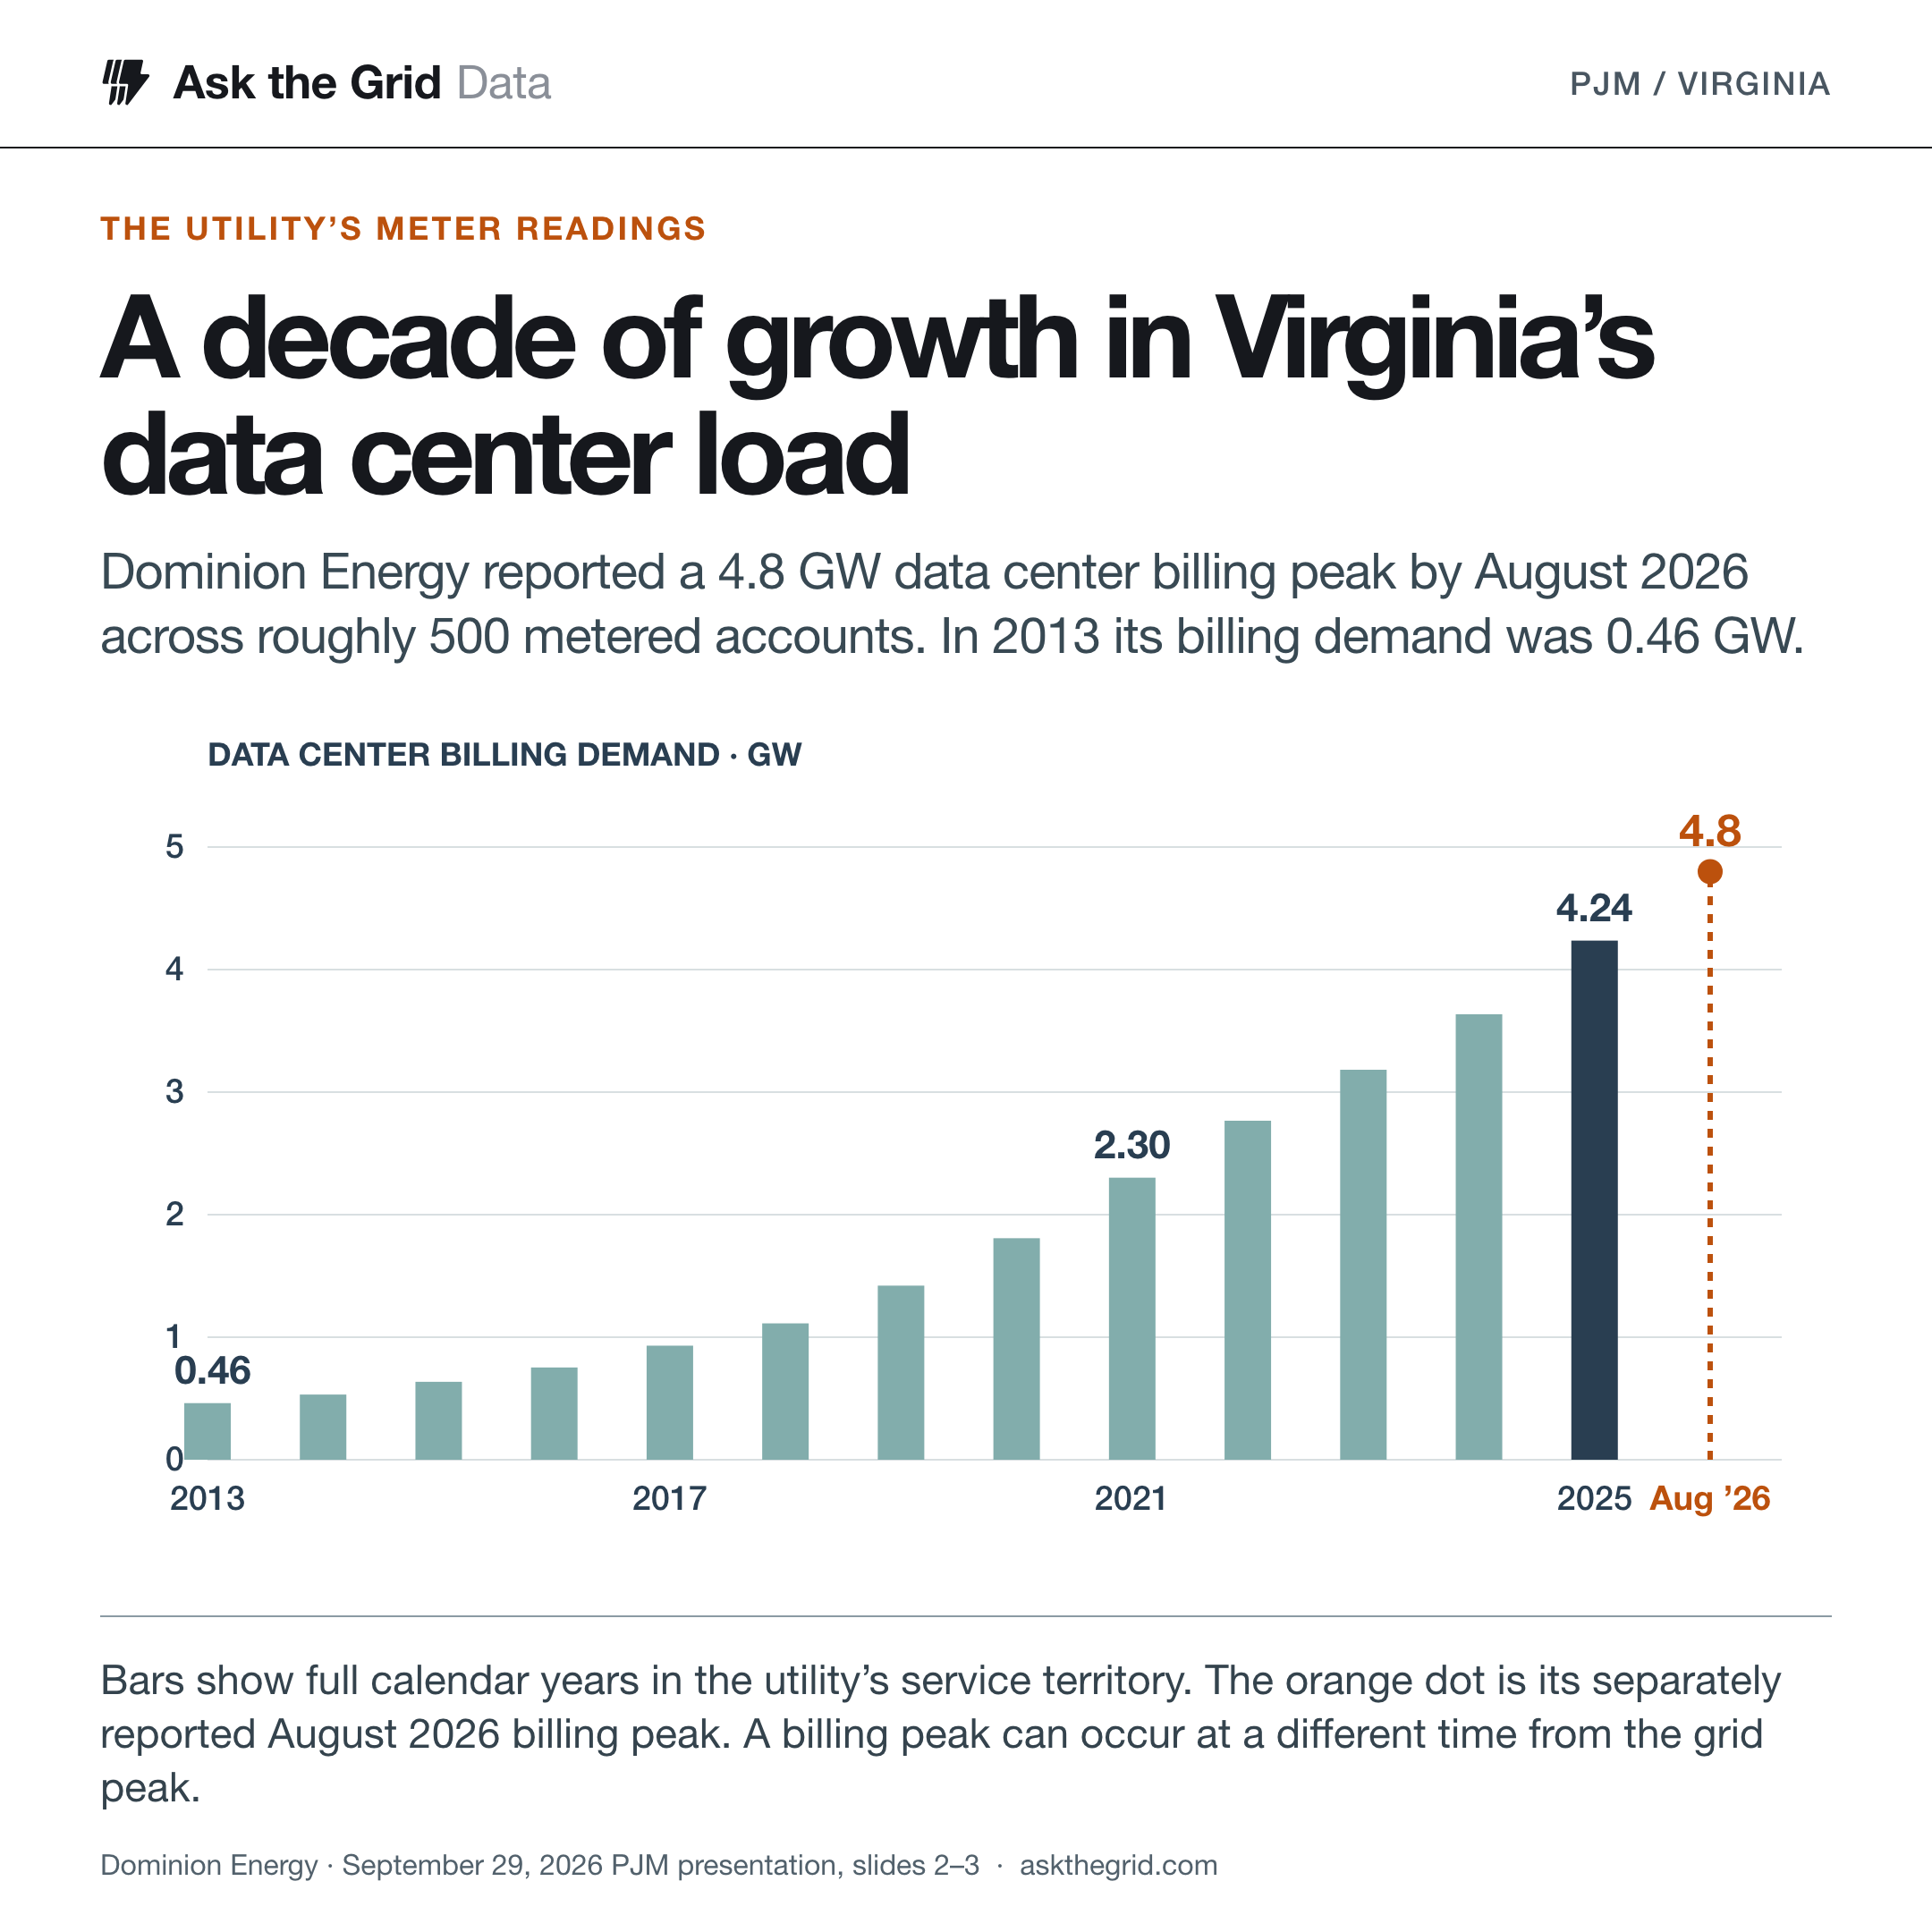
Dominion’s data center meters show a 4.8 GW billing peak#

Dominion Energy Virginia reported that its data center billing demand grew from 462 MW in 2013 to 2,302 MW in 2021 and 4,237 MW in 2025. By August 2026 the billing peak had reached 4.8 GW. The utility counted roughly 500 metered accounts across 55 connected data center companies. Dominion’s September submission to PJM, slides 2–3.
Billing peaks can fall at different times across facilities. For 2025, Dominion separately reported 3,999 MW of coincident data center demand, which counts the facilities at the same time. Its utility customers are one part of the broader PJM zone. The two records show growth at different scales and cannot apportion the zone’s extra overnight megawatts among customers.
Data center billing demand crossed 4 GW in 2025
Data center billing demand in the utility’s service territory, gigawatts.
Dominion Energy, September 29, 2026. The August 2026 observation covers part of a calendar year.
Download chart data (CSV)What a new connection adds in year four#
For the next campus, timing matters as much as the size of the connection. Dominion uses 13 years of operating data to project billed demand from the date a facility receives power. Its September submission described a five-year industry-average ramp to 63% of contracted capacity. Dominion’s forecast assumptions, slides 5 and 7.
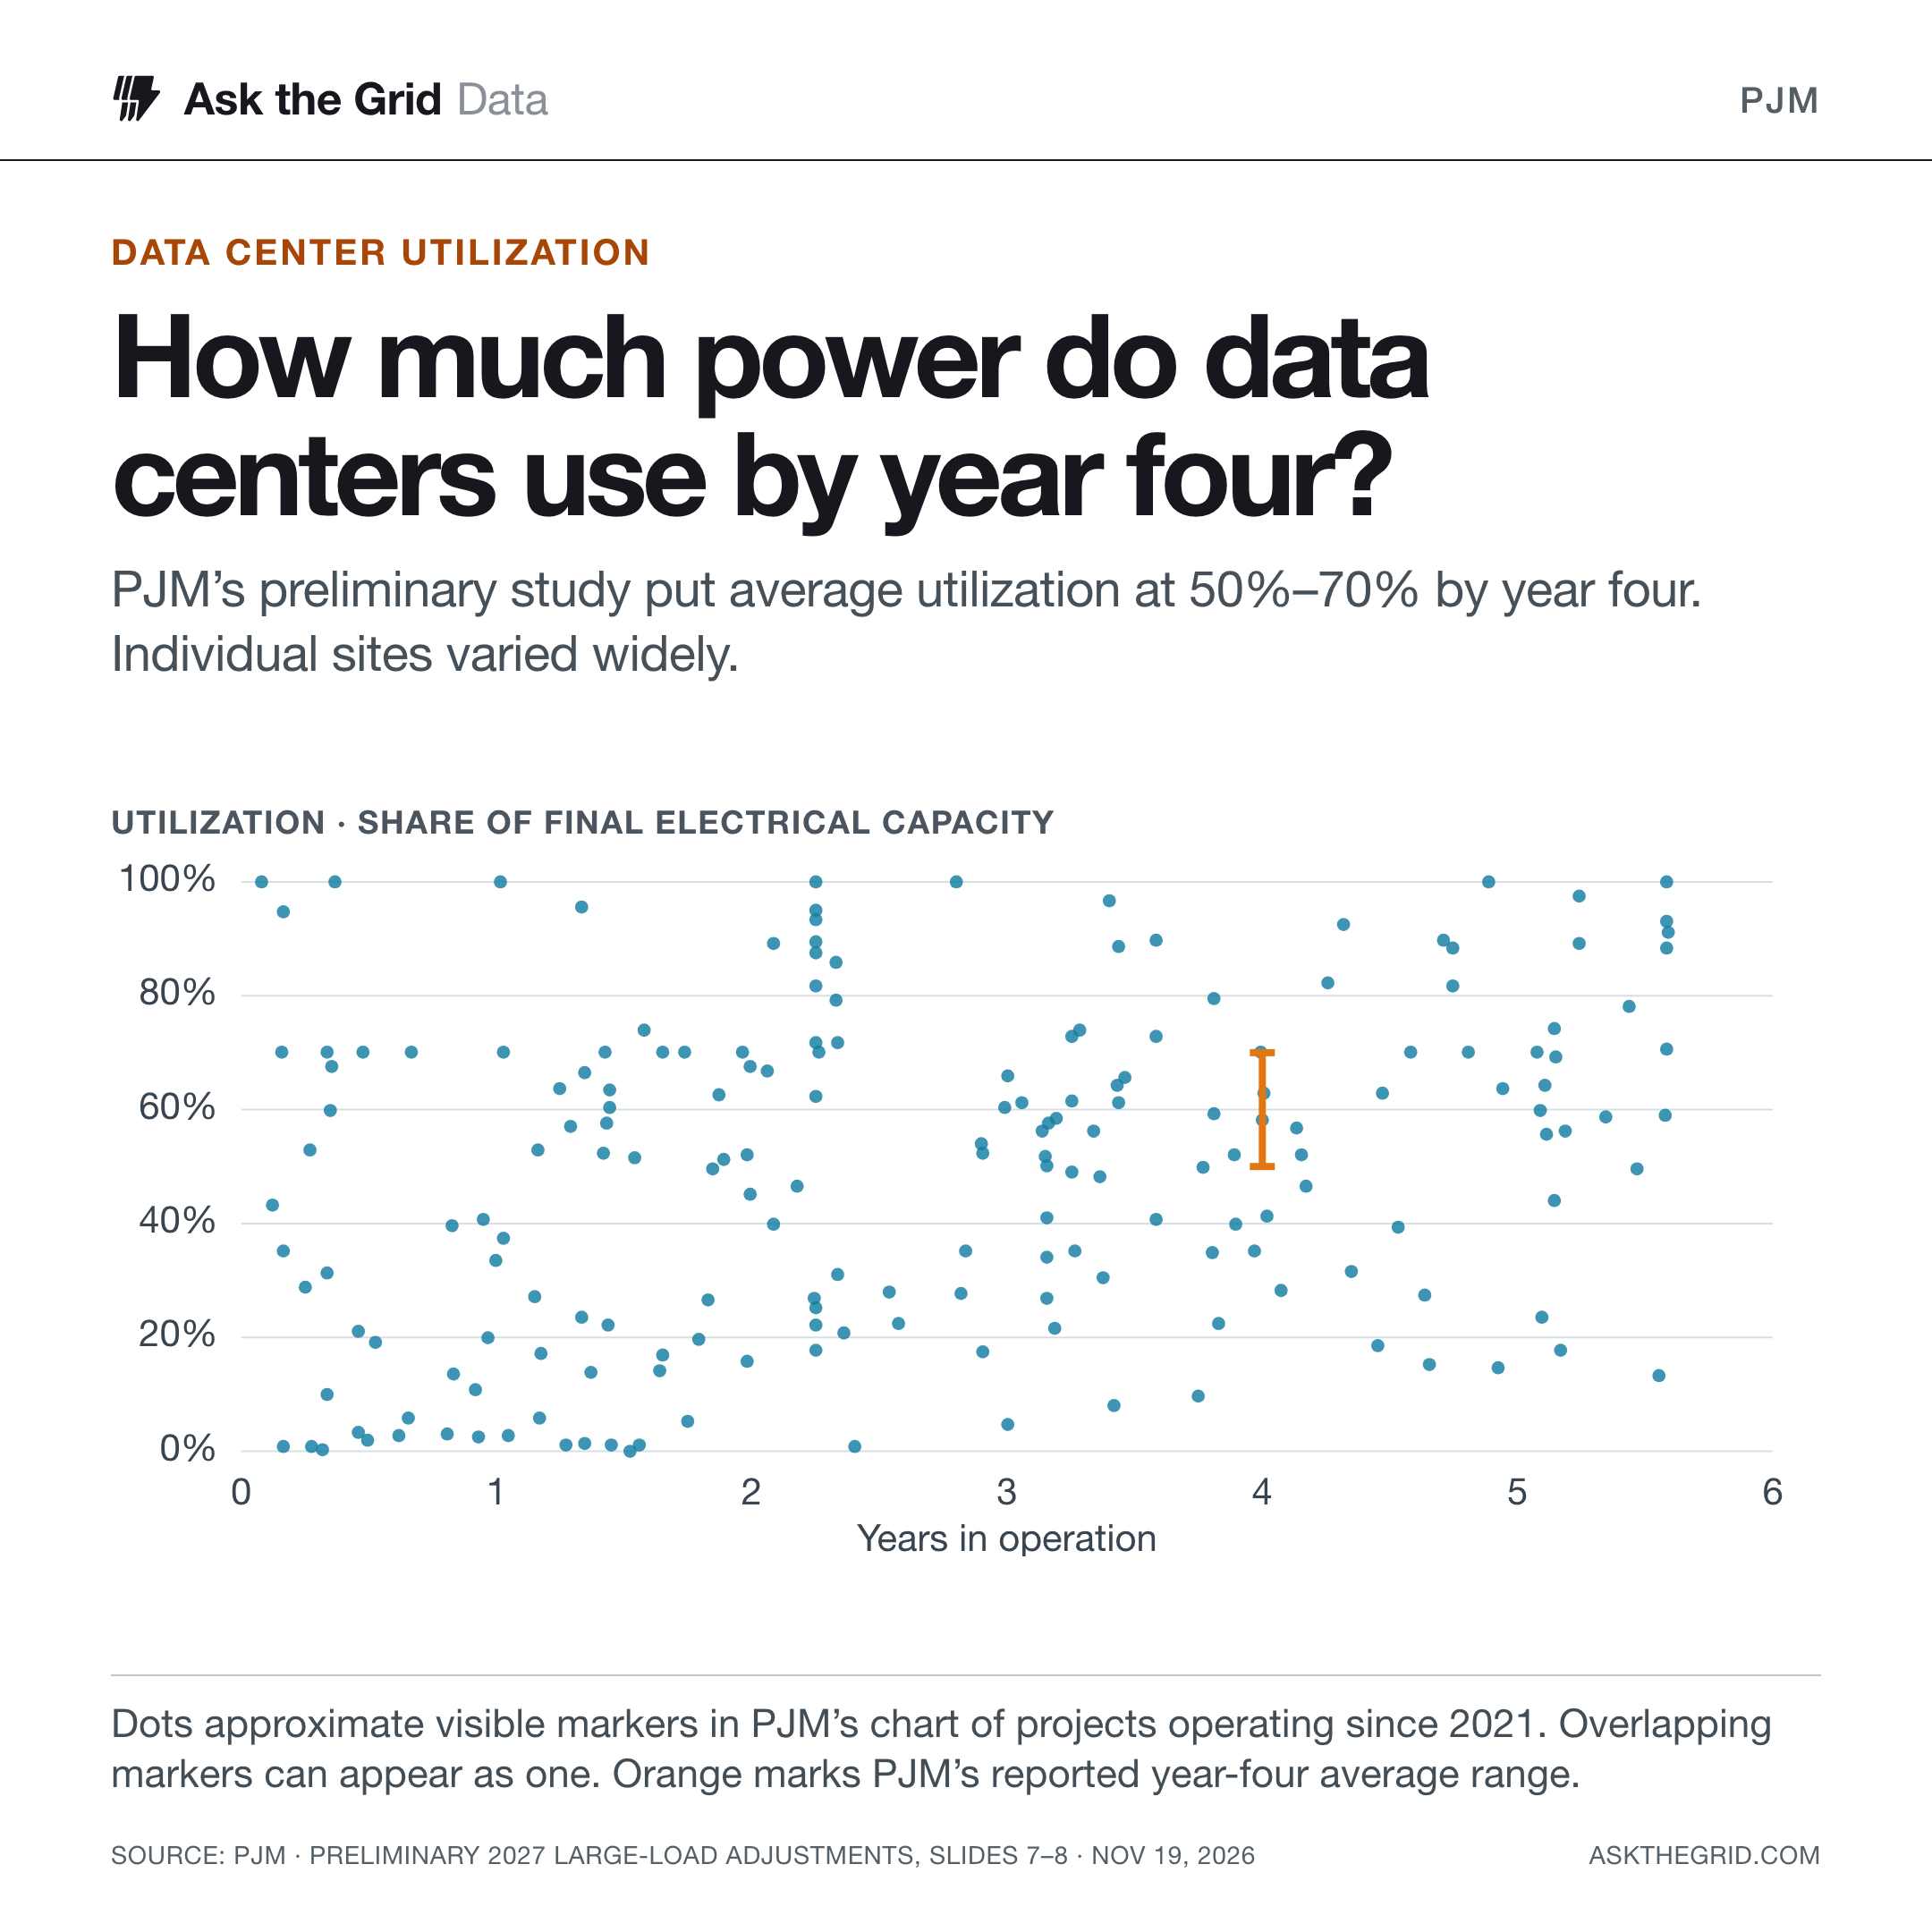
PJM examined this across its own footprint. In preliminary materials posted November 19, staff compared operating age and current demand for more than 200 projects that came online since 2021. They put average utilization at 50% to 70% by year four. Just beyond year five, individual points still ranged from below 20% to above 90%. The 70% figure also appears as a default assumption in PJM’s published 2026 forecast. PJM’s 2026 methodology.
By November 21, PJM had canceled the November 24 meeting and removed the slides from its listing. The year-four finding remains preliminary. PJM’s meeting record · The chart as posted November 20.
A planner in Ashburn needs both views. The hourly record shows the load the regional network already carries on a quiet Sunday morning. The campus’s energization date, contract and metered ramp help determine how much another connection will add to that morning in years to come.
Sources and calculations
Ask the Grid grouped PJM’s revised hourly load by operating area and UTC hour, keeping the latest available revision at the November 21 cutoff. Each comparison runs from November 1 at midnight Eastern through the end of October 31. All six years have complete hourly coverage for the areas compared. Percentiles are exact ranks. The 11-hour count uses the unrounded 11,857 MW threshold. Total-area loads are unadjusted for weather. PJM Data Miner · EIA’s analysis of Virginia electricity sales.