Sutton’s Two Grid Zones Drew Less Than 900 MW Combined in 46 Hours
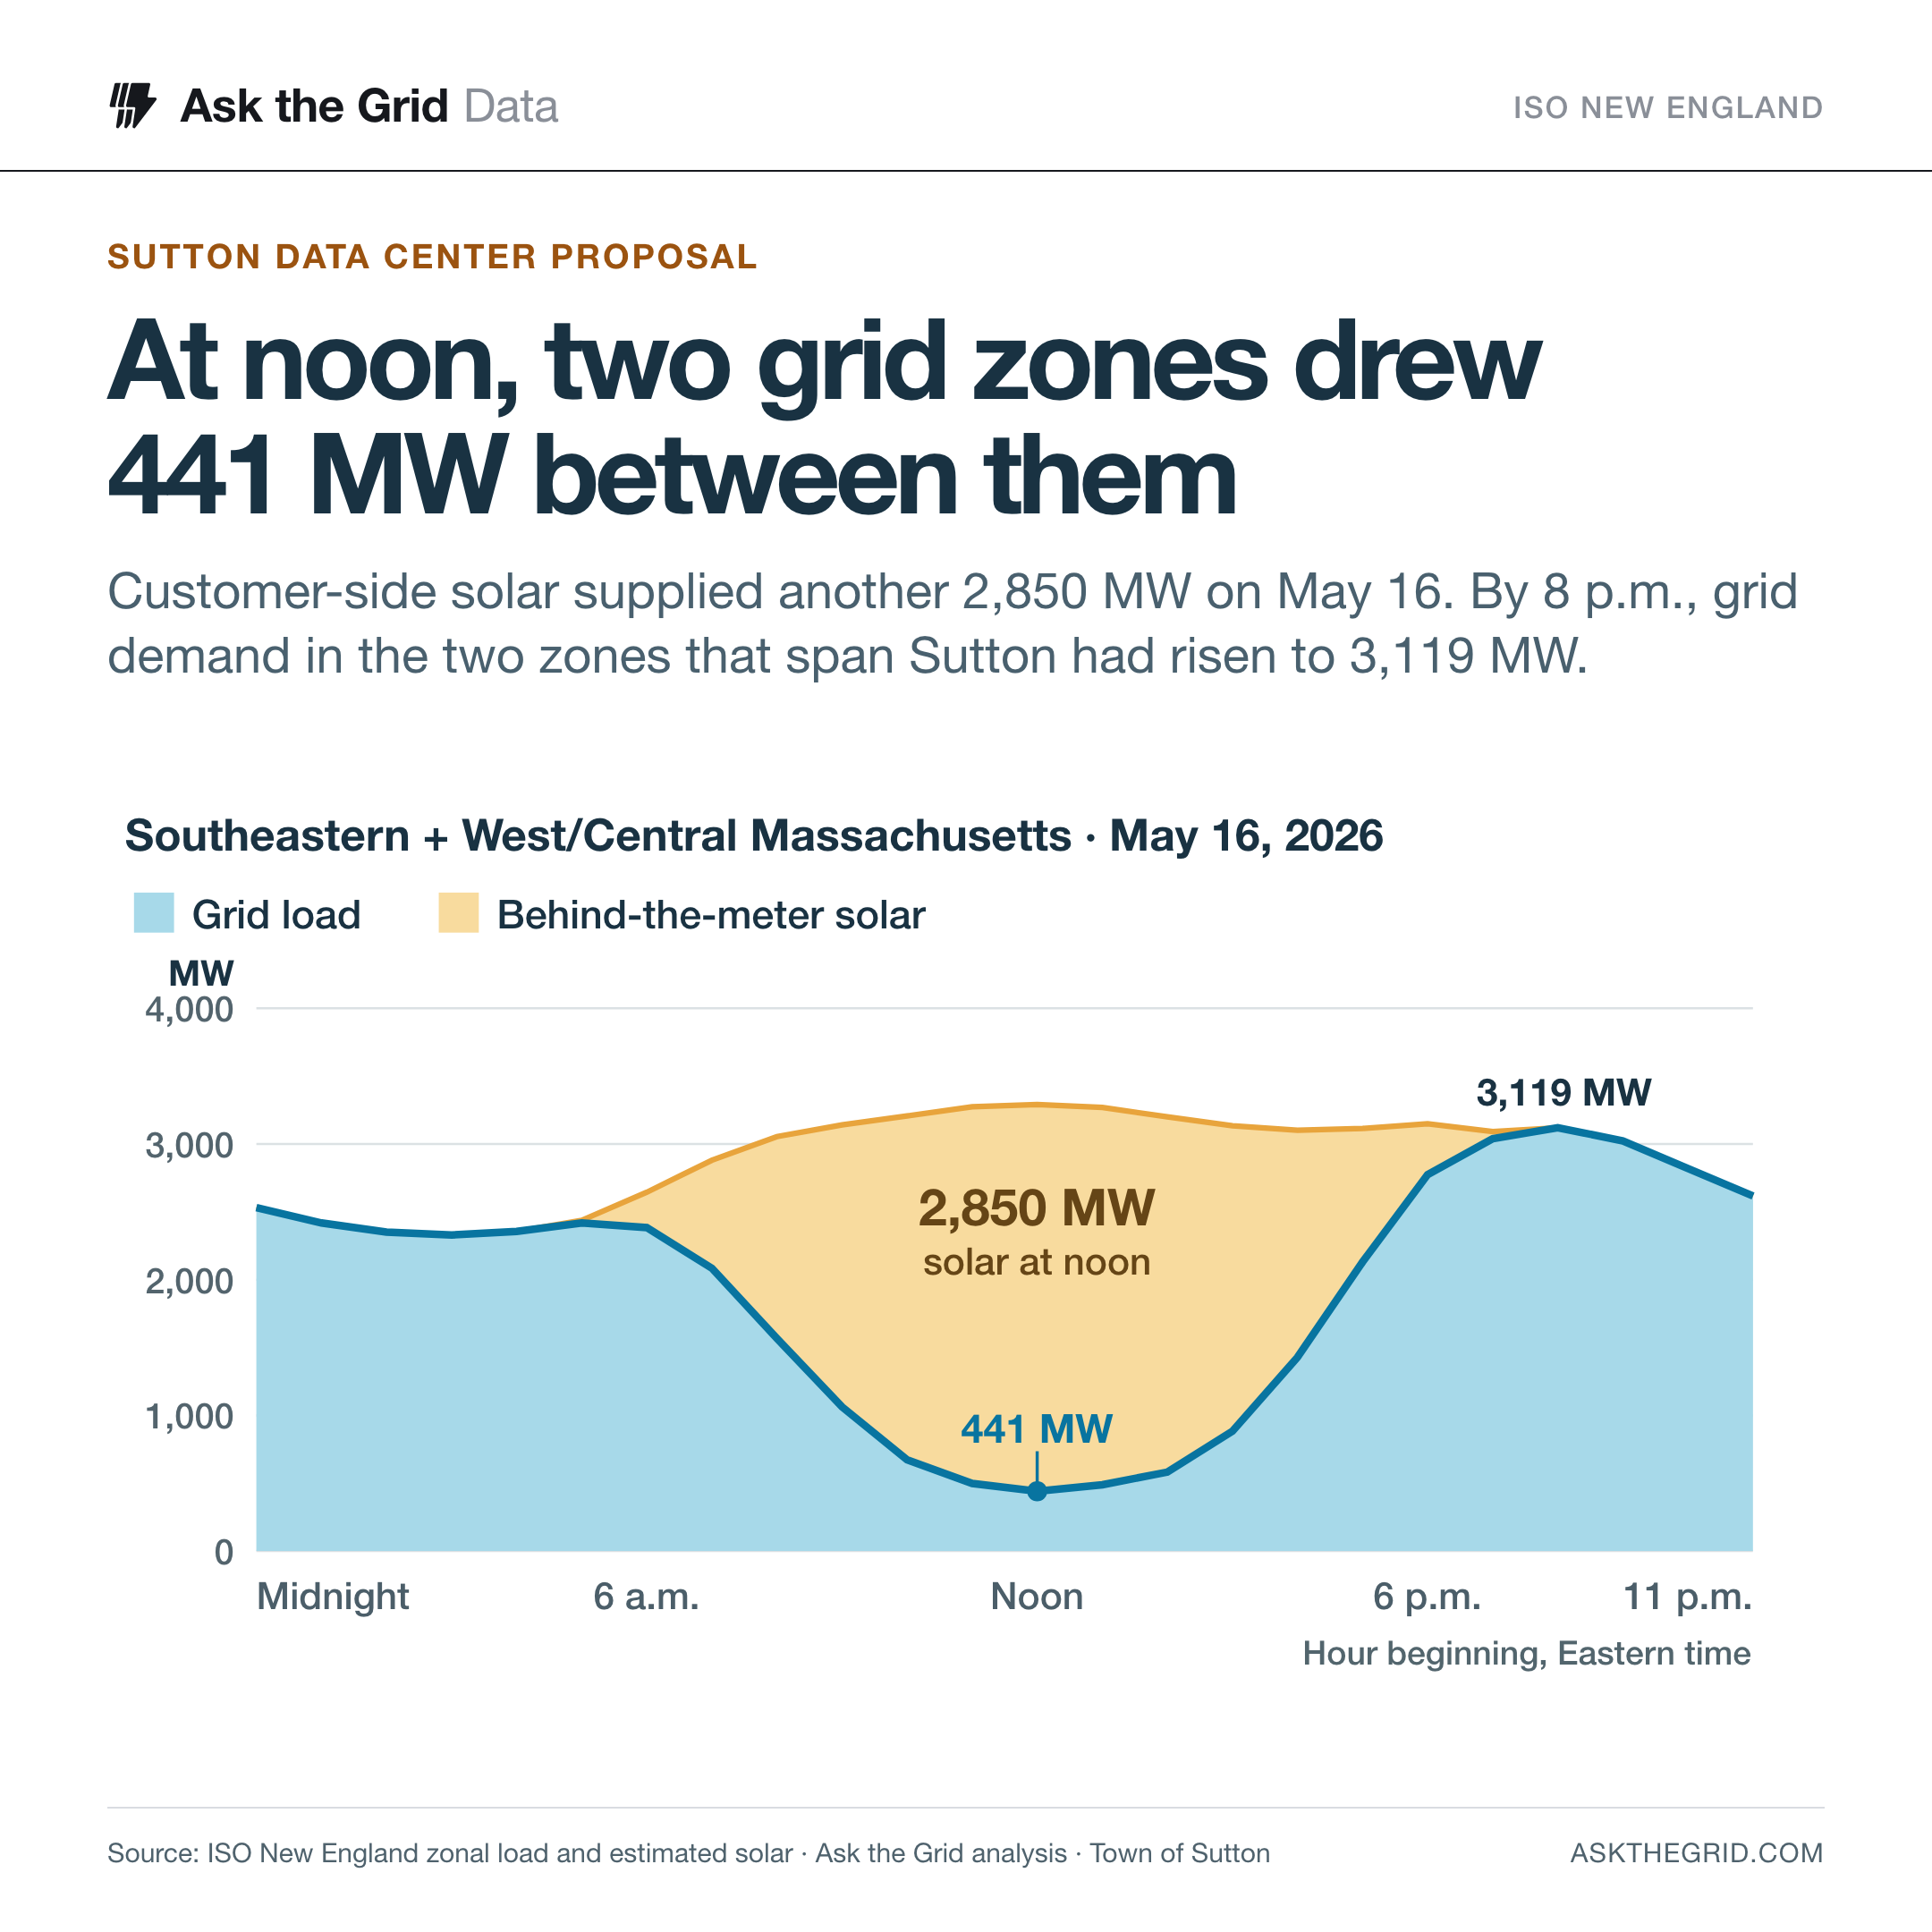
Developers estimate 180 MW for the first two buildings of a proposed data center and 900 MW for all ten. On May 16, the two zones that meet in Sutton drew 441 MW combined at noon and 3,119 MW at 8 p.m.
At noon on May 16, the two electricity zones that meet in Sutton, Massachusetts, drew 441 megawatts combined from the regional grid. Solar on the customer side of the meter supplied an estimated 2,850 MW. By 8 p.m., the solar contribution was gone. The same two zones drew 3,119 MW from the grid. ISO New England’s zonal observations · Sutton Power Choice zone listings
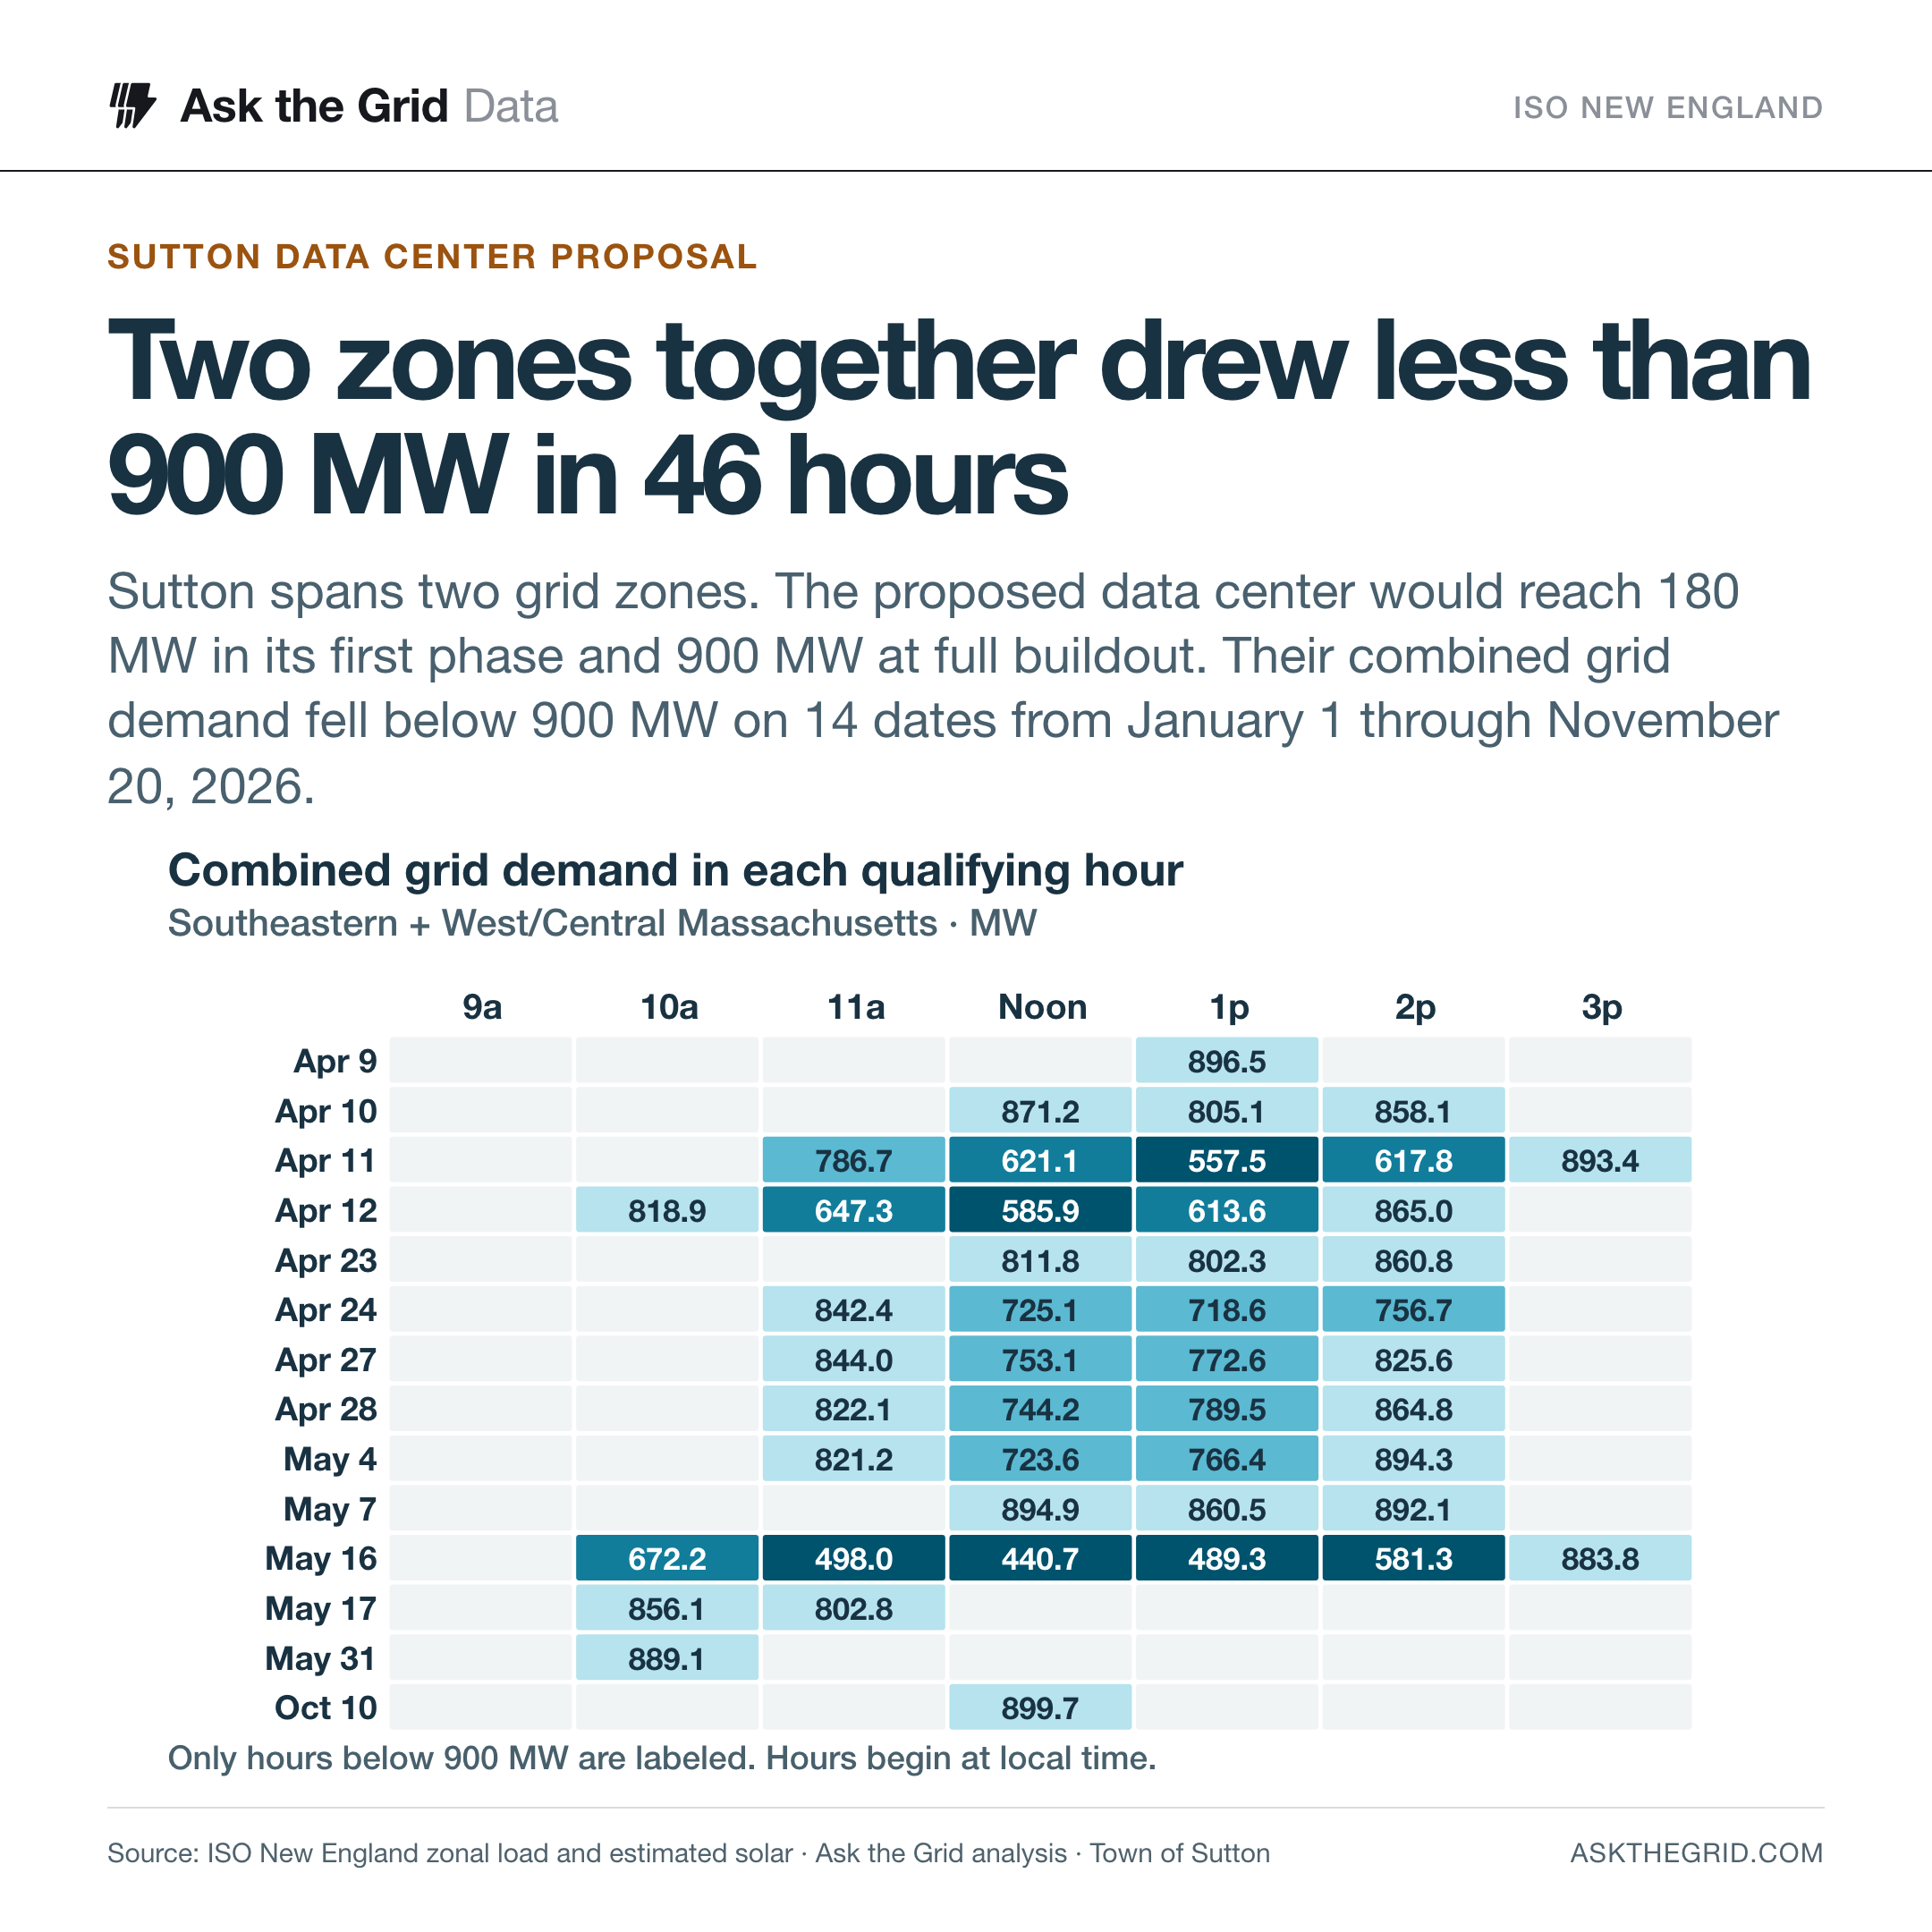
Six months later, about 75 residents came to Sutton’s Planning Board as it discussed how to zone for data centers. Unified Global Packaging Group and The Kraft Group want to build two data center buildings at Unified Parkway by the end of 2029. They estimate 90 MW apiece. If all ten planned buildings go up, the developers put demand at 900 MW. Ask the Grid found 46 hours on 14 dates this year when grid demand across Southeastern and West/Central Massachusetts added together was below that figure. Town project file · WBUR’s meeting coverage · Ask the Grid hourly load
Where the electricity went at noon#

May 16 was a Saturday. West/Central Massachusetts drew 189 MW at noon and Southeastern Massachusetts drew 251 MW. Each was at its lowest hourly reading in the study. Adding back the estimated solar brings total use across the two zones to about 3,291 MW on the ISO’s reporting basis. Much of the electricity people used that afternoon never showed up as demand on the regional grid.
What matters to Sutton is what happens at the other end of the day. At 8 p.m., West/Central Massachusetts drew 1,643 MW and Southeastern Massachusetts drew 1,476 MW. A utility assessing service for a new customer at Unified Parkway would need to know how much that customer plans to draw after sunset, and which lines and substations could carry it.
The 14 dates when both zones together drew less than 900 MW#

Thirteen dates were in April or May. The exception was October 10, when the combined reading for the noon hour was 899.7 MW. Every one of the 46 hours started between 10 a.m. and 3 p.m. Eastern. Counting each zone separately gives a different result. West/Central drew less than 900 MW in 536 recorded hours and Southeastern did so in 564. In 436 hours, each was below 900 MW at the same time. Only 46 met the stricter test of their sum falling below 900 MW.
Two buildings come before ten#
Residents raised concerns at the November 16 meeting about the environment, public health and home values, WBUR reported. Sutton Power Choice lists industrial customers in both zones. The town’s project file lists no applications or negotiated agreements. Its conceptual plan shows substations and existing transmission lines, while the timing and source of electric service are still open. The available documents do not establish which zone would serve the campus. WBUR’s meeting coverage · Sutton industrial power rates · Town site plan and review timeline
One Massachusetts computing center illustrates why phasing matters. In Holyoke, five university partners announced in 2022 that they would invest more than $5 million to add capacity for several thousand servers inside their existing research computing center. They used space designed for expansion years earlier. In Sutton, each proposed addition of two buildings would represent another 180 MW on the developer’s figures. Holyoke computing center announcement · Sutton project phases
Sutton’s published process calls for an independent review of the power supply, paid for by the developer. Residents could use the first two buildings’ expected hourly and seasonal demand to judge when the campus would need the most power. The utility’s assessment of the upgrades each phase requires would tell them what the existing lines can serve. The town says the findings would go to Town Meeting. Sutton’s technical review process
Data and method
Ask the Grid paired ISO New England’s Southeastern Massachusetts and West/Central Massachusetts hourly grid-load estimates by timestamp. 7,723 of 7,776 elapsed hours had readings for both zones. We added the unrounded pair in each hour before testing whether the result was strictly below 900 MW. The low and high values refer to observed hourly averages. The estimates exclude customer-side solar, reconstituted dispatched demand response and demand to operate storage. For the May 16 chart, we paired the latest available revisions to ISO-NE’s five-minute zonal load and solar observations. All 288 interval timestamps had both zones. ATG hourly load · ATG five-minute zonal observations · ISO-NE report definition
| Hour beginning (ET) | Grid load (MW) | Behind-the-meter solar (MW) |
|---|---|---|
| 8 a.m. | 1,568 | 1,487 |
| Noon | 441 | 2,850 |
| 4 p.m. | 1,428 | 1,675 |
| 8 p.m. | 3,119 | 0 |
Download the chart data as CSV files. May 16 hourly grid and solar · All 46 hours below 900 MW · Monthly coverage by local clock hour