How Texas Measures Data Center Power, From Abilene to the Grid
Abilene’s Stargate campus shows how a project ramps up. ERCOT’s operating records show how much the time of day can change what the grid actually serves.
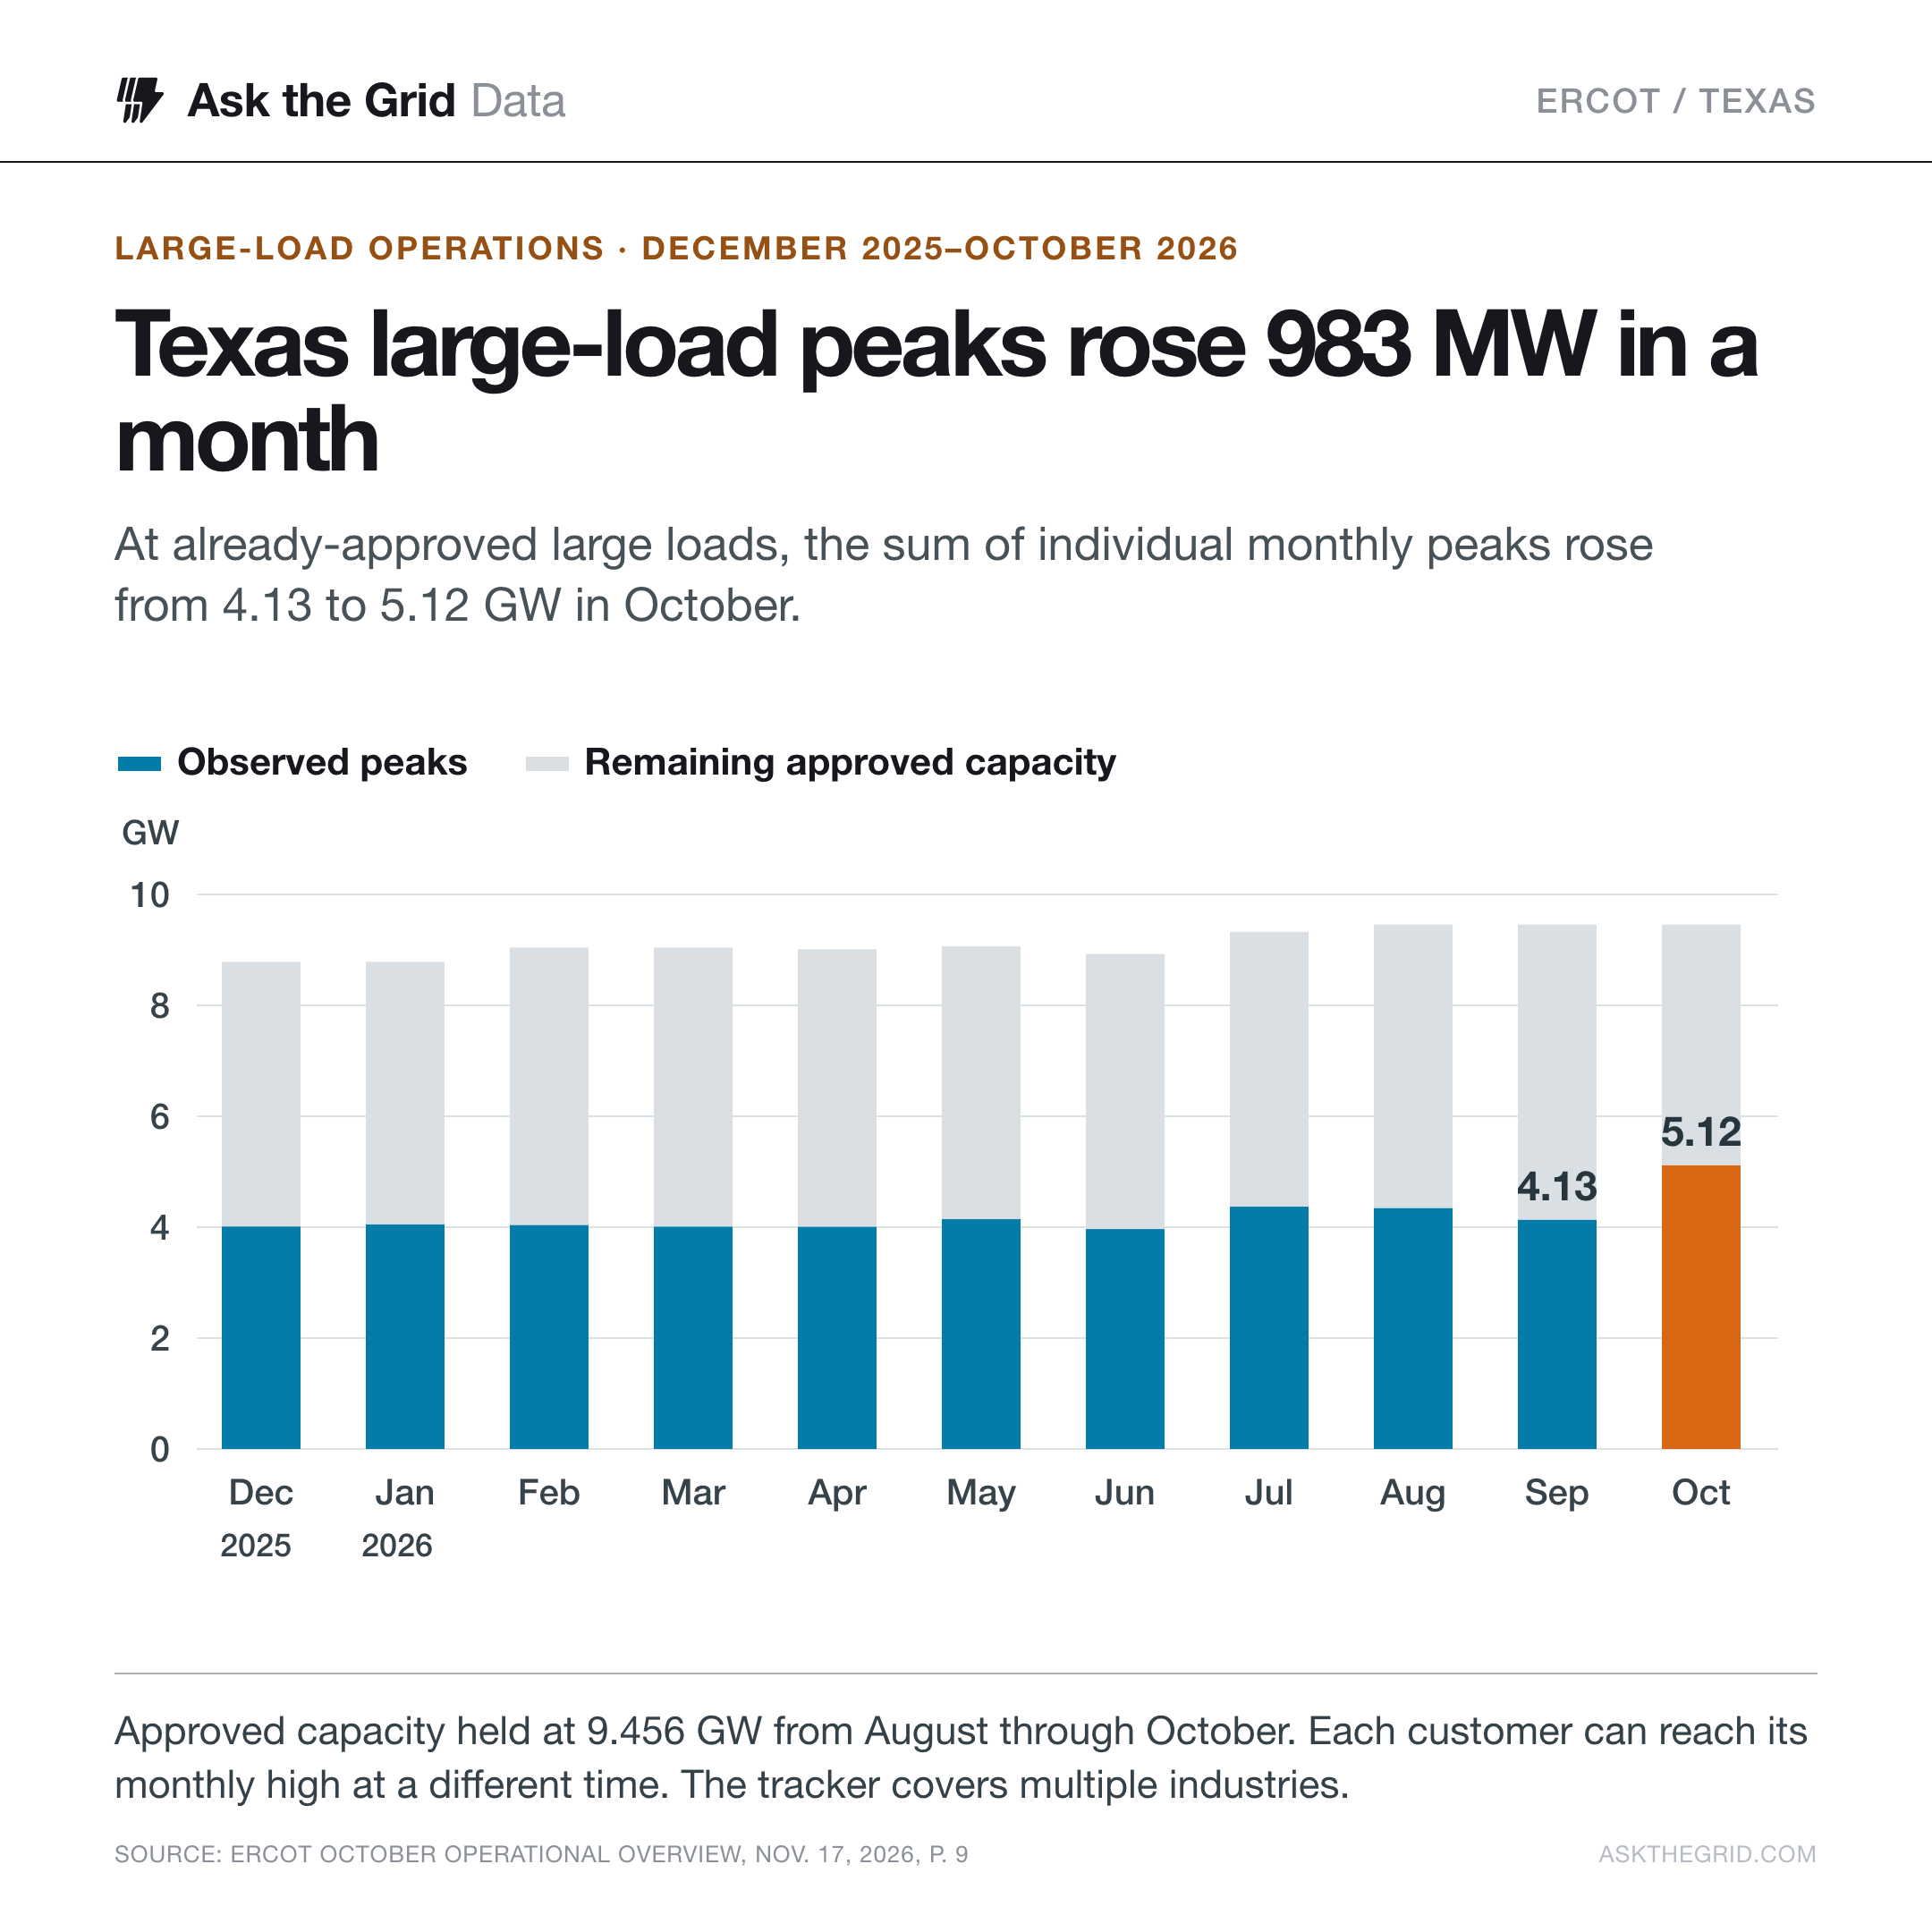
In Abilene, Oracle delivered six of eight Stargate buildings to its customer by September. In ERCOT’s control room, a different milestone arrived in October. The grid operator had authorized the same 9,456 MW of large loads to energize as in September, but the sum of those loads’ monthly peaks rose 983 MW. Almost a gigawatt of additional demand became visible on that measure in one month, without an increase in the approved total. Oracle earnings call · ERCOT October operating report.
The scale of what could follow is far larger. Developers of 429 data center projects told ERCOT they wanted 177.4 GW of connection capacity. For grid planners, a campus’s ultimate size is only the beginning. When does each building start drawing electricity? How much will it draw during the hour the rest of Texas needs the most power? ERCOT data center survey.
What went live in Abilene#
Crusoe announced the first phase of Stargate Abilene was running on Oracle’s cloud in September 2025. A year later, Oracle co-CEO Clay Magouyrk reported that six buildings representing 618 MW had been delivered to the customer. Oracle says the campus connects directly to ERCOT. A building handover gives the customer capacity to run its computers. Measuring what those computers drew during a particular hour requires a meter reading. Crusoe’s first-phase announcement · Oracle’s campus description · September 10 earnings call.
The Abilene campus from orbit
 November 23, 2023
 November 17, 2026
Epoch AI used construction imagery and the time earlier buildings took to open to estimate that Abilene’s last two buildings would be operational around November 1. Its estimate brings the eight-building campus to 824 MW of IT capacity. Oracle’s September handover supplies the company-confirmed checkpoint. The two satellite views document the physical buildout across three years. Neither the roofs nor the commissioning estimates reveal the hourly electricity drawn from ERCOT. Epoch AI’s Abilene timeline · Ask the Grid’s Abilene campus file.
At another West Texas campus, Galaxy’s Helios, the developer disclosed both sides of the first delivery. CoreWeave received 133 MW of critical IT capacity for computers, backed by about 200 MW of gross facility power. Cooling and other systems also need electricity. Across three phases the lease covers 800 MW gross, while the campus has 1,630 MW of approved power capacity. Those figures describe successive business and engineering commitments. Galaxy reported a full quarter of revenue from Phase I in September. Galaxy’s delivery announcement · third-quarter results.
The approved total held steady as meters moved#
ERCOT’s October operating report tracks large loads that already have permission to energize. For each load, ERCOT takes its highest consumption during the month, then adds those individual highs together. From January through September, that measure stayed between 3.97 and 4.37 GW. In October it reached 5.12 GW, a 23.8% jump from September. The tracker covers large loads across industries. It does not identify how much of that jump came from data centers or from either named campus. ERCOT’s October reporting vintage.
How much approved power appeared on meters?
ERCOT’s approved total and the sum of individual monthly peaks, December 2025 to October 2026.
5,115 MW observed · 9,456 MW approved · 54.1% of approved capacity
ERCOT October 2026 Monthly Operational Overview, November 17, slide 9. The tracker covers approved large loads across industries. Peaks can fall on different days.
The same 502 loads drew 1.82 GW more on the second peak day#
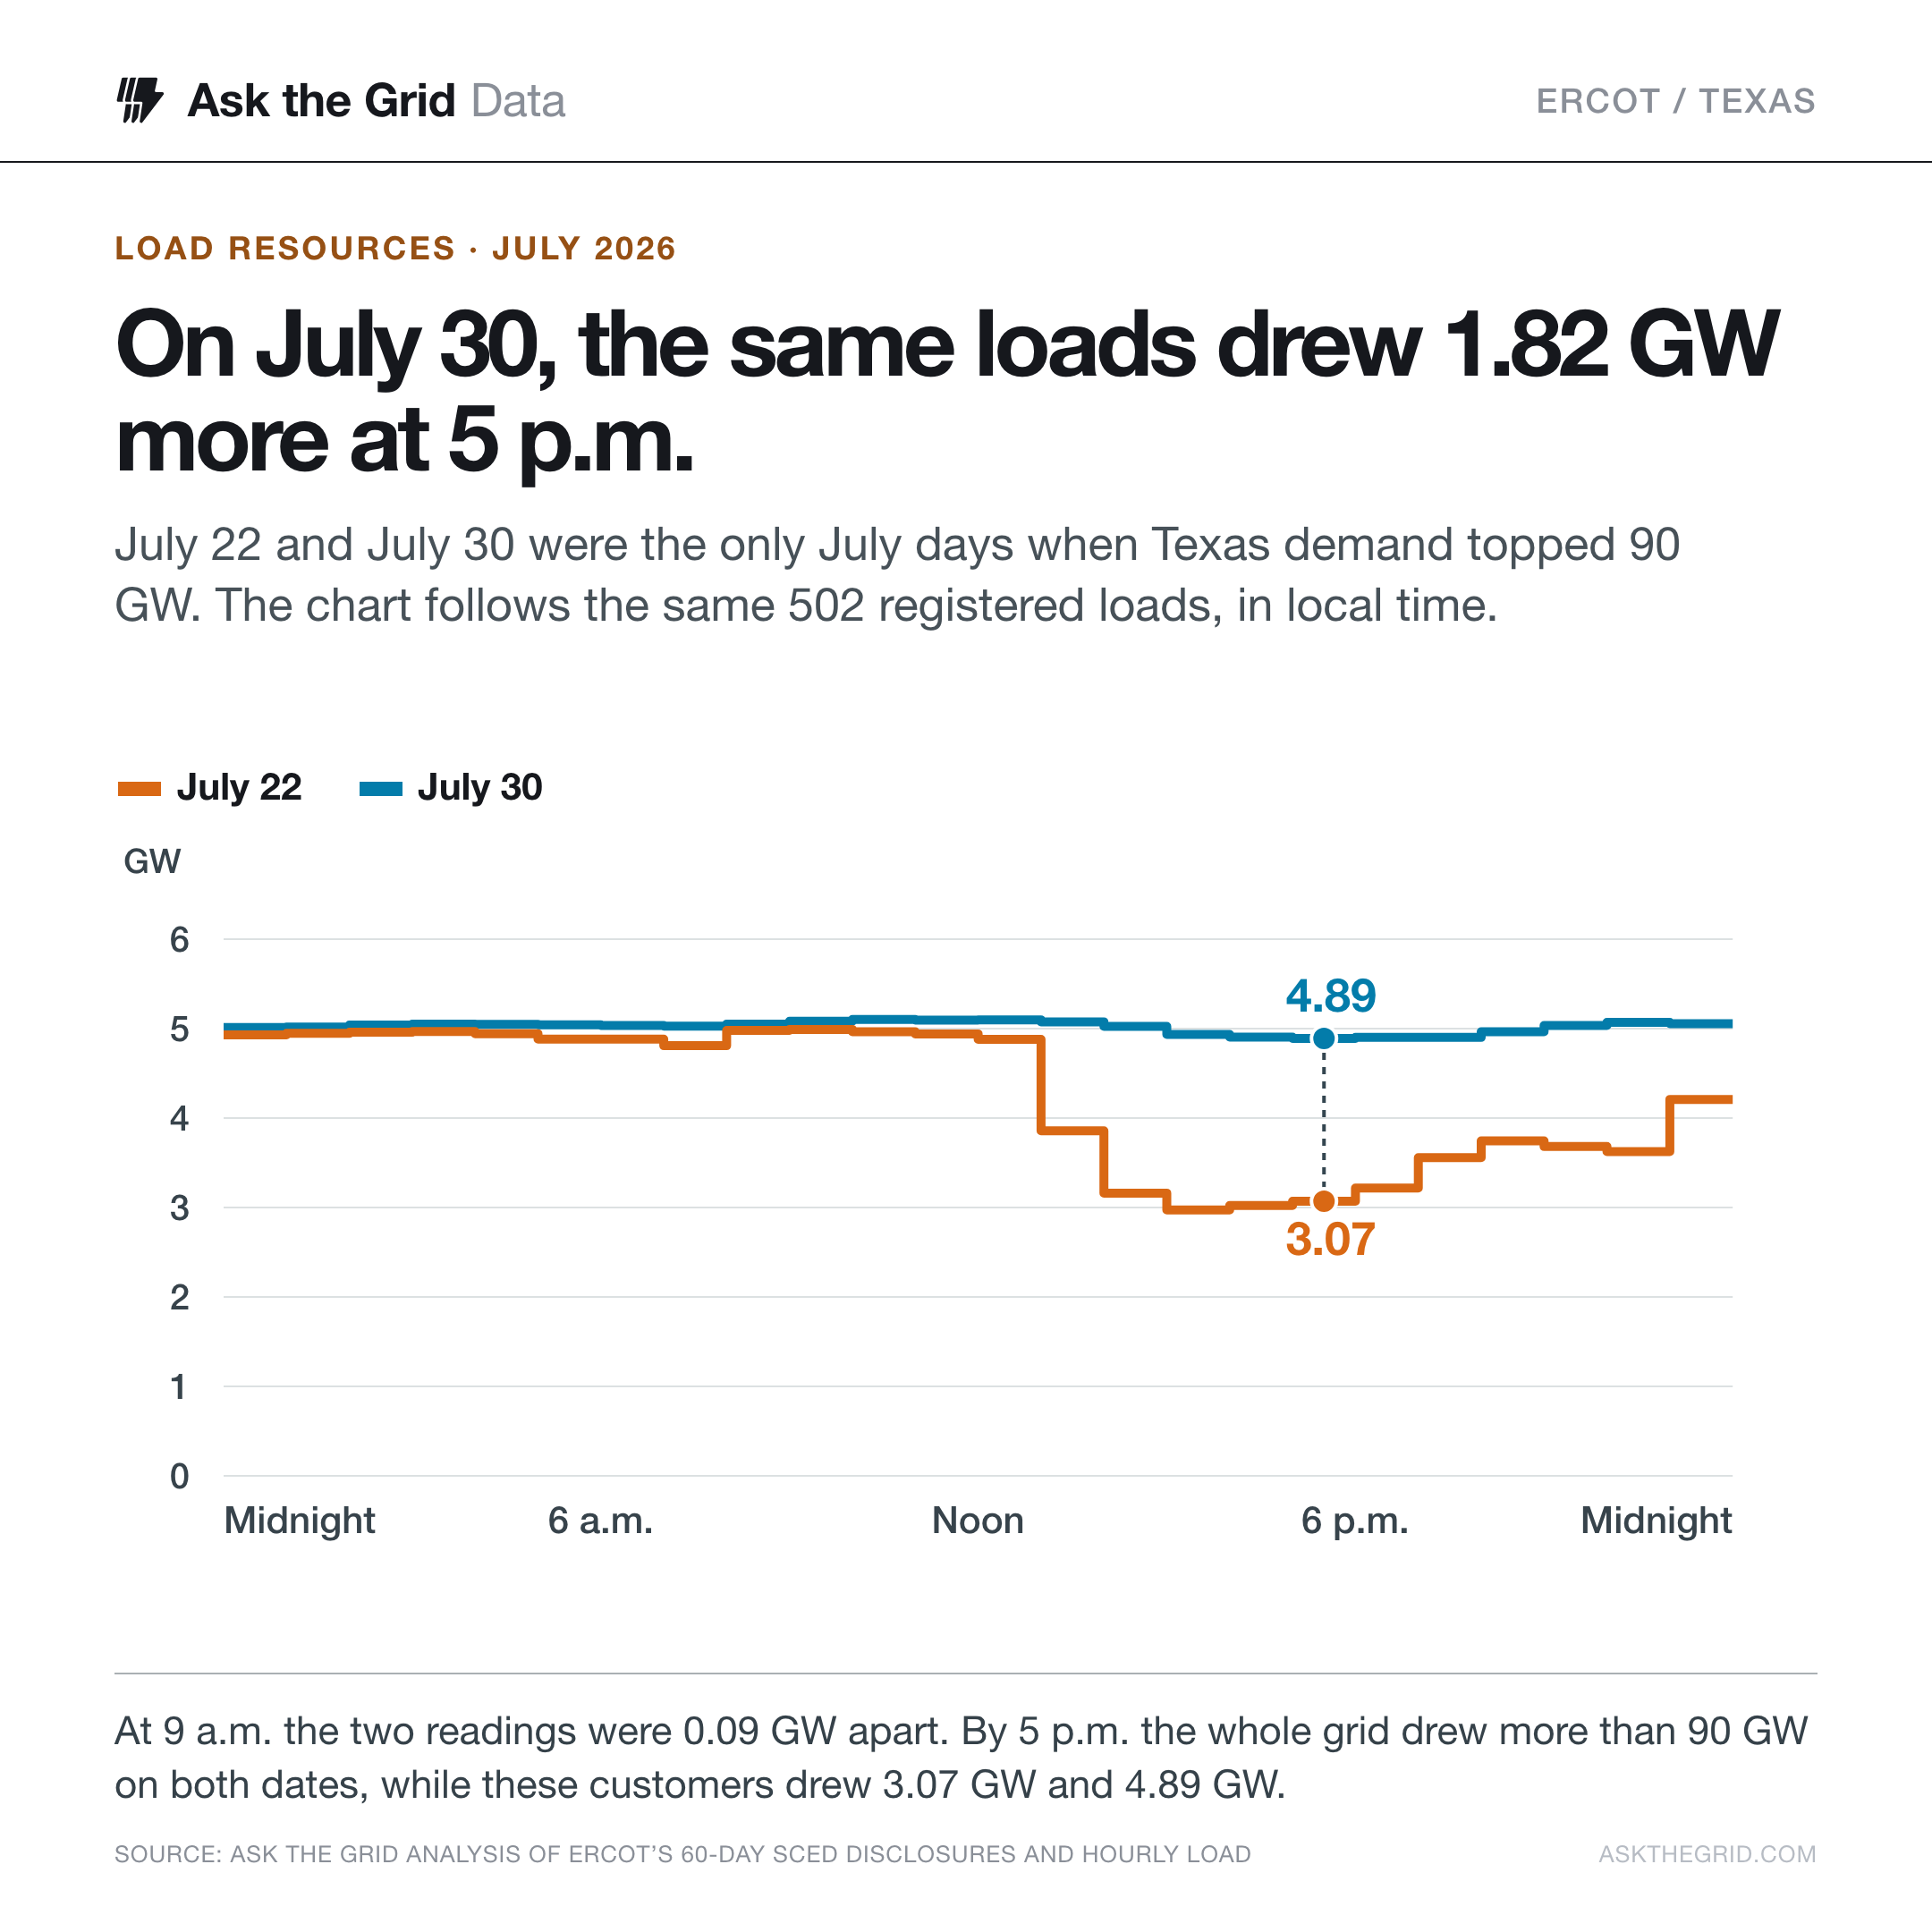
A second ERCOT record lets us compare electricity use at the same hour. It covers registered load resources, electricity users qualified to participate in demand response or ancillary services. Ask the Grid matched 502 resources that reported consumption on both July 22 and July 30, the only two July days on which the hourly system series exceeded 90 GW. This group spans registered market participants. Its behavior gives an operating example for planners considering flexible service for new campuses. ERCOT load resource program · public dispatch disclosures.
Two Texas peak days, hour by hour
Compare the same 502 registered load resources on both dates, or switch to all electricity demand on the ERCOT grid.
5 p.m. · July 22 3.07 GW · July 30 4.89 GW
Ask the Grid analysis of ERCOT hourly system demand and 60-day dispatch disclosures for July 22 and 30. All hours are Central Daylight Time.
At 9 a.m., the group drew 4.99 GW on July 22 and 5.08 GW on July 30. By the hour beginning at 5 p.m., statewide demand was about 91.09 GW and 90.01 GW respectively in the hourly series. Consumption by the matched resources was 3.07 GW the first evening and 4.89 GW the second. The 1.82 GW difference survives matching the same resources across both days. Even among customers registered to offer flexibility, two high-demand hours can produce very different draws.
The dispatch disclosures record consumption. They do not say why a customer changed its operations, whether a particular AI campus participated, or how much capacity ERCOT could count on in a future emergency. The projects in the November survey may also have a different mix of uses. For example, facilities reporting no cryptocurrency mining accounted for 175.9 GW of the 177.4 GW requested. ERCOT survey, page 8.
Thirty-three requests account for 64.5 GW#
Thirty-three proposed data centers asked for at least 1 GW apiece. They made up 7.7% of the 429 reviewed projects and 36.4% of the requested capacity. At the other end, 143 projects requested between 50 and 75 MW, a combined 9.8 GW. The eight biggest requests alone accounted for 26.2 GW. Knowing the schedule of one very large project can matter more than adding several dozen smaller projects to a count. ERCOT’s preliminary size distribution.
| Request size | Projects | Total requested (GW) |
|---|---|---|
| Under 50 MW | 43 | 1.5 |
| 50 to <75 MW | 143 | 9.8 |
| 75 to <200 MW | 47 | 7.2 |
| 200 to <500 MW | 89 | 31.7 |
| 500 to <1,000 MW | 74 | 62.7 |
| 1,000 to <2,000 MW | 25 | 38.3 |
| 2,000 MW and up | 8 | 26.2 |
On November 20, ERCOT invited developers to authorize release of the initial energization date, the requested connection size and the projected peak demand for each year. Consent is due December 4. ERCOT plans to report how many developers consented on December 10 and to publish the authorized project details after it compiles them. The annual schedules would let readers compare the first buildings expected online with what a campus ultimately wants the grid to serve. ERCOT disclosure notice.
How we compared the two peak days#
Ask the Grid checked all 744 hours of July system demand to select the two days. For each dispatch run on those dates, we summed reported real-power consumption for the 502 resource names present on both, then averaged those sums within each Central Daylight Time hour. Both dates had 288 runs and complete consumption values. The hour-ending system series is aligned to the beginning of its delivery hour. ERCOT’s annual record table reflects later settlements and lists July 22 at 91.155 GW. The hourly comparison uses one consistent data series for both dates. ERCOT dispatch disclosures · ERCOT peak record.
Download the chart data, in megawatts. Monthly approved and observed loads (CSV) · July hourly load comparison (CSV).