How forecasts are scored
What each forecast comparison measures, which run of the model it reads, how much evidence a verdict needs, and how to read the day-by-day record, the range check and the spike record.
- Status
- Live
- Access
- Public · Metis 1 Preview scores with a free account
- Reading time
- 8 minutes
- Updated
- Oct 21, 2026
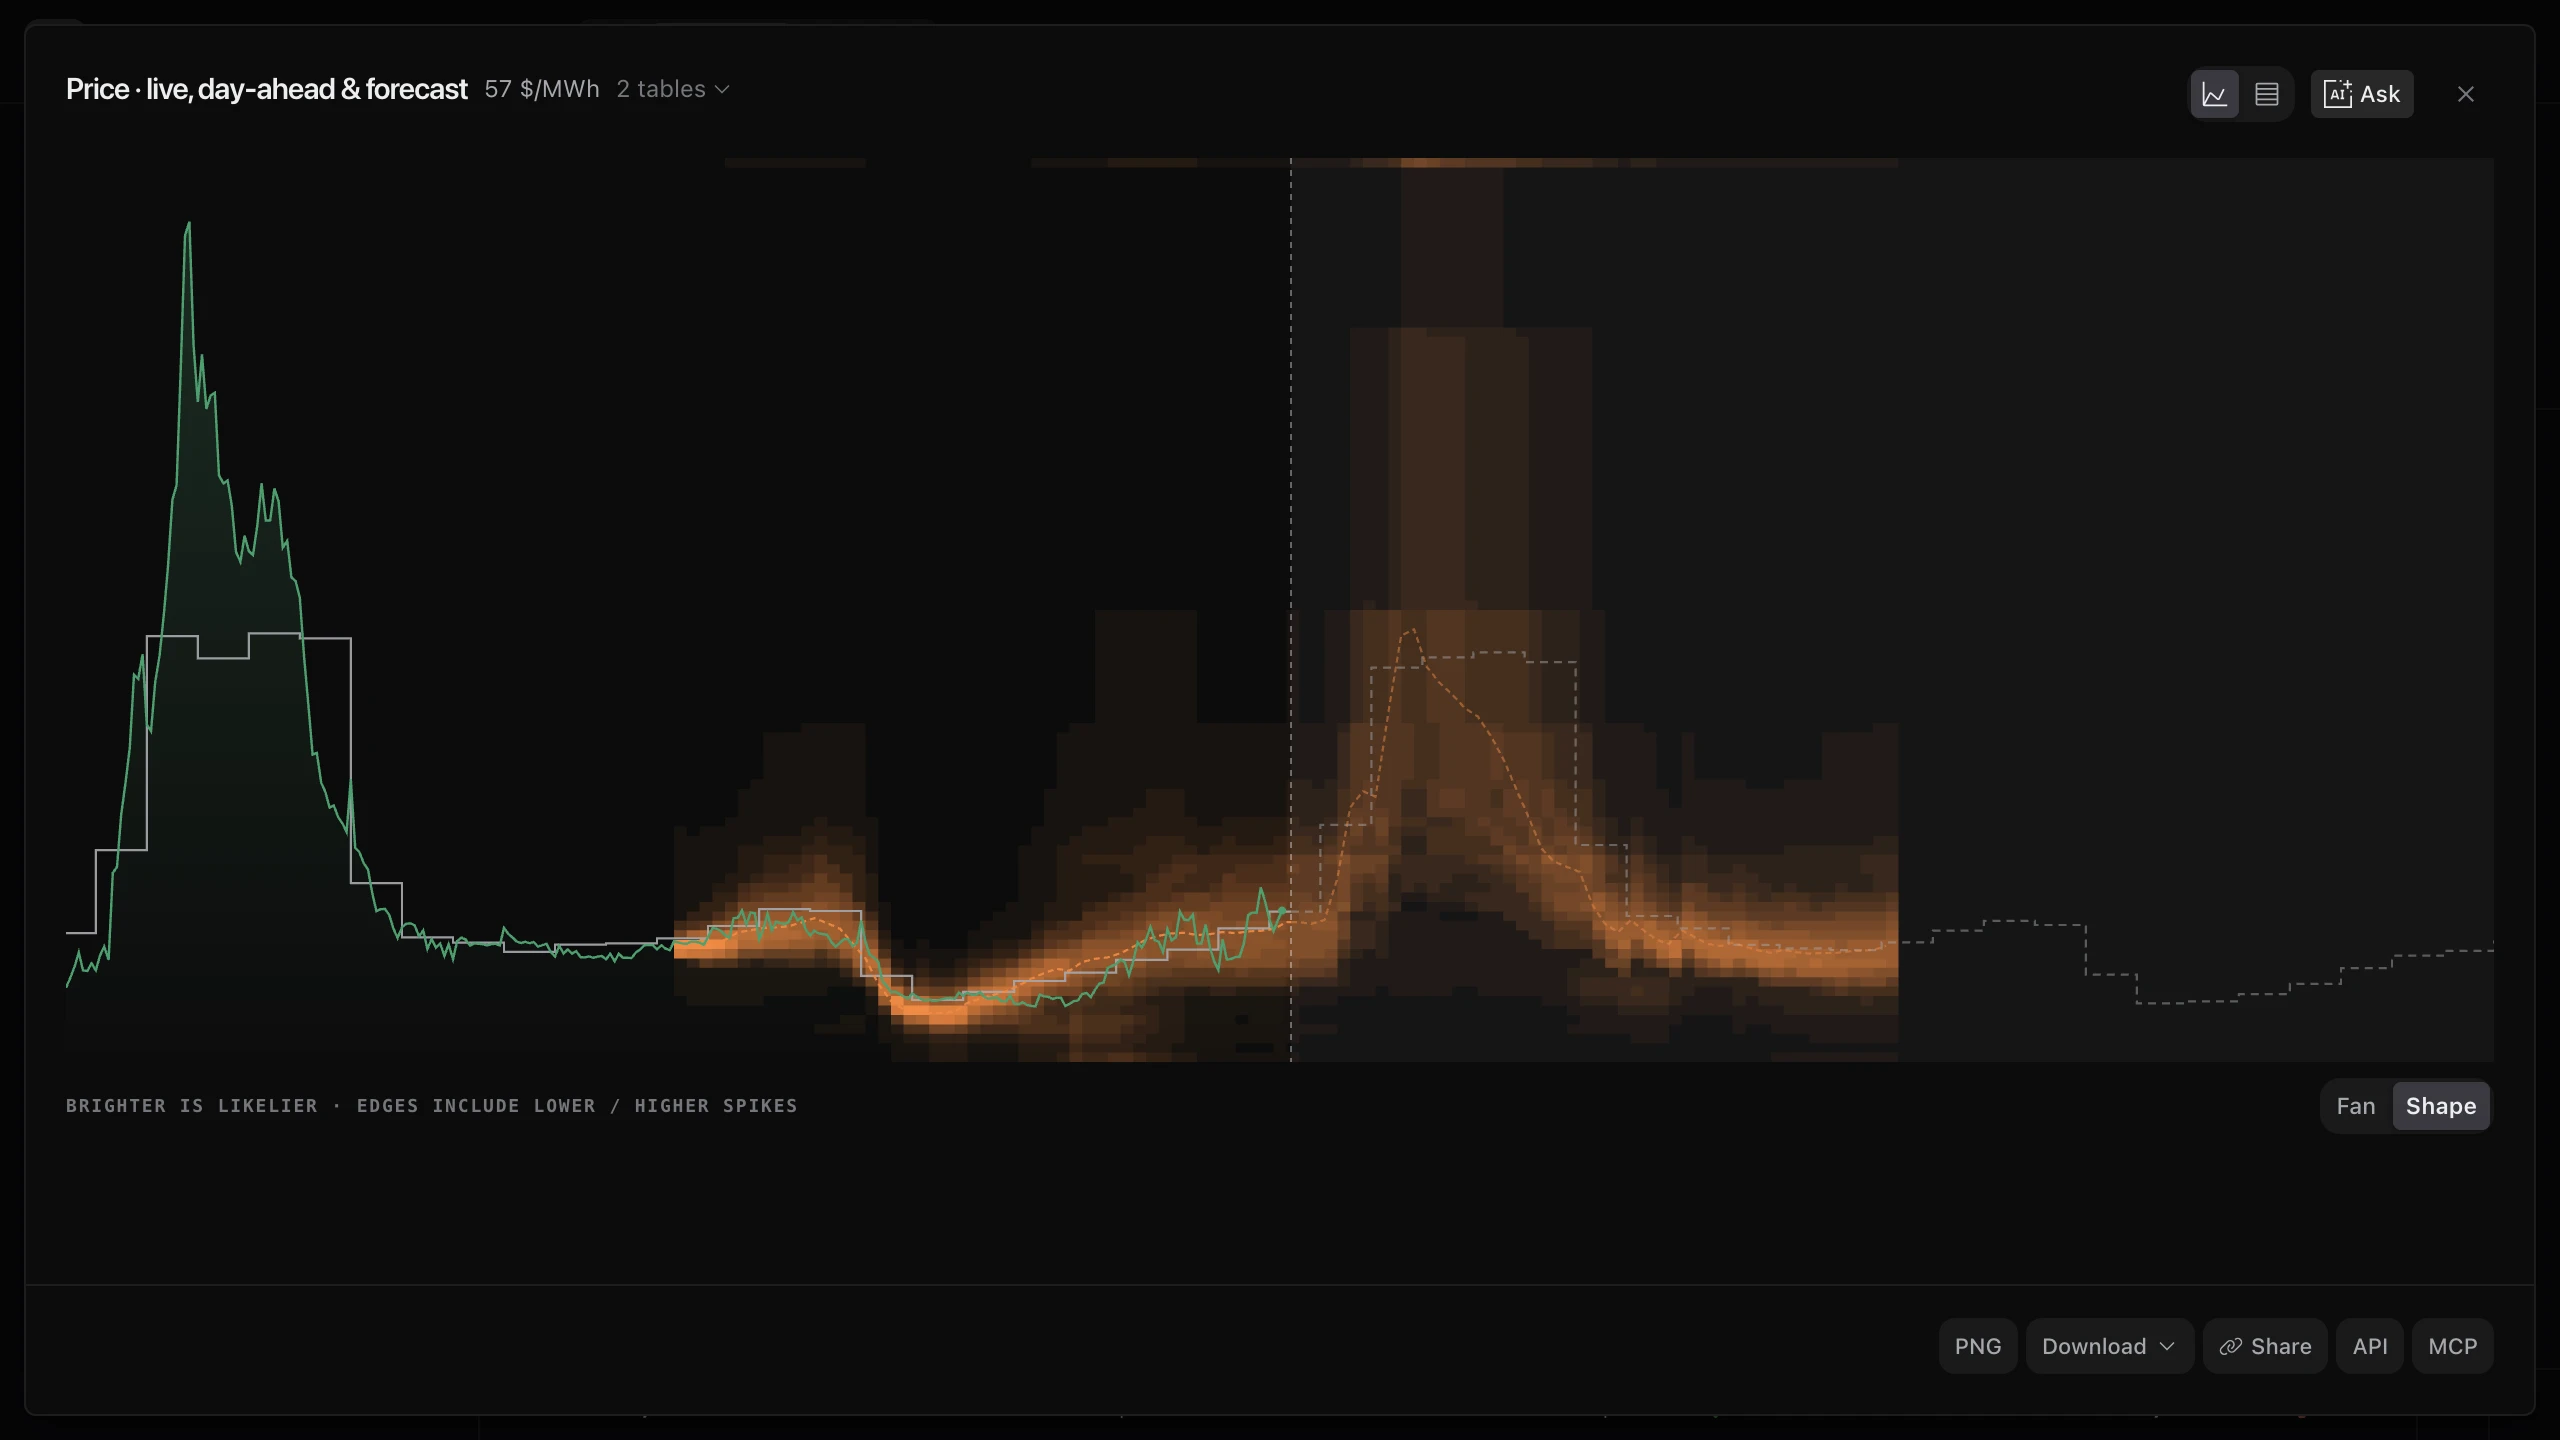
Ask the Grid compares forecasts in several places: the comparison with the auction on node and price pages, the Score tab in Chart Studio, the scorecard under each forecast, and the forecast accuracy page. They all follow one set of rules. A model is only ever ranked against the day-ahead auction on the information the auction had, a verdict needs 7 complete operating days on one model build, and the uncertainty around every verdict is stated rather than hidden.
This guide explains each comparison in the order you meet it: what is compared, which forecast run is read, what the numbers mean, and when a page deliberately shows numbers without calling a winner. Every “How this is scored” link in the product opens the section below that explains the comparison it sits beside.
On this page
Compare the model with the day-ahead auction
The comparison with the auction answers one question: over the last week, did the model forecast real-time prices better than the day-ahead market did, on the same information?
What is compared
Each settled delivery hour is scored three ways: the model, read as the newest run issued before the day-ahead auction closed; the day-ahead auction; and persistence, the floor any forecast should clear. Finer intervals are averaged into whole hours first, because the auction prices hours. Only the build serving now is scored; a retrained model starts a new record.
How the model and the bar are scored
The model publishes a distribution, so it is scored on all of it: twice the average pinball loss across its quantiles, which for a single price equals its average miss. The auction is held to the strongest of three forms: its cleared price, that price with its running bias removed, and that price dressed with the spread of its own earlier errors. Each form uses only earlier hours. The strongest is called the bar. The median's plain average miss is shown beside the score for comparison.
When a verdict is given
A verdict needs 7 operating days with at least 18 scored hours each. The page then resamples whole operating days to put a 95% range on the difference between the bar and the model. If the whole range favours the model, the model is closer; if it favours the bar, the auction is; if it spans zero, the two are level. Level means the evidence does not separate them, not that they are equal. Before 7 days, the page says how many of the 7 it has.
Read the record day by day
The strip under a comparison has one bar per operating day. A bar above the line is a day the model had less error than the bar; below the line, the auction did. The day is the unit the range resamples, so the strip shows the evidence behind the verdict and whether the model was ahead on most days or on one. Faint bars are days with too few scored hours to count.
Persistence, the baseline
Persistence repeats the same hour as it last settled before the forecasts it sits beside were made. Against the auction that means the hours that had settled when the auction closed: yesterday's early hours, and the day before for the hours that had not yet happened. On demand pages it is read as of the market forecast's own cutoff; on wind, solar and grid-conditions pages, which score the latest forecast for each interval, as of the interval itself. It is labelled a baseline, shown after the forecasts and never named the leader. A forecast that cannot beat it has not added anything the last settled day did not already say.
Right side of the auction
A day-ahead position is paid on which side of the cleared price real time settles on, not on the distance. This number is the share of hours in which the model's median sat on the side real time settled on. A coin is right half the time. Hours where either the median or the real-time price equals the cleared price are left out.
When a chart shows numbers but no verdict
A comparison is only ranked when the model and the auction had the same information. Otherwise the numbers stay visible, labelled with the run they describe.
Which runs are ranked
Only the newest run issued before the day-ahead auction closed is ranked against the auction. The newest run issued before each interval has seen hours the auction had not, so it would look better than it is. The earliest run that covered each interval, up to 48 hours ahead is up to a day older than what the auction knew, so it would look worse. A chart that does not say which run it draws is not ranked either.
- 1In a node page's settlement review, choose Day ahead to score the run issued before the auction closed.
- 2Choose Latest to inspect late revisions; Score then shows the numbers and says why it gives no verdict.
What the Score tab scores
Chart Studio's Score tab scores the window the chart is showing, by the same rules. A one-day window cannot reach 7 operating days, so the tab says how many it has and offers to show the last 7 days. The comparison under a node or price chart always scores the last week, whatever the chart above it shows, and says which days it scored.
Check the model's range and its spike calls
A distribution is only useful if its ranges mean what they say. Two checks read the model's uncertainty rather than its middle.
How well the ranges held
The model's P10–P90 range should contain the real-time price 80% of the time. The range check counts how often it did over the last week, on the build serving now, read as the model stood when each day's auction closed. Within five points of 80% is on target. Far fewer means the range is too narrow; far more means it is wider than it needs to be. The average width sits beside the hit rate, because a range that contains everything by being enormous is not informative.
Read the spike record
The spike record judges the model only on what it said before the outcome. An interval counts as called when the model gave at least a 25% chance of clearing the market's elevated price line. The record then counts how many called intervals did clear it, and how many of the intervals that cleared it had been called. It states no rate until at least 5 intervals have cleared the line.
Grouping hours by what the price turned out to be would reward whichever forecast ran high. The spike record groups by what the model said in advance instead.
Compare forecasts across markets
The scorecard under each forecast and the forecast accuracy page compare every published forecast with what settled.
Read an operator forecast's score
Demand forecasts are scored as they stood 24 hours before, against every hour that has settled since. Wind, solar and grid-conditions forecasts use the most recent forecast for each interval, which has had later information; the page names which. Error is the total miss as a share of the total actual, so a large grid and a small one compare fairly and solar's zero hours at night cannot inflate it. Average miss and bias stay in the grid's own unit. Forecasts are compared within one quantity and one vintage, never across them.
Read a page that pools hubs
A price page that shows several trading hubs scores the auction on every hub over the last week, whoever is reading. The model is scored on the hubs it forecasts, and its row says how many, such as 3 of 4 hubs. Rows scored on different hubs are not ranked against each other; the comparison with the auction above them uses only the hubs both cover.
Read the hours-before-delivery table
After the auction clears, the cleared price is what a position already carries. This table reads the model one and six hours before delivery against what you would otherwise hold then: the cleared price, the last hour, the same hour yesterday and, in ERCOT, ERCOT's own indicative price an hour out. The model is held to the best of them.
Did this guide get you unstuck?
One click is enough. No message or account required.