California’s August Grid Held While Wholesale Energy Costs Rose
CAISO reported comfortable reliability margins through its strongest demand since EDAM’s launch, alongside energy costs roughly 35% above August 2025.
California’s grid maintained what CAISO described as comfortable reliability margins during August’s strongest demand conditions since the May launch of the Extended Day-Ahead Market. Over the same month, wholesale energy costs reached approximately $1.3 billion, roughly 35% above August 2025.
The two results measure different outcomes. Available capacity and regional support helped the system meet demand. Serving more intensive summer conditions still carried a higher wholesale energy cost. CAISO’s September 28 report attributes many of August’s market changes to seasonal fundamentals rather than to changes in EDAM’s design or performance.
Demand increased late in the month#
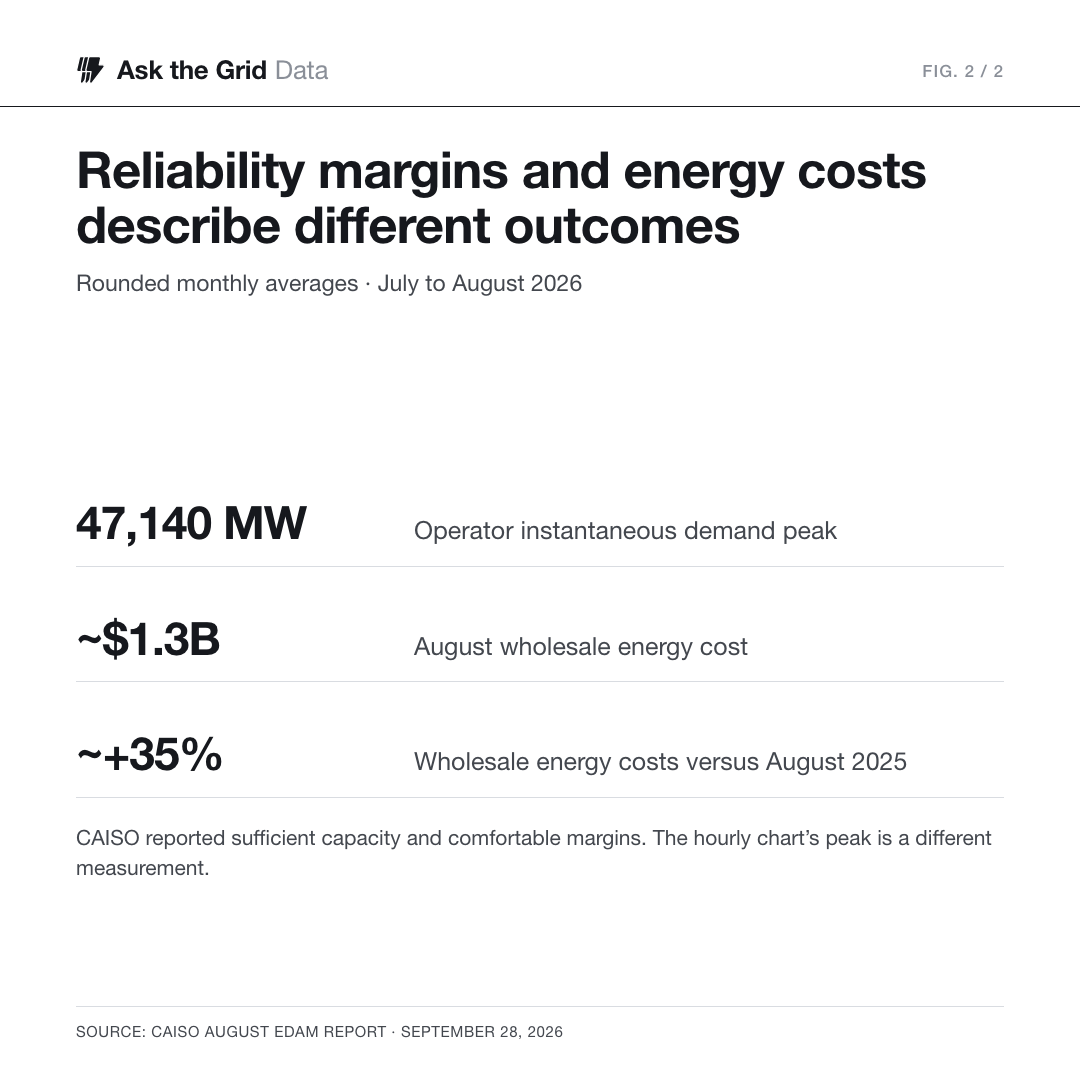
The operator reported an instantaneous peak of 47,140 MW on August 26, above the California Energy Commission’s 45,386 MW month-ahead forecast. It also counted 23 days with peak demand above 40 GW. Those operating readings belong to the report’s own measurement basis.
ATG’s separate hourly demand series reaches a maximum hourly average of 46,832 MW on August 26. Every Pacific-time day in the frozen August extract contains 24 hourly observations. The lower hourly value is expected when comparing an interval average with an instantaneous peak; it should not be treated as a correction to the operator’s number.
All three participating areas had higher day-ahead prices#
| Balancing area | July, $/MWh | August, $/MWh | Approximate change |
|---|---|---|---|
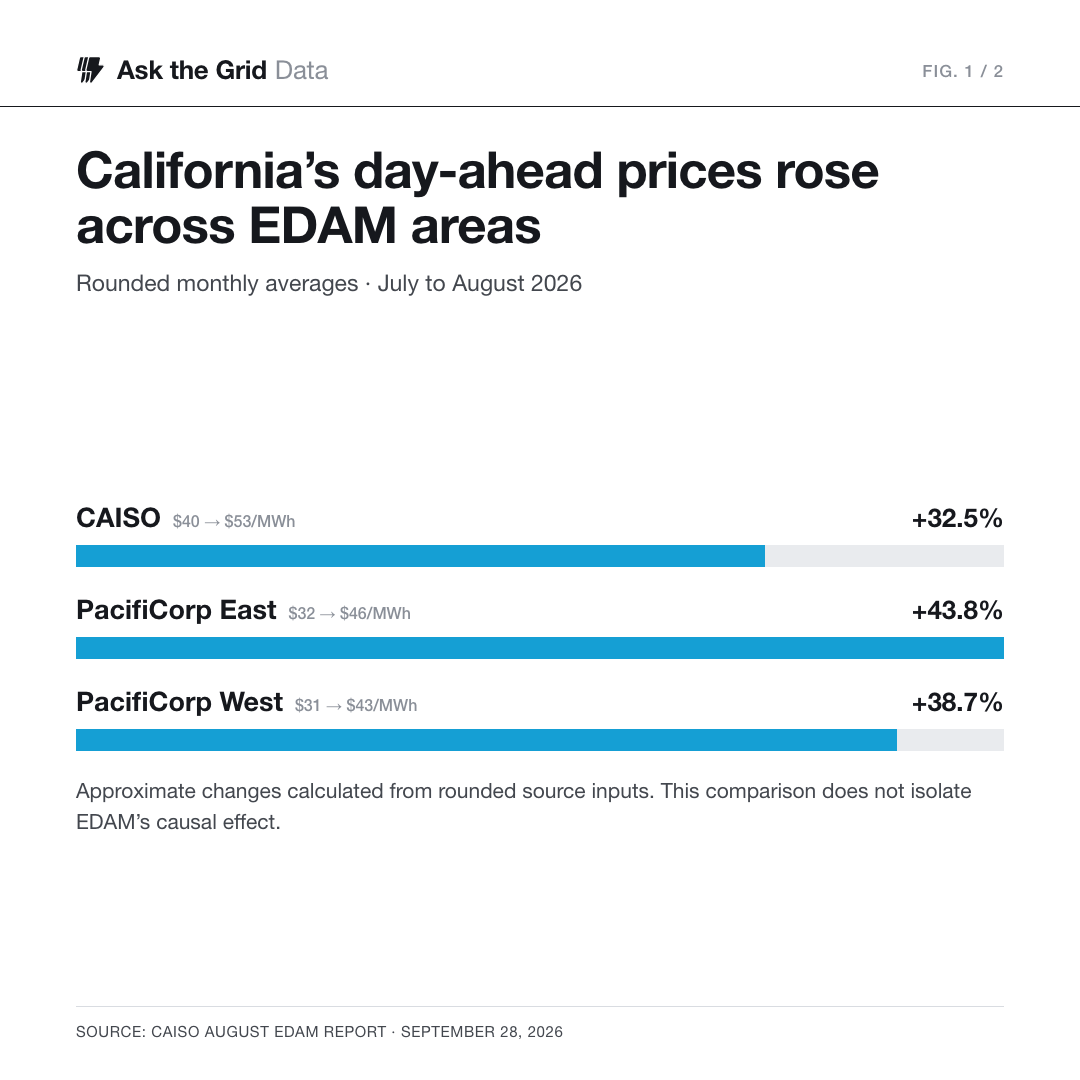
| CAISO | 40 | 53 | +32.5% |
| PacifiCorp East | 32 | 46 | +43.8% |
| PacifiCorp West | 31 | 43 | +38.7% |
CAISO’s rounded monthly day-ahead average rose from about $40/MWh in July to $53/MWh in August. PacifiCorp East rose from $32 to $46, and PacifiCorp West from $31 to $43. The highest daily averages occurred during the August 26–27 heat event, reaching approximately $83, $72 and $57/MWh respectively.
Prices remained different across the participating balancing areas. A shared day-ahead market coordinates transactions subject to network and resource constraints; it does not guarantee identical prices at every location. Those differences are part of the evidence needed to examine when transfers have economic value.
California exported solar-hour energy and imported ramp support#
The report describes California exporting during strong midday solar production and importing during morning and evening ramps. It also describes increased imports relative to earlier months, with PacifiCorp East moving toward a stronger net-export position in July and August.
The direction of a transfer depends on the hour. Summarizing a region as simply an importer or exporter can hide a daily exchange in which the same system supplies its neighbors at noon and relies on them later. Storage, renewable output, conventional generation and transfers jointly shape that operating pattern.
The bill for energy is distinct from the price of one market#
| Metric | Published August result | Meaning |
|---|---|---|
| Instantaneous peak demand | 47,140 MW · August 26 | Operator peak, not the hourly chart maximum |
| Days with operator peak above 40 GW | 23 | CAISO report’s measurement |
| Wholesale energy costs | Approximately $1.3 billion | Monthly wholesale energy costs |
| Average energy cost | $59.3/MWh | Cost measure; not day-ahead price or retail rate |
| Year-over-year energy cost change | Approximately +35% | August 2026 versus August 2025 |
CAISO’s approximately $1.3 billion monthly wholesale energy cost corresponds to an average energy cost of $59.3/MWh in its report. That is a different measure from the $53/MWh average day-ahead energy price. They have different coverage and weighting and should not be spliced into a single series.
The report puts July wholesale energy costs at approximately $0.95 billion. Using those rounded totals gives an approximate 37% month-to-month increase. The separately reported 35% figure compares August with August a year earlier. The comparison period matters as much as the percentage.
The next test is performance across comparable conditions#
The report’s evidence supports a high-demand month with sufficient capacity and higher costs. It does not establish the amount costs would have been without EDAM. Measuring market-design effects requires a consistent counterfactual that holds weather, fuel prices, outages, demand and available transfers appropriately in view.
As additional utilities join, the useful operating questions are when transfer limits bind, where prices separate, how flexibility products are used and whether procurement is delivered when needed. Monthly reports can track those results; modeled benefit studies answer a different question and should retain their assumptions.
Sources and method#
Market costs, inter-area prices, capacity assessment and transfer descriptions come from CAISO’s September 28 August EDAM report. Approximate percentage changes use the rounded published inputs. The hourly load chart is a separate, complete 744-hour extract retrieved October 14 and displayed in Pacific time. Explore CAISO and read about the October addition of Portland General Electric.