California's Batteries Are Reshaping the Solar Day
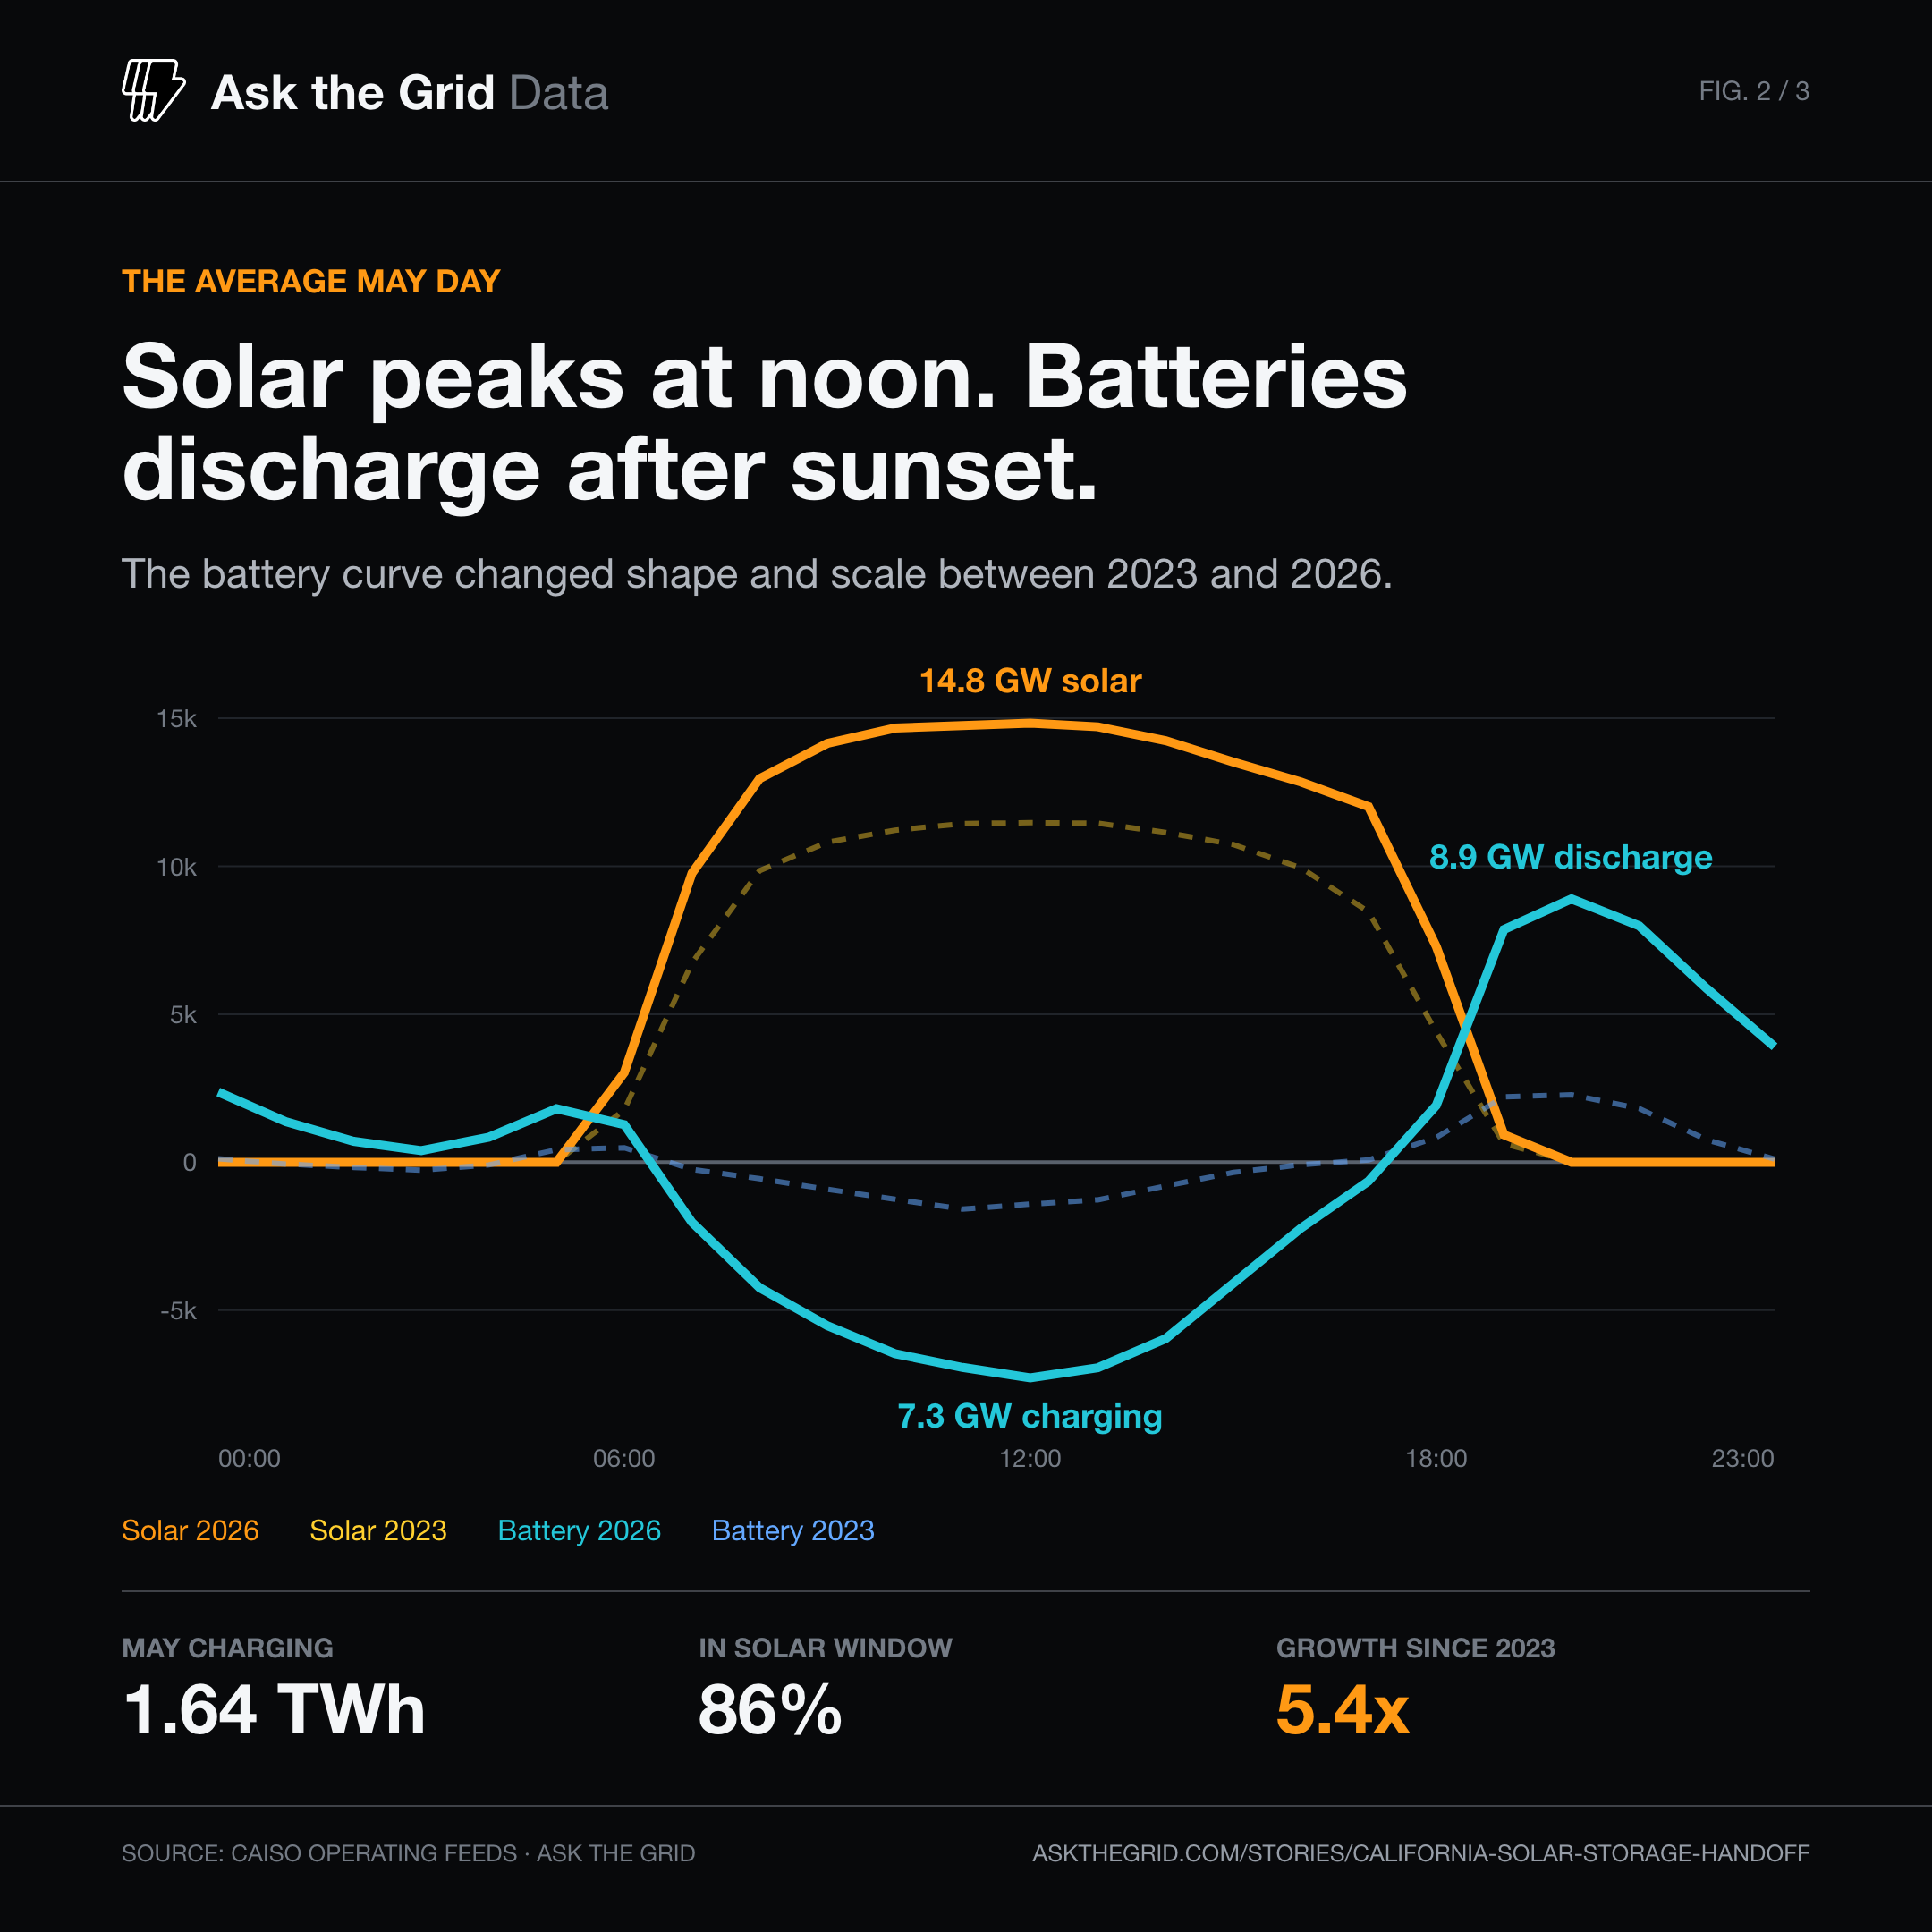
Preliminary EIA data puts May solar at 51 percent of in-state generation. CAISO's public battery-trend series registered 1.64 TWh during net-charging intervals, with net charging reaching 7.3 GW near noon and net discharge reaching 8.9 GW around 8 p.m. on the average May day, then recorded separate series highs for five-minute output and output relative to the containing hour's load.
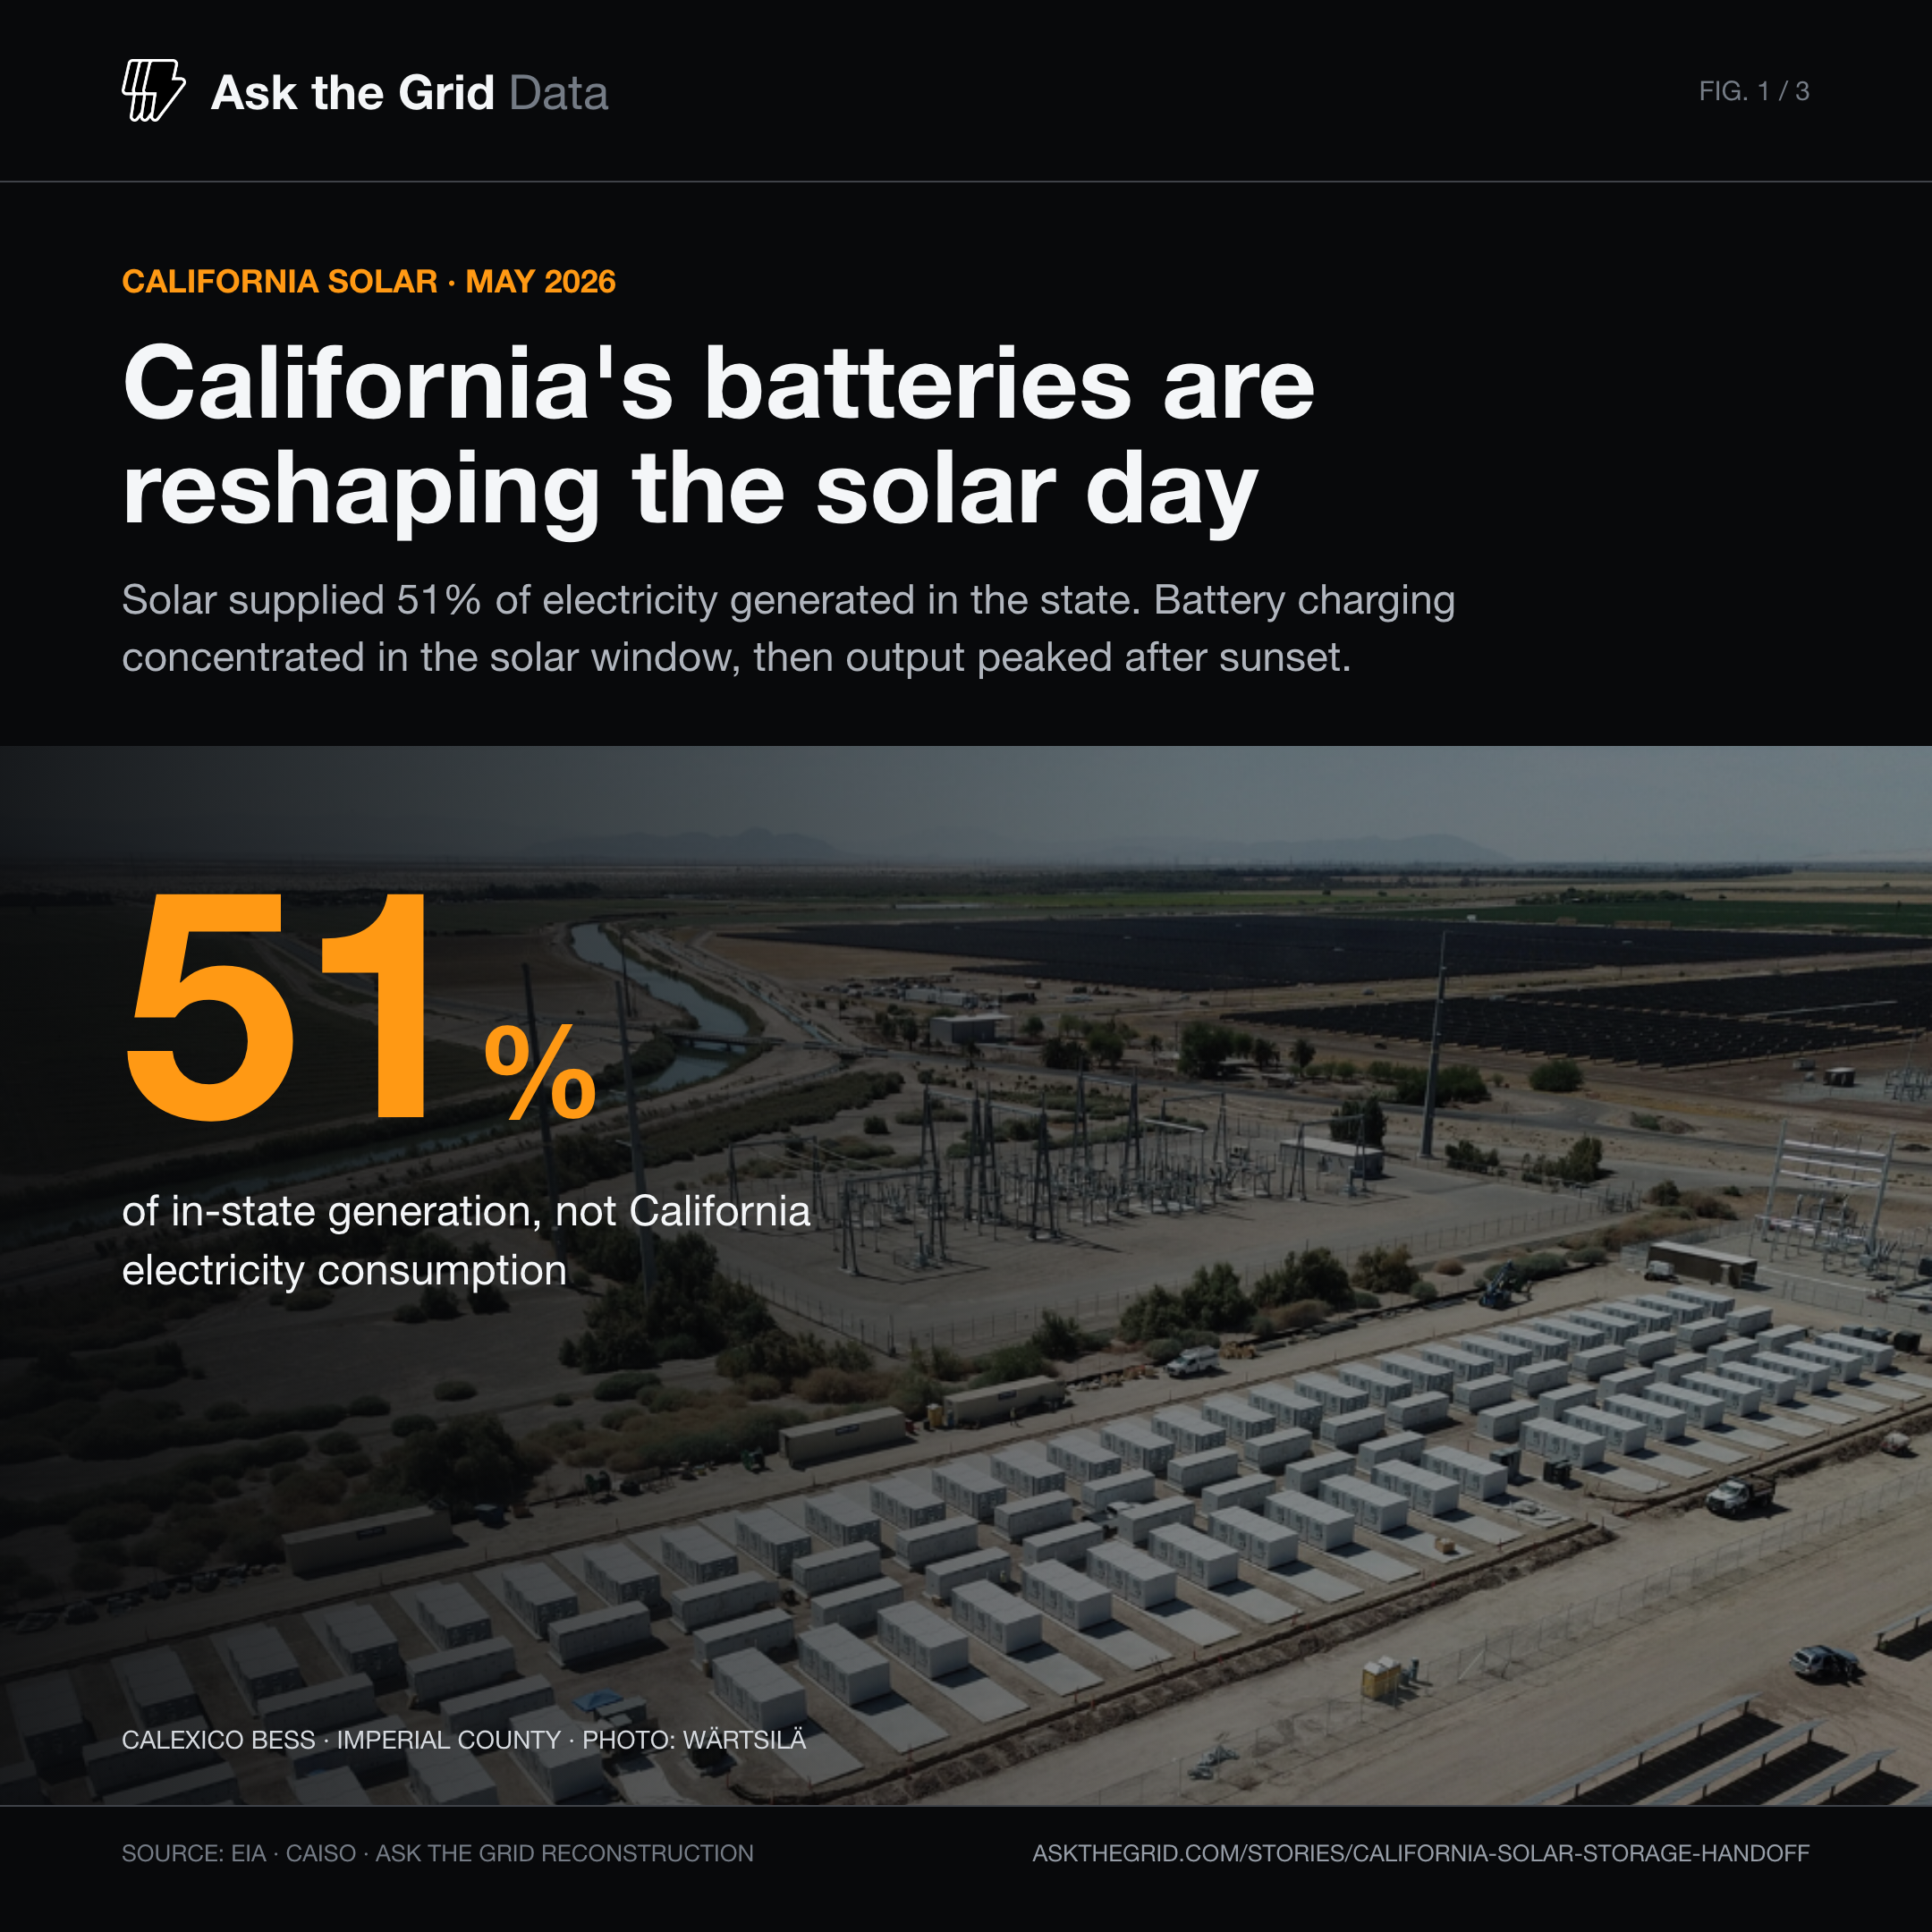
California crossed a clean-energy milestone in May: solar supplied 51 percent of the electricity generated inside the state, according to preliminary U.S. Energy Information Administration data, as compiled by Ember. The figure is preliminary because EIA's monthly generation estimates can still be revised. It is also not the number an operator balances: it is a monthly generation share, not a measure of electricity consumed in California, not a five-minute operating ratio, and not a statement that California ran independently of its neighbors.
The operating data answers a different question. Ask the Grid reconstructed the available utility-scale solar hours and five-minute battery intervals in CAISO through July 29. The data shows a power system that increasingly runs in two acts: solar fills the middle of the day, then CAISO's public battery-trend series — modest three years ago — supplies gigawatts into the evening. It also shows why two later highs in that series now circulating together — 43.8 percent of an hour's load and 13 gigawatts of output — should not be treated as the same achievement.
The 51 percent needs a denominator#
The headline comes from state-level generation accounting. It includes estimated small-scale solar and divides solar output by electricity produced inside California. It does not divide by California electricity consumption, because part of the state's power comes across an intertie. It also does not describe CAISO alone: municipal balancing authorities sit inside California but outside the ISO, while CAISO's own utility-scale solar feed excludes the roughly 20 GW of small, customer-sited solar that the state total estimates.
That denominator moved. The U.S. Energy Information Administration found that, through the first five months of 2026, CAISO demand rose 7 percent from the same period in 2024 while in-area net generation fell 19 percent and imports doubled. New SunZia wind from New Mexico and a wetter Pacific Northwest supplied part of the difference. A rising solar share can therefore describe two things at once: more solar capacity and less generation in the denominator because imported electricity displaced local output.
None of that makes the 51 percent milestone less meaningful. It makes it more specific. The operator question is what happened after noon inside CAISO, where utility-scale solar and batteries are visible at operating cadence.
Batteries became the second half of the solar day#
The shift in three years is visible without a model. On the average May day in 2023, CAISO batteries charged at about 1.6 GW near noon and discharged at about 2.3 GW after sunset. In May 2026 they charged at 7.3 GW near noon and discharged at 8.9 GW around 8 p.m. The solar curve grew; the storage curve changed shape and scale.
Across May, CAISO's public battery-trend series integrated to 1.639 TWh during net-charging intervals and 1.416 TWh during net-discharging intervals. These are series-level net measures, not gross battery throughput, traced solar energy or round-trip efficiency — simultaneous charging and discharging by different assets can offset in the aggregate, and public telemetry cannot trace an electron from a solar panel into a particular battery. Eighty-six percent of net charging occurred between 9 a.m. and 5 p.m.; 72 percent of net discharge occurred between 5 p.m. and 11 p.m. — a pattern consistent with an operating handoff from midday solar production to evening storage discharge.
Battery charging in May grew from 306 GWh in 2023 to 1,639 GWh in 2026, a 5.4-fold increase. In energy terms, the 2026 net-charging total was equivalent to 33.4 percent of the utility-scale solar output in CAISO's renewable feed, up from 8.2 percent three years earlier. That ratio is not a storage efficiency calculation; it is a scale comparison. It says CAISO's battery-trend series is now large enough to integrate a material fraction of a month's solar production during net-charging intervals, with net discharge concentrated later in the day.
The 43.8 percent high was not the 13 gigawatt high#
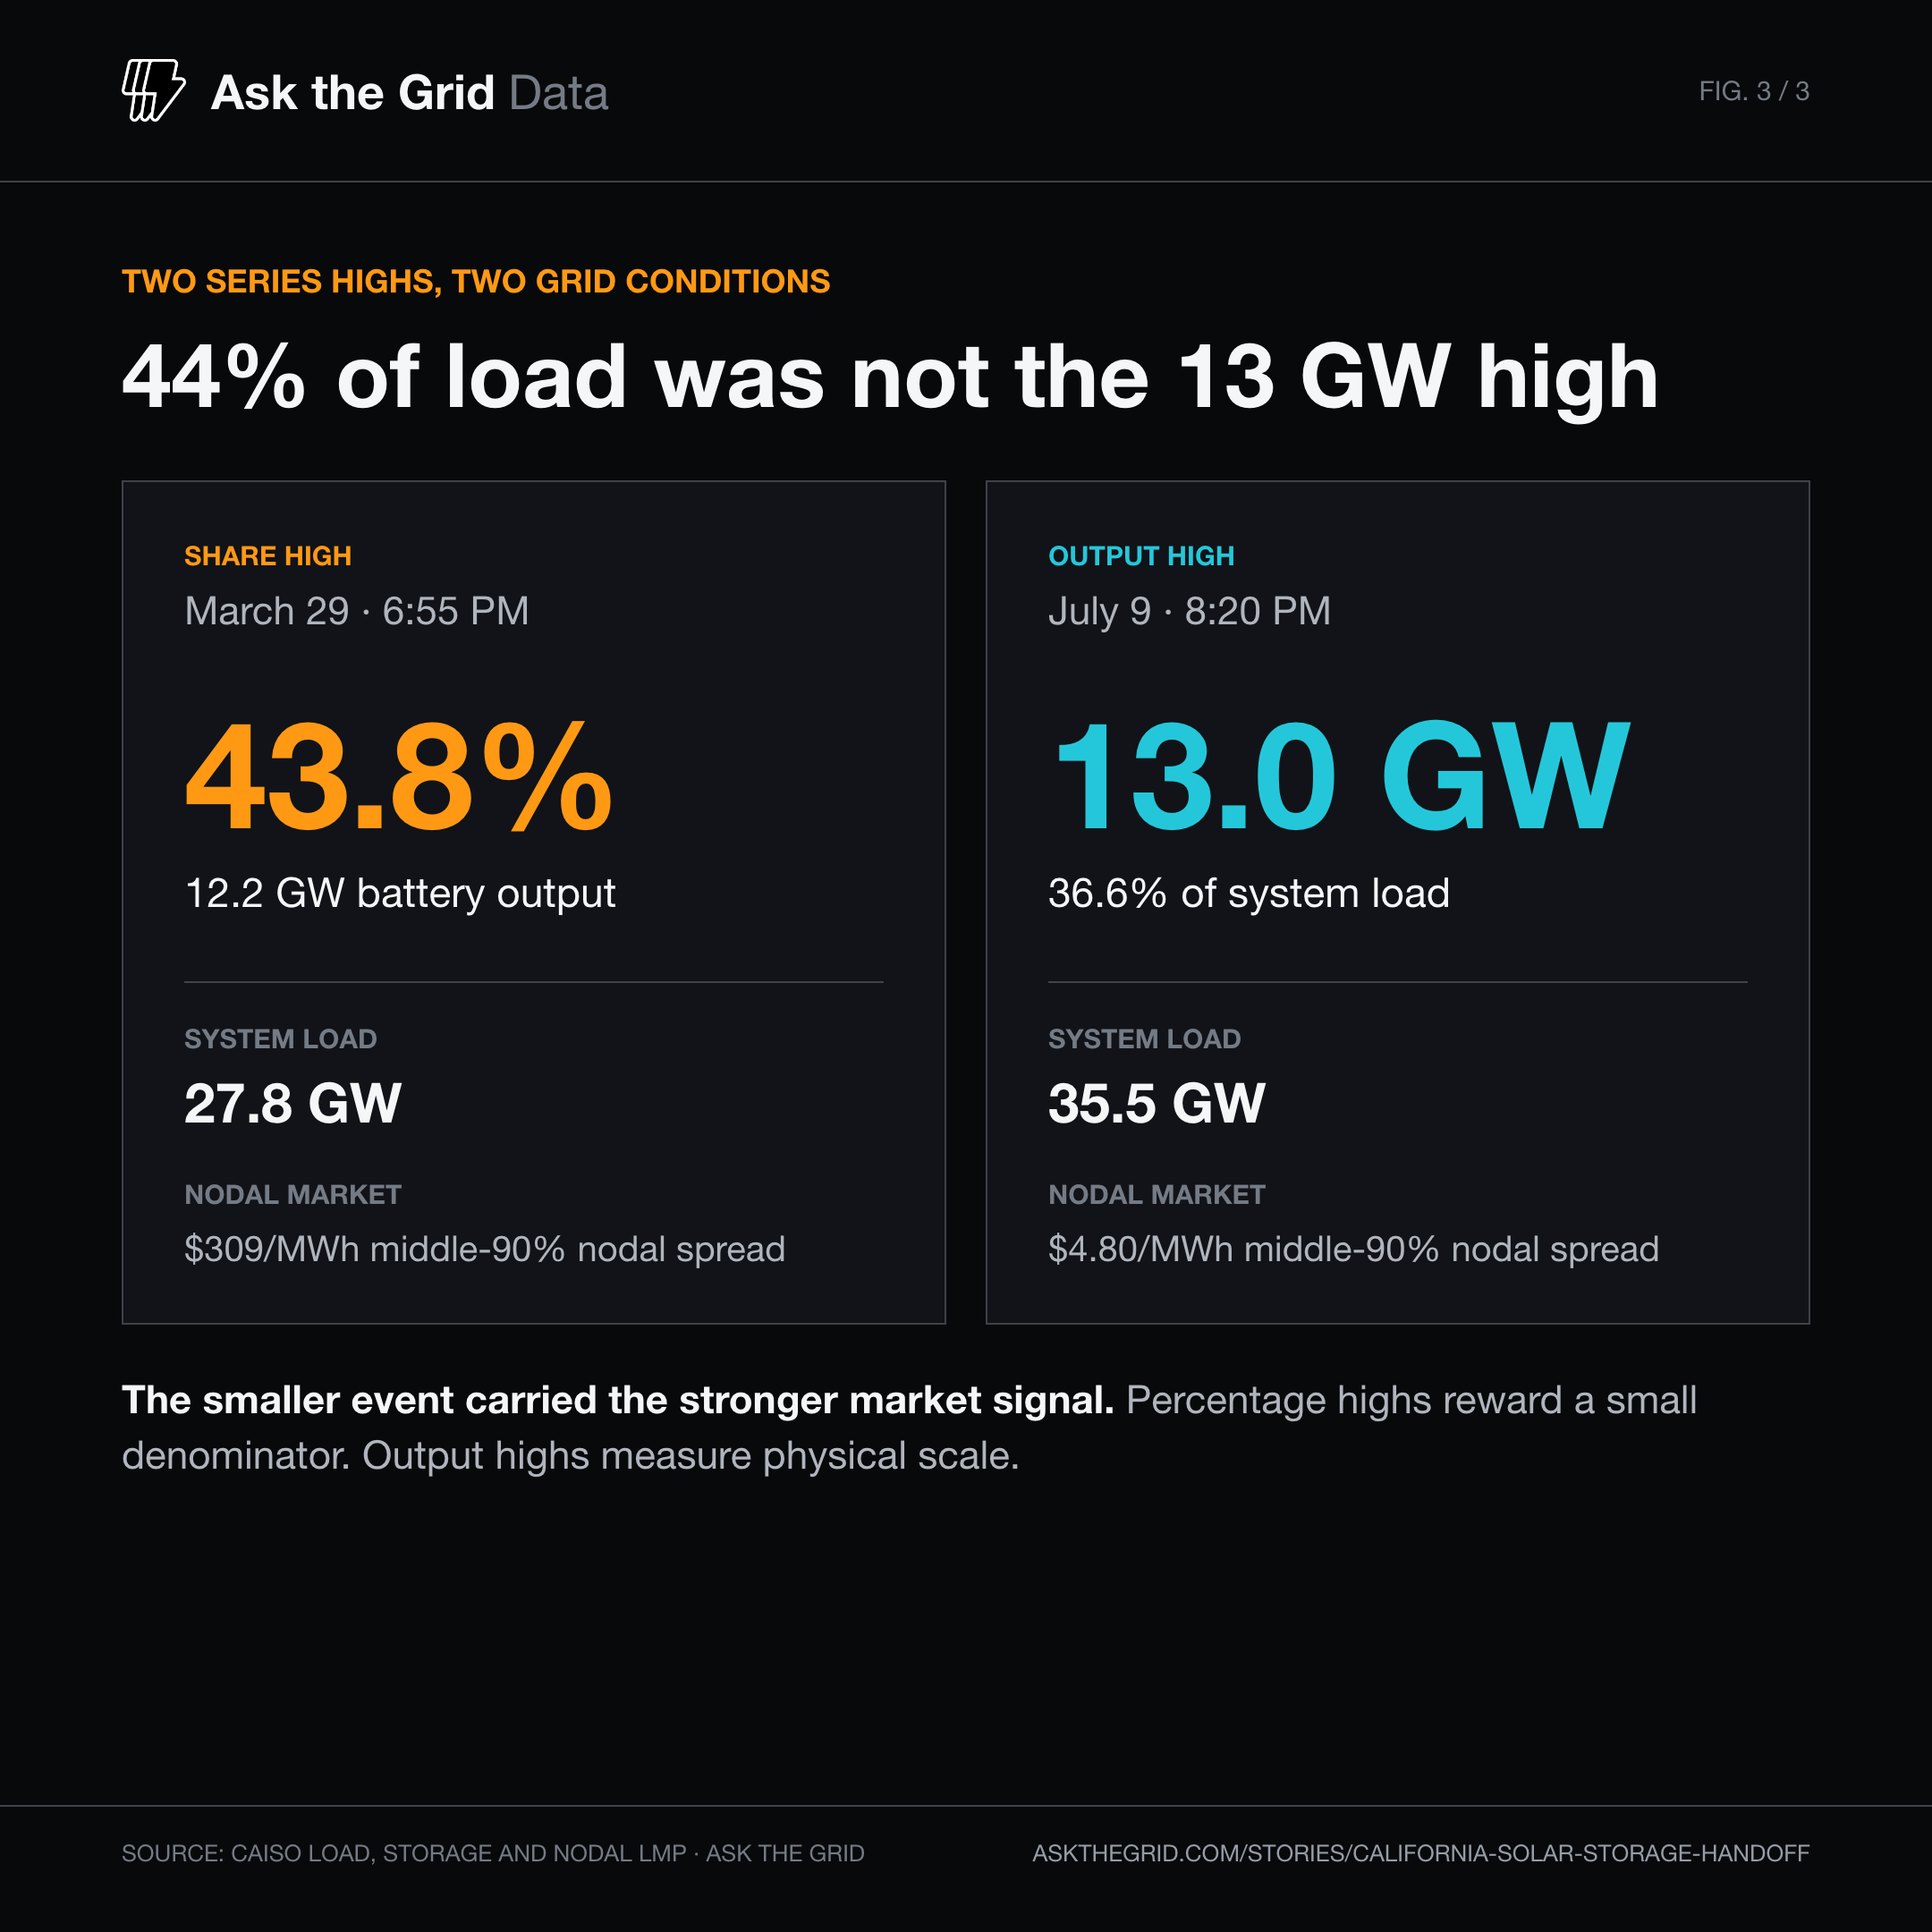
The distinction matters because percentages reward a small denominator — and because the two highs are measured differently. In Ask the Grid's five-minute CAISO storage series, which begins on February 1, 2023, the highest ratio of five-minute battery output to the containing hour's average CAISO-TAC load through July 29, 2026 arrived on March 29: 12.2 GW against an hourly load of 27.8 GW, or 43.8 percent. Because the numerator is five-minute output and the denominator is hourly integrated load, this is a proxy for battery share, not a literal instantaneous five-minute share. The highest raw battery output in the same series arrived on July 9: 13.0 GW against an hourly load of 35.5 GW, or 36.6 percent by the same ratio.
The prices make the two highs diverge further. Around the March share high, the average of the NP15, SP15 and ZP26 trading hubs had moved from -$6.60/MWh through midday to $50.10 in the evening, with a peak near $120. At 6:45 p.m., the exact 5th-to-95th-percentile nodal LMP range ran from -$151 to $158/MWh across 18,748 priced nodes in CAISO's real-time market. Eighteen percent of those nodes were still negative while 29 percent were already above $100 — parts of the queried footprint were long while others were short at the same moment.
At the July output high, the market was almost flat. Across 19,316 priced nodes in the 15-minute RTPD interval starting at 8:15 p.m. — which contains the 8:20 p.m. battery-output peak, five minutes later — the median nodal price was $42.20/MWh and the middle 90 percent fit between $39.50 and $44.30. No node in the reconstructed interval cleared $100. The larger series high was a physical high, but the smaller March event carried the stronger arbitrage and congestion signal.
The decision is locational#
For a battery owner, the statewide output high is not a revenue benchmark. March 29 is the more useful underwriting case: can the site charge where prices stay low, preserve deliverability into the evening, and discharge into the part of the map that is short? A node that remained negative while the hubs cleared near $120 experienced a different market from a node above $150, even though both contributed to the same 12.2 GW series figure.
For an operator, the two highs say that dispatch volume and market stress have separated. A 13 GW series high can arrive on a relatively uniform $42 grid. A smaller response can arrive while hundreds of dollars separated pricing nodes across the footprint. Forecasting the system battery curve is no longer enough; congestion, state of charge and local charging access decide which assets can act on it.
For planners and buyers, the monthly solar share is not a self-sufficiency score. Imports can increase while the in-state solar percentage rises, and batteries can reduce the evening need for gas without eliminating spring curtailment. The useful questions are narrower: how much charging occurred in the solar window, how much discharge survived into the evening ramp, and where the grid paid for that movement. Those are the quantities that determine where storage creates value.
The next test is whether the March pattern repeats as battery output keeps growing: a statewide response that looks sufficient in aggregate while nodal prices still split sharply by location. That is the signal to watch in the next spring solar surplus and evening ramp.
The analysis is frozen at 12:30 p.m. Pacific on July 29, 2026. Solar comes from CAISO's renewable-generation reports, battery output from its five-minute storage data, load from hourly system demand, and the nodal comparison from 15-minute real-time prices. The storage series covers February 1, 2023 through the cutoff and is missing 251 of 367,051 expected five-minute intervals, or 0.07 percent; it includes both standalone and hybrid battery storage and is published as an informational operating trend, not a settlements-grade billing record. May 2026 contains 742 of 744 expected solar hours per hub and 8,927 of 8,928 storage intervals. Storage energy integrates available five-minute net supply; share percentages pair each five-minute battery peak with the average load for its containing hour, which is a proxy for battery share, not a literal instantaneous five-minute share. RTPD timestamps denote the beginning of their 15-minute interval, so each nodal price snapshot below is the interval containing the battery observation it is paired with, not a simultaneous reading. The nodal comparison uses every pricing node CAISO published for that interval in its real-time market; our catalog does not carry a balancing-authority or geography column, so we cannot independently confirm the set excludes non-California entities that trade in the same CAISO-operated market. Where CAISO revised a nodal interval, the latest published price was used. Open CAISO on the map and scrub either high yourself.