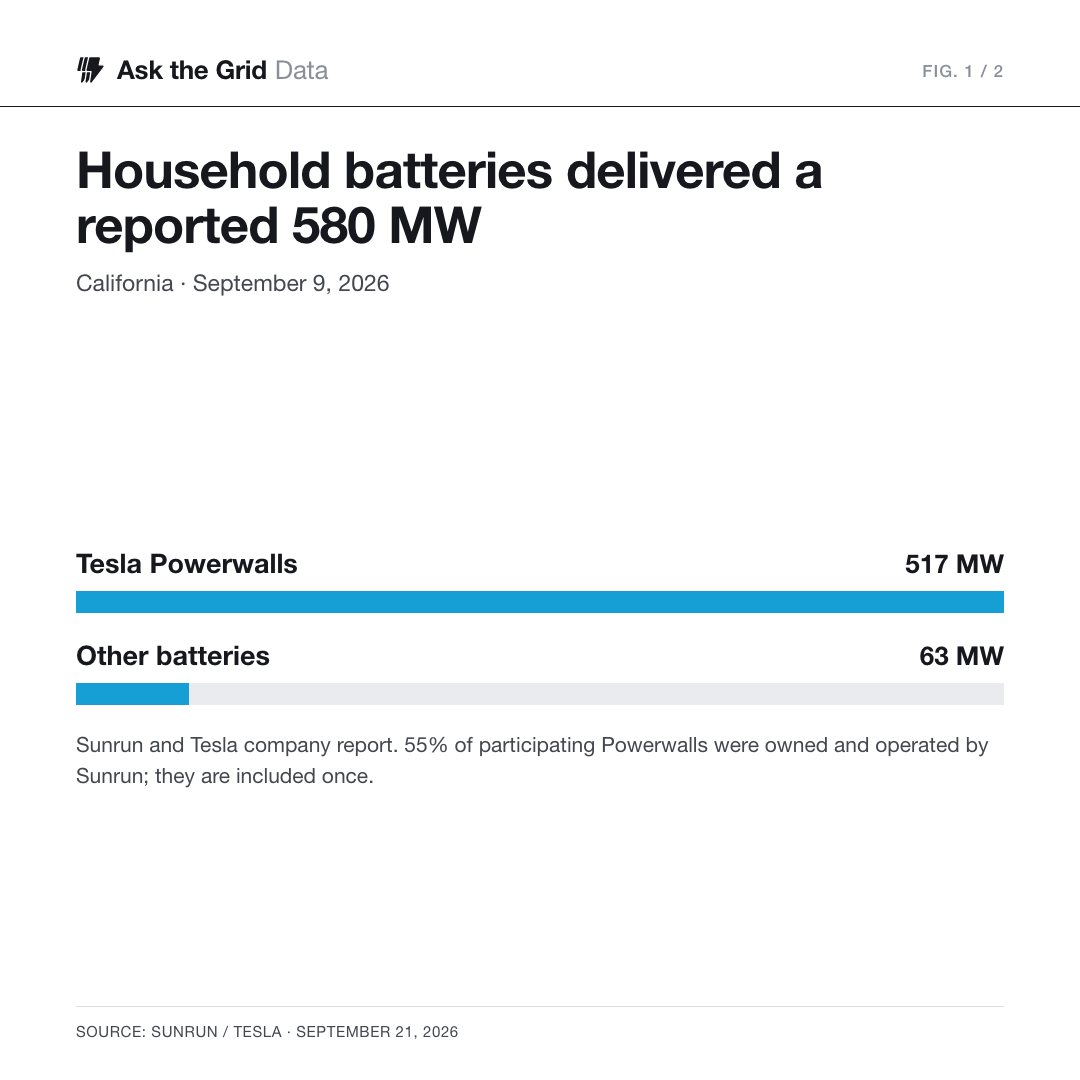
California’s Home Batteries Delivered a Reported 580 MW
The September 9 dispatch brought household batteries into two grid-service programs during the evening heat.
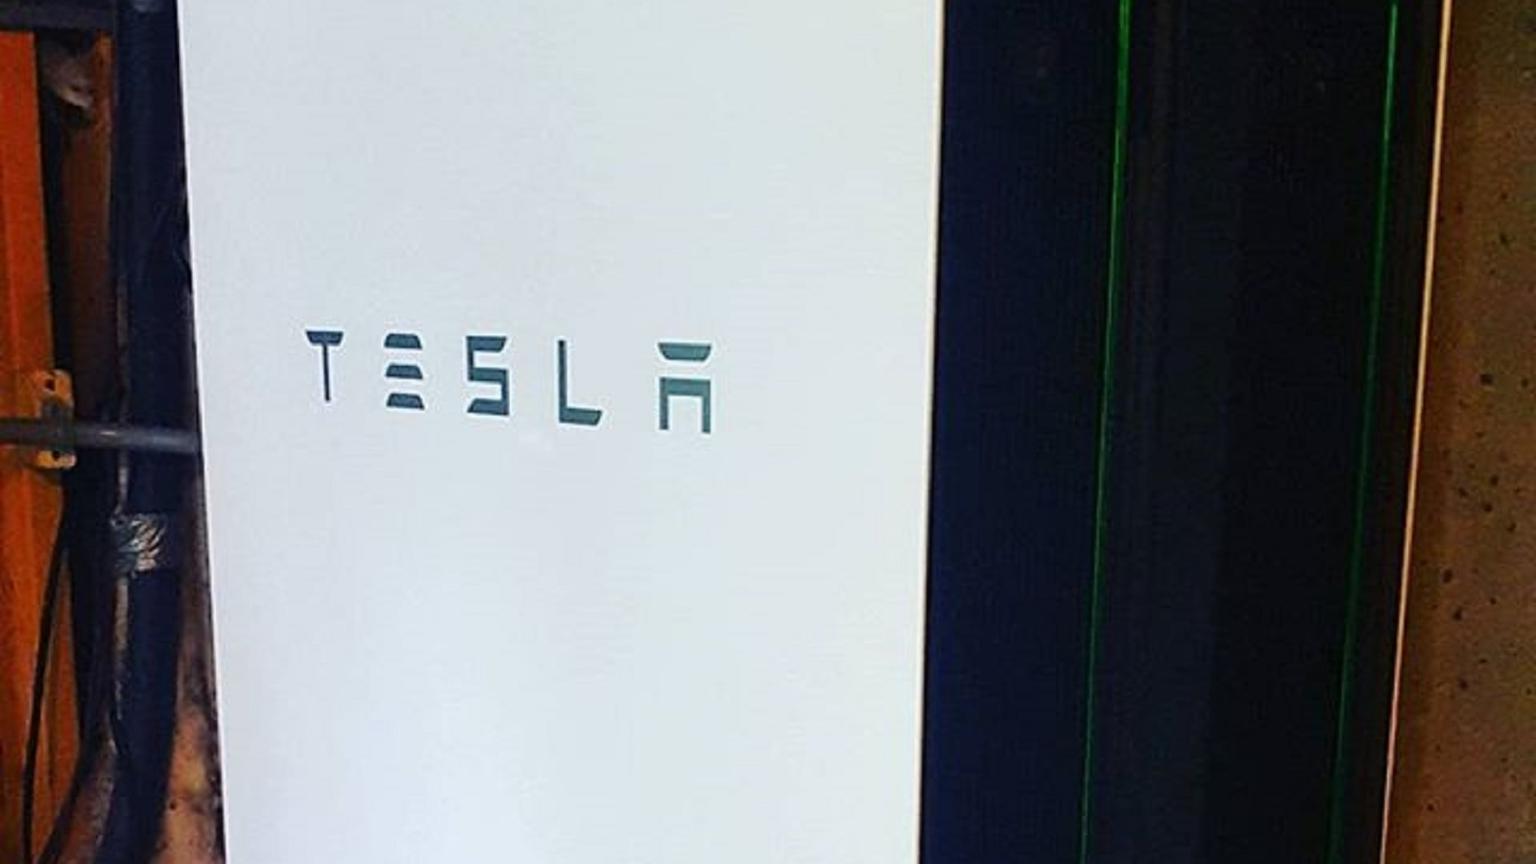
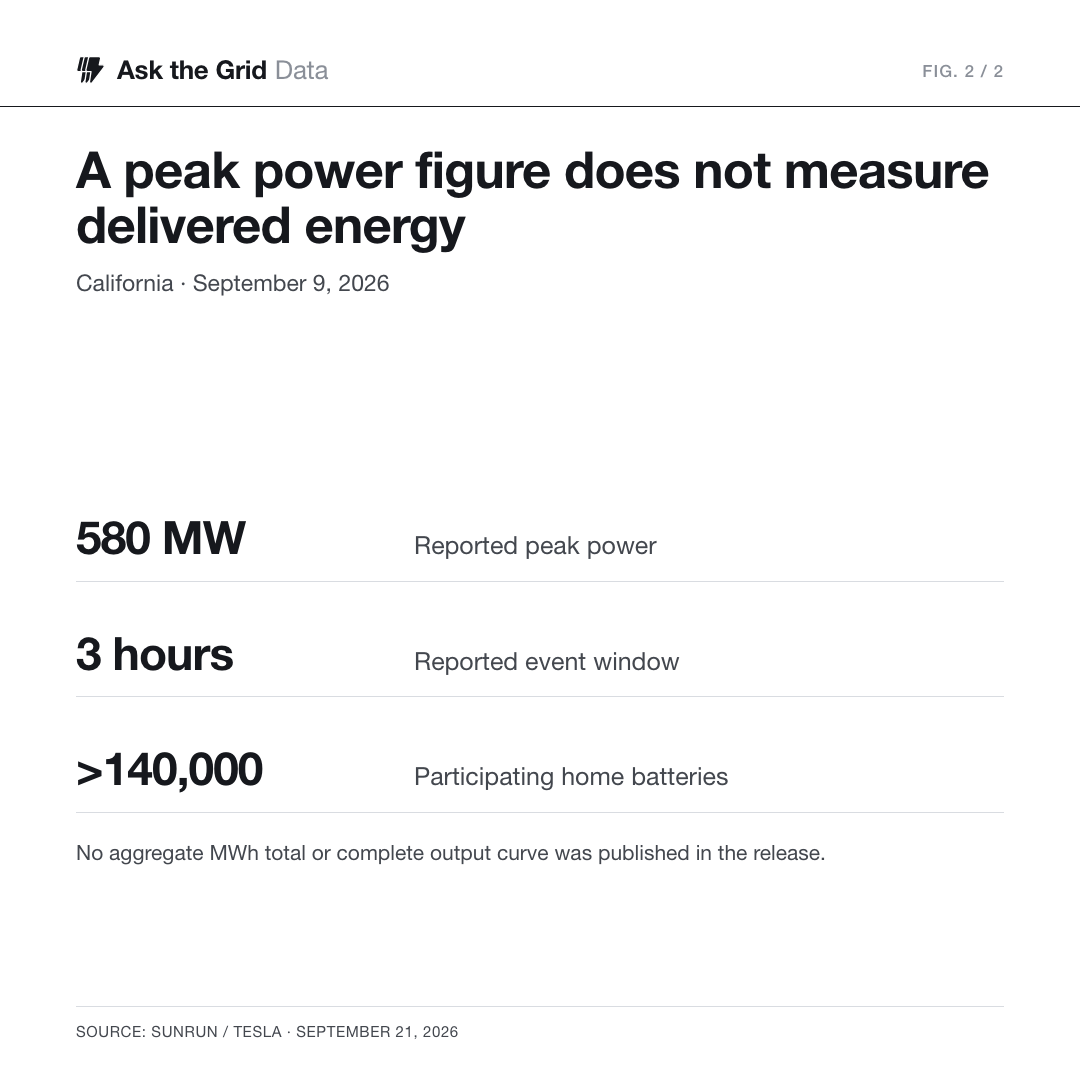
More than 140,000 household batteries supplied a reported 580 MW of peak power to California’s grid on September 9. Sunrun and Tesla said their fleets discharged during a three-hour evening period at the request of the California Energy Commission and utilities. The scale puts a residential aggregation into the same megawatt range as a substantial generating resource.
The event’s useful detail is how the batteries were called. One program responded to an electricity-price threshold; another was a utility event timed to the heat. A home battery can protect its owner during an outage and also provide grid support, but the service depends on the enrollment, dispatch rules and available charge of the participating fleet.
The evening gave stored energy a different job#
EIA’s hourly California balancing-area series records solar net generation of 18,014 MW at 2 p.m. Pacific, falling to 2,762 MW at 7 p.m. on September 9. Over those published hours, gas generation rose from 18,342 MW to 22,120 MW. The curves show the supply transition surrounding the evening; they do not isolate household battery output.
CAISO’s hourly load series reached 49,942 MW in the hour beginning 5 p.m. Pacific. Demand was still 47,423 MW at 7 p.m., when solar output in the separate EIA series was much lower. An hourly load average and an hourly generation publication have different measurement boundaries; the charts retain their own sources rather than treating their residual as measured battery delivery.
One fleet participated through two routes#
| Published category | Peak power | Devices / relationship |
|---|---|---|
| Tesla Powerwalls | 517 MW | 110,000 devices; 55% owned and operated by Sunrun |
| Other manufacturers’ batteries | 63 MW | More than 30,000 Sunrun customer batteries |
| Combined September 9 event | 580 MW | Company-reported coincident event |
| Separate September 10 SCE event | >140 MW | A different evening; not added to September 9 output |
The company release splits the 580 MW into 517 MW from Tesla Powerwalls and 63 MW from other batteries. More than half of the Powerwalls were owned and operated by Sunrun. Adding all Sunrun devices to all Tesla devices as if they were disjoint groups would count some systems twice.
The three-hour event window is also distinct from the peak power value. Multiplying 580 MW by three hours would assume that every minute sustained the peak, which the release does not establish. The announcement provides no complete aggregate output curve or measured MWh total.
Prices and program rules turned devices into a resource#
| Program | Who called / triggered it | Published event basis |
|---|---|---|
| Demand Side Grid Support | California Energy Commission program | Day-ahead locational price exceeded $200/MWh |
| Emergency Load Reduction Program | PG&E event | Dispatch coincided with the heat wave |
| SCE ELRP, September 10 | Southern California Edison | Separate three-hour evening dispatch |
At the Southern California trading hub SP15, the published day-ahead price reached $200.33/MWh for the hour beginning 7 p.m. Pacific. That supplies market context for the companies’ description of a $200/MWh DSGS trigger. It does not establish which program location crossed its threshold or how much the battery dispatch changed prices.
The companies describe participants in all three large investor-owned utility territories. They also report a separate SCE event the following evening delivering more than 140 MW. Their statement that simultaneous events could have exceeded 720 MW is a counterfactual fleet capability claim, rather than power observed on September 9.
What would establish the next step#
The operating question now is repeatability: how much power can the fleet deliver on consecutive hot evenings, for how long, and with what customer backup reserve? A program performance report containing interval delivery, baseline treatment and payment outcomes would answer more than another peak-MW announcement.
For a utility procuring flexibility, the useful comparison is between the contracted service and its measured delivery. Geographic availability, dispatch duration and customer participation all matter. A statewide aggregate cannot by itself demonstrate relief at a particular overloaded distribution circuit.
Sources and method#
Fleet output, device counts, programs and dispatch duration are attributed to Sunrun and Tesla’s September 21 release. CAISO hourly demand, SP15 day-ahead prices and EIA-930 solar/gas net generation were retrieved October 14, 2026 and are frozen beside this story. The EIA battery column is missing in this extract and is not treated as zero. Charts display Pacific time. Explore CAISO and read how California’s utility-scale batteries reshape the solar day.