US Natural Gas Pipeline Map: Live Capacity, Points and an AI Agent
A natural gas pipeline map of 90 US pipeline and storage systems, colored by how many points are scheduled near capacity, with located delivery points and an AI agent that reads every posting.
James LePageOctober 31, 20268 min read

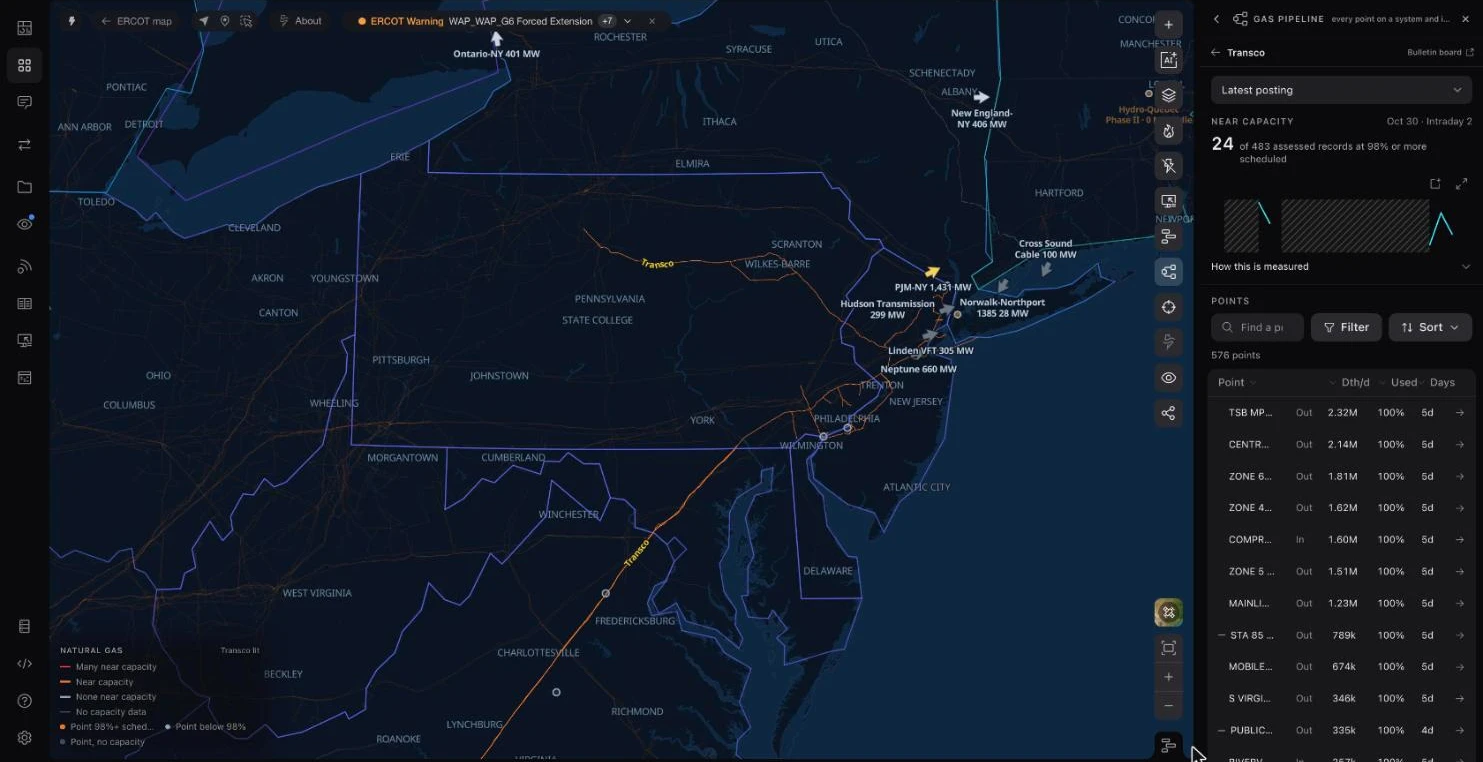
Gas day October 30, 2026. Lines are colored by how many of a system's points are scheduled at 98% or more of operating capacity; the list ranks the systems in the map's view.
Ask the Grid's natural gas pipeline map puts the capacity postings of 90 US pipeline and storage systems on one map, refreshed through each gas day. Every interstate line is colored by how many of its system's receipt and delivery points are scheduled at 98% or more of operating capacity, located points sit on the lines they belong to, and the grid agent can read every posting at once.
We built it because the question power traders, utility planners and data center developers keep asking the agent is no longer only about electricity. Data centers are pushing US electricity demand to records, gas-fired plants still supply about four in ten megawatt-hours, and a plant can only run as hard as the pipeline that feeds it.
01
Why AI demand puts gas pipelines on the critical path
In January 2026 the U.S. Energy Information Administration forecast the strongest four-year growth in US electricity use since 2000 and named large computing facilities, including data centers, as the driving factor. It put natural gas at 39% of US generation in both 2026 and 2027 (EIA).
Over the longer run, the Annual Energy Outlook 2026 projects power-sector gas use rising from 35.2 billion cubic feet per day in 2025 to between 38.1 and 50.4 Bcf/d in 2050 in most cases, a larger increase than in any other end-use sector.
That gas moves through a fixed network. Capacity at a delivery point is set by the pipe, compression and contracts behind it, and it doesn't grow on the timescale of a data center interconnection request. When a point is scheduled full, an extra gas plant behind it has nowhere to get fuel without someone else giving it up. Seeing which points are full, and how often, is the first step in pricing that risk.
02
What a live natural gas pipeline map shows
The map draws EIA's interstate and intrastate pipeline routes with OpenStreetMap transmission lines from zoom 5 in. With the pipeline tool open, each interstate system takes one of four states from its latest posting: red when many points are near capacity, orange when some are, light gray when none are, and dim when the posting carries no capacity figures.
The list beside the map keeps to the systems with lines in view and follows the map as you pan, ranked by points near capacity with each system's latest gas day. Clear the map filter to see every system, sort by distance to the view, or filter by status. Systems whose segments aren't mapped are still listed, read from their postings alone.
Opening a system shows its near-capacity count, every receipt and delivery point with its scheduled quantity and recent days full, and the power plants matched to its delivery points. Opening a point shows its 90-day history against operating capacity and how the latest gas day moved through the nomination cycles.
03
How to read a pipeline capacity posting
Interstate pipelines regulated by FERC must post, on their own websites, the availability of capacity at receipt points, on the mainline, at delivery points and in storage (18 CFR 284.13(d)). Each operator publishes on its own electronic bulletin board, in its own layout. We collect those postings through each gas day and normalize them into one shape.
Three numbers matter at each point. Operating capacity is what the pipeline says the point can move that day. Scheduled quantity is what shippers have nominated and the pipeline has confirmed. Operationally available capacity is the difference. A record counts as near capacity when its scheduled quantity is 98% or more of an operating capacity of at least 10,000 Dth/d, so small meters don't dominate the counts.
Nominations run on a published clock: Timely and Evening cycles before the gas day, then intraday cycles during it. The tool opens on each pipeline's latest available posting and names its cycle. Where an operator's labels don't establish a standard cycle, the posting is marked unverified rather than guessed.
Two limits are worth holding onto. These are scheduled nominations, not metered flow. And one system's postings describe the whole pipeline: a red line means many of that system's points are full, not that every mile of the segment you are looking at is.
04
Locating receipt and delivery points
Pipeline postings identify points by name and a location number, not by coordinates. To put them on the map we match each point to the archived HIFLD Natural Gas Receipt and Delivery Points layer, whose points were checked against imagery, through the industry's Data Reference Number and the operators' own cross-reference files. A match counts only when it falls in the county the operator reports and near the system's own line.
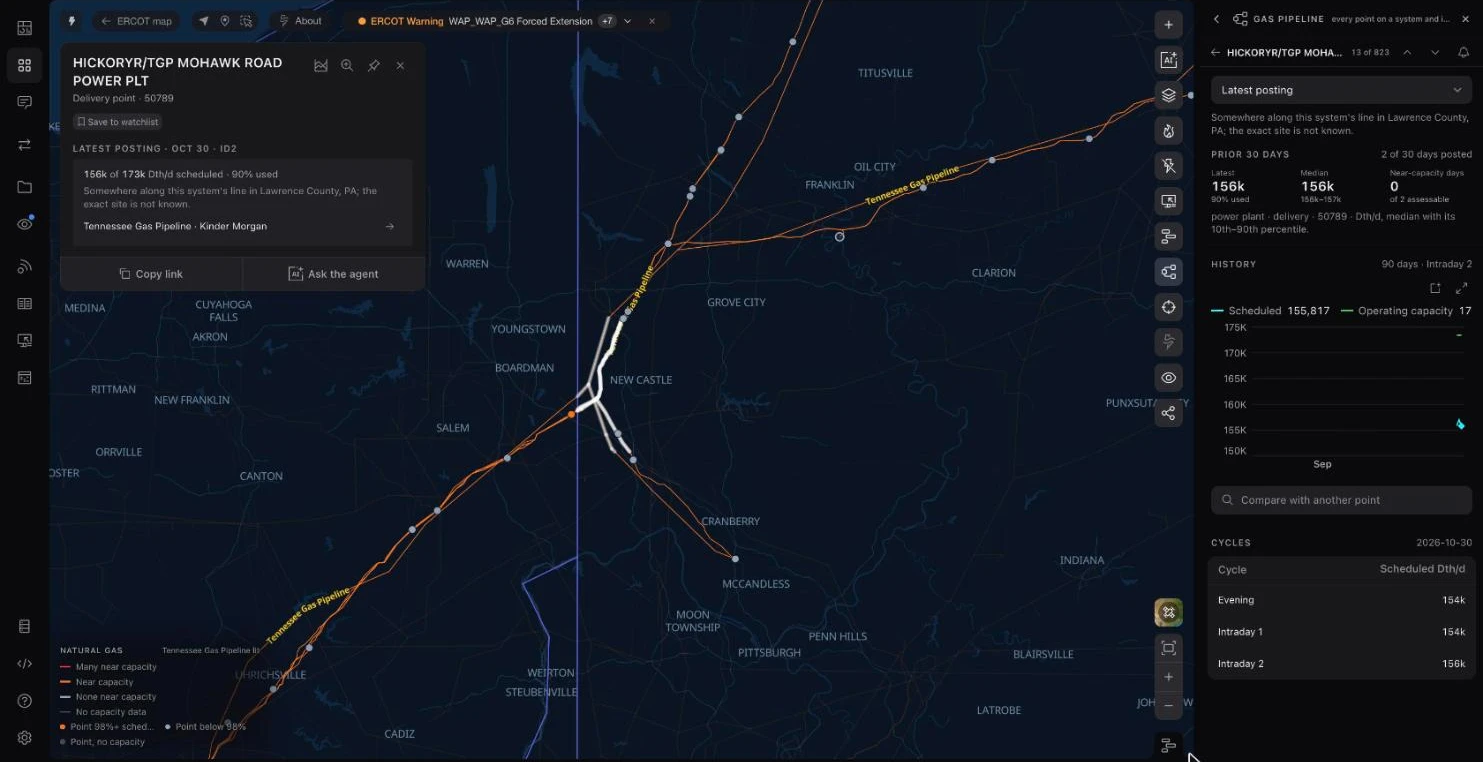
In the first release that pinned about 2,500 posted points on 31 systems. When a point can be placed only to its county, the map lights that county's stretch of the system's line instead of drawing a dot, and the point says how it was placed. Points without a county or a reference number are left off the map rather than placed by guesswork.
05
A power plant delivery point scheduled above its posted capacity
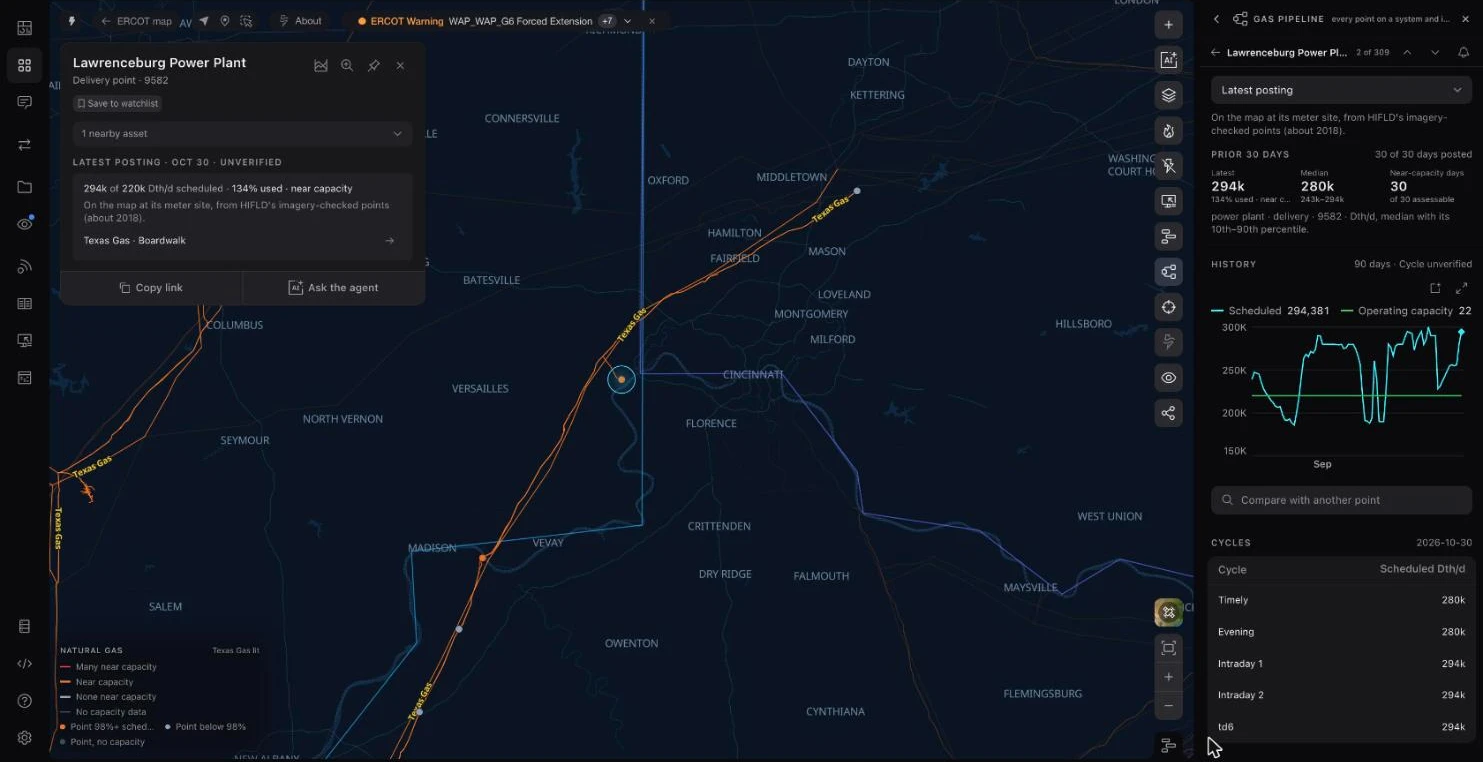
Texas Gas Transmission's delivery point labeled Lawrenceburg Power Plant, on the Ohio River in southeastern Indiana, shows what a point history adds to a single day's number. Its posted operating capacity is 220,000 Dth/d. On 69 of the 90 gas days from August 2 to October 30, 2026, scheduled quantity was 98% of that or more, and on October 30 it was 294,381 Dth/d.
Scheduled quantity above posted operating capacity is not an error in the chart: the operator posts both figures, and the point is pinned at its meter site from HIFLD's imagery-checked layer. Texas Gas's postings don't establish a standard nomination cycle, so the card labels the cycle unverified. For anyone pricing that plant's fuel or the power it sells, a delivery point that is full most days is a constraint worth knowing about before a cold snap.
06
Asking an AI agent across every pipeline
A map answers where. Ranking 90 systems' postings on one gas day is a query, and that is the grid agent's job. It reads the same normalized capacity table the map uses, writes SQL against it, and can open what it finds on the map.
Asked which interstate systems had the most receipt or delivery points scheduled at 98% or more on the latest gas day, the agent ranked Transco first with 21 of 481 assessed points (4.4%), followed by Northern Natural Gas (9), Eastern Gas Transmission and Storage (7), Texas Eastern (7) and National Fuel Gas Supply (6, the highest share at 7.7%). It opened Transco on the map and stated what the counts are: nominations at posted points, not metered flow or proof that a whole pipeline is constrained.
The agent's counts are receipt and delivery points, so they differ from the pipeline tool's, which also counts segment and other records: Transco's panel shows 24 of 483 for the same posting. Asked a follow-up about which power plants sit behind Transco's full delivery points, the agent found none that met the threshold, and said its plant-to-point links were candidates, not verified deliveries.
07
Pipeline maps by system
Each system opens directly on the map. The counts below are from the latest posting for the October 30, 2026 gas day and change with every cycle; the live US natural gas pipeline map ranks every system on its current posting.
- Transco pipeline map
- Tennessee Gas Pipeline map
- Northern Natural Gas pipeline map
- El Paso Natural Gas pipeline map
- Florida Gas Transmission pipeline map
- Texas Eastern pipeline map
- NGPL pipeline map
- Northwest Pipeline map
| Pipeline | Operator | Records ≥98% scheduled | Assessed records |
|---|---|---|---|
| Northwest Pipeline | Williams | 28 | 458 |
| Transco | Williams | 24 | 483 |
| Northern Natural Gas | BHE Pipeline Group | 11 | 397 |
| Texas Gas Transmission | Boardwalk | 11 | 212 |
| ANR Pipeline | TC Energy | 10 | 339 |
| National Fuel Gas Supply | National Fuel | 8 | 99 |
| Texas Eastern | Enbridge | 7 | 533 |
| Eastern Gas Transmission | BHE GT&S | 7 | 202 |
| Tennessee Gas Pipeline | Kinder Morgan | 6 | 591 |
| Columbia Gulf | TC Energy | 6 | 119 |
| Florida Gas Transmission | Energy Transfer | 5 | 222 |
| Southern Star Central | Southern Star | 5 | 258 |
| Gulf South | Boardwalk | 4 | 451 |
| El Paso Natural Gas | Kinder Morgan | 1 | 307 |
| Natural Gas Pipeline Co. of America | Kinder Morgan | 0 | 462 |
08
Natural gas pipeline map FAQ
- Is there a map of US natural gas pipelines?
- Yes. EIA publishes interstate and intrastate pipeline routes, and Ask the Grid's map combines them with OpenStreetMap transmission lines and colors each interstate system by its latest capacity posting.
- What is operationally available capacity?
- Operating capacity at a point minus the quantity scheduled through it, as the pipeline posts it for a gas day and nomination cycle.
- Does the map show actual gas flow?
- No. It shows scheduled nominations at posted points. Metered flow is not part of these postings.
- What is a gas day?
- The 24 hours from 9 a.m. to 9 a.m. Central time over which pipelines schedule and account for gas.
- Which pipelines are covered?
- 90 pipeline and storage systems from Kinder Morgan, Williams, Enbridge, TC Energy, Energy Transfer, Boardwalk, Tallgrass and other operators, plus PG&E's and SoCalGas's own daily operations on the California map.