California Cut Power to Limit Fire Risk as Santa Ana Winds Arrived
PG&E's shutoff peaked at 85,905 customers, with tens of thousands more affected in Edison's territory. The local disruption unfolded alongside routine conditions in the wider electricity market.
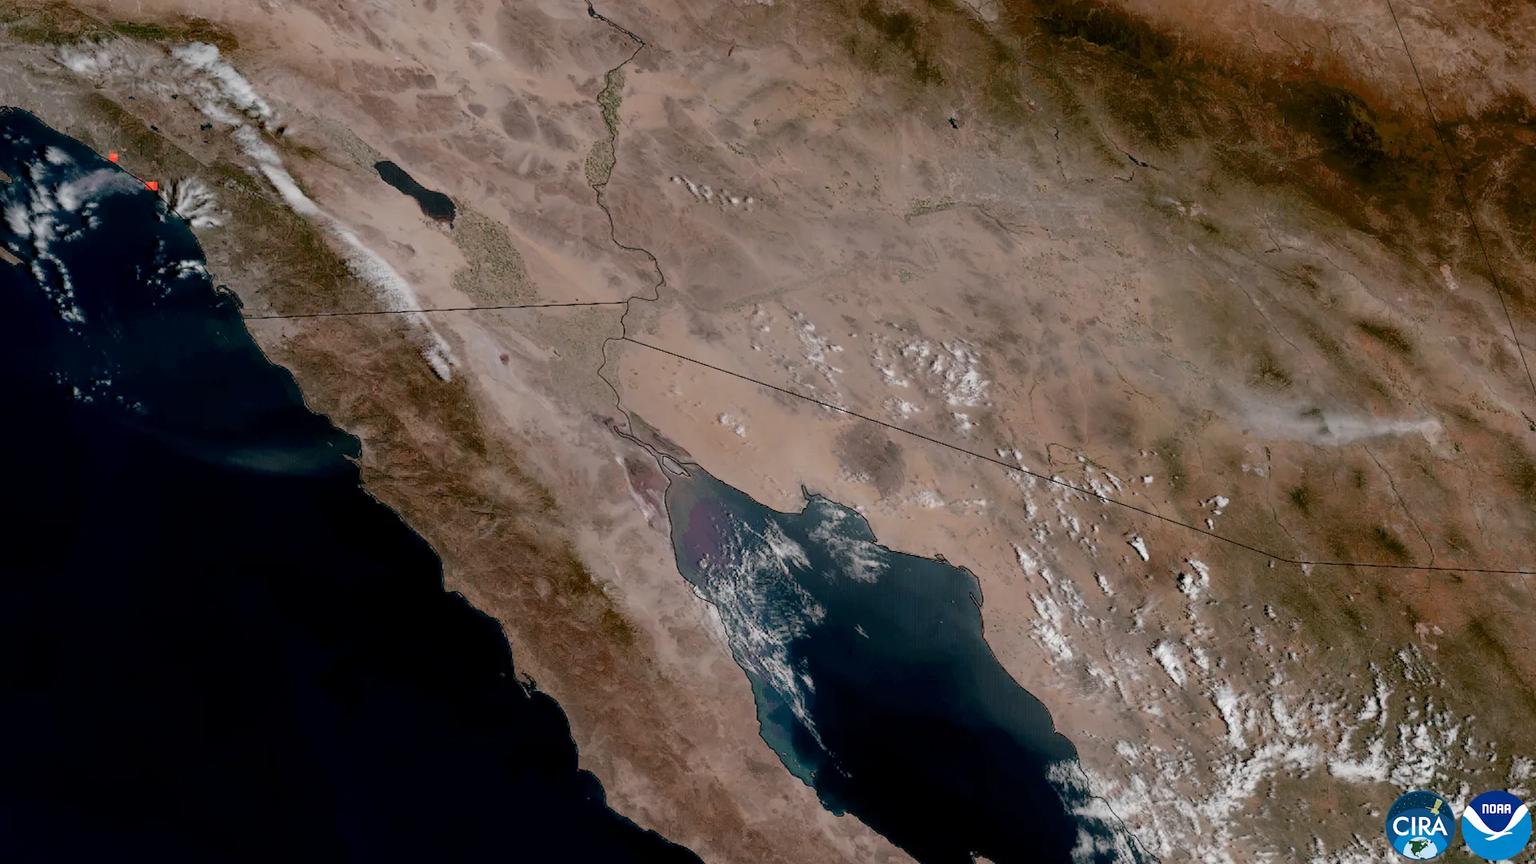
California utilities cut power to tens of thousands of customers as dry offshore winds raised wildfire risk from October 14 through 17. Pacific Gas and Electric's shutoff peaked at 85,905 customers across 29 counties at 8 a.m. Friday, October 16. Southern California Edison had another 69,746 customers without power at 7 a.m., according to figures it provided to FOX 11 Los Angeles.
The utilities used Public Safety Power Shutoffs (PSPS) to reduce the chance of electrical equipment starting a fire. For affected households, the consequences included dark traffic signals, prolonged outages and the need for community resource centers. At the same time, CAISO's load relative to forecast and wholesale hub prices remained within the range of the surrounding days. The event illustrates how severe local disruption can coexist with routine conditions in the wider electricity market.
Dry air made the winds dangerous#
PG&E described a dry offshore wind event beginning Wednesday evening, October 14. Farther south, a National Weather Service Red Flag Warning ran from 6 a.m. Thursday through 8 p.m. Saturday, with the strongest conditions expected Friday. Forecasters called for minimum humidity of 8 to 20 percent and poor overnight recovery, leaving vegetation exposed to sustained drying.
By Thursday, gusts above 70 mph had been recorded in the San Gabriel Mountains. The weather service said the Santa Ana winds had arrived with stronger speeds than expected; PG&E's meteorologists recorded gusts up to 67 mph in Northern California. The combination of wind and dry fuel shaped the utilities' decisions to de-energize exposed circuits.
Ask the Grid's analysis of one-day-ahead modeled weather forecasts shows that combination across the Southern California foothills. Average humidity in a box covering parts of Los Angeles, Ventura, Santa Barbara and Kern counties stayed between 23 and 35 percent from Wednesday afternoon into Saturday. The average forecast gust reached about 37 mph late Friday morning, with the strongest grid cell near 76 mph. Earlier in the week, October 11 and 12 had stronger average forecast gusts in the same area, but daily humidity averaged 64 and 71 percent.
The shutoffs followed the weather across two utility territories#
PG&E expanded its planned scope to about 88,000 customers by late Tuesday across portions of 29 counties. By Wednesday afternoon, that group included about 5,500 customers in its Medical Baseline program for households with medical needs. Power was then switched off in stages, reaching about 46,000 customers late Wednesday, 66,723 Thursday morning and 79,978 that evening before Friday's peak.
As conditions eased, crews began patrols in portions of 19 counties at 12:30 p.m. Friday. By 7:20 p.m. Saturday, PG&E said virtually all customers had been restored. The company reported finding damaged equipment and vegetation-related hazards during inspections, and opened more than 40 community resource centers across 25 counties during the event.
A customer's immediate surroundings could look calmer than the conditions that triggered the outage. PG&E spokesperson Jeff Smith told ABC30 that a circuit serving a home may pass through an area with heavier wind. The shutoff therefore follows risk along the electrical route, extending its effects beyond the places experiencing the strongest gusts.
Southern California Edison initially considered a much larger group for shutoffs: nearly 260,000 customers on Wednesday and roughly 220,000 on Thursday, according to KTLA. More than 63,000 had lost power by Thursday afternoon. FOX 11's Friday morning report put the count at 34,946 in Los Angeles County and 34,800 in Ventura County. By 7:41 a.m. Sunday, KTLA reported 1,391 customers still affected, mostly in Ventura County.
The difference between the warning pool and the eventual outage count reflects how the process works. Customers receive notice when their circuits are under consideration; power is cut as conditions warrant. Edison says it weighs strong winds, low humidity, dry vegetation and fire-danger forecasts using weather stations, modeling and field observations. In Malibu, officials identified four circuits that could be affected: Cuthbert, Galahad, Maguire and Merlin.
Local outages left a different signature from a grid emergency#
On October 16, CAISO system load averaged 3.8 percent above its day-ahead forecast, within a twelve-day stretch in which actual load exceeded forecast every day by 2.7 to 13.1 percent. SCE-area load averaged 14,771 MW, 10 percent above forecast, while PG&E-area load was 2.6 percent below. Those comparisons describe conditions across large service areas rather than the experience of individual disconnected circuits.
Wholesale hub prices were also within the range of the surrounding days. The NP15 real-time hub averaged $44.00/MWh on Friday and SP15 averaged $35.40/MWh. Wind generation averaged 3,842 MW, below the 4,103 MW daily average reached on October 11. A roughly $21/MWh North–South price gap had opened on October 14 and 15, beginning before Edison's shutoffs.
The distinction matters for interpreting the event. A preventive shutoff targets equipment exposed to fire weather, while a system emergency concerns the ability to keep supply and demand balanced across the grid. Aggregate load and hub prices describe that broader balance; utility event records show where customers lost service. A region can have adequate electricity supply while particular communities spend days without it.
The fire risk remained real#
Several fires started during the wind event. The Bryson Fire in Malibu began late Thursday and burned 146 acres. The Henderson Fire at Camp Pendleton reached 3,260 acres. Both were fully contained by CAL FIRE's October 19 updates. The Norte Fire, which began Friday in San Clemente and San Juan Capistrano, reached 570 acres and was 80 percent contained; CAL FIRE reported six homes damaged or destroyed. The agency listed the causes of all three fires as under investigation.
The utilities were operating against a history of much larger shutoffs and destructive electrical fires. PG&E's October 9–12, 2019 event affected 728,980 customers in 35 counties. Edison's January 2025 event de-energized 363,196 customers, which the utility described in its CPUC report as its largest and most complex since the program began.
That history gained a further finding in August, when Los Angeles County Fire and CAL FIRE reported that the January 2025 Eaton Fire began with electrical arcing on an out-of-service Edison transmission tower. The fire killed 19 people and destroyed or damaged more than 9,000 homes and businesses. The finding forms part of the wider safety context in which California utilities make shutoff decisions.
October's interruptions imposed their own costs. Simi Valley instructed drivers to treat dark traffic signals as four-way stops, while Moorpark residents entered a second day without power. The next formal accounting will be the utilities' public post-event reports to the California Public Utilities Commission, required after de-energization events under Resolution ESRB-8. Those reports give regulators a record against which to assess the decisions and the restoration effort.
Sources and method#
PG&E customer counts and restoration times come from its timestamped event updates. Edison counts are attributed to local outlets reporting the utility's figures and retain their reporting times. Fire acreage, containment and status are from CAL FIRE's October 19 updates. Times in the event chronology are Pacific.
Ask the Grid's weather analysis uses one-day-ahead Open-Meteo forecasts on a 0.25-degree grid over the Southern California foothills; these are modeled conditions. Load comparisons use actual and day-ahead forecast daily averages by Pacific date. Wind generation comes from the CAISO balancing-area series, and prices are real-time hub averages. The analysis covers October 7–18, with reporting through October 20. Explore California on the live map.