PJM Called Emergency Demand Response During Maintenance Season
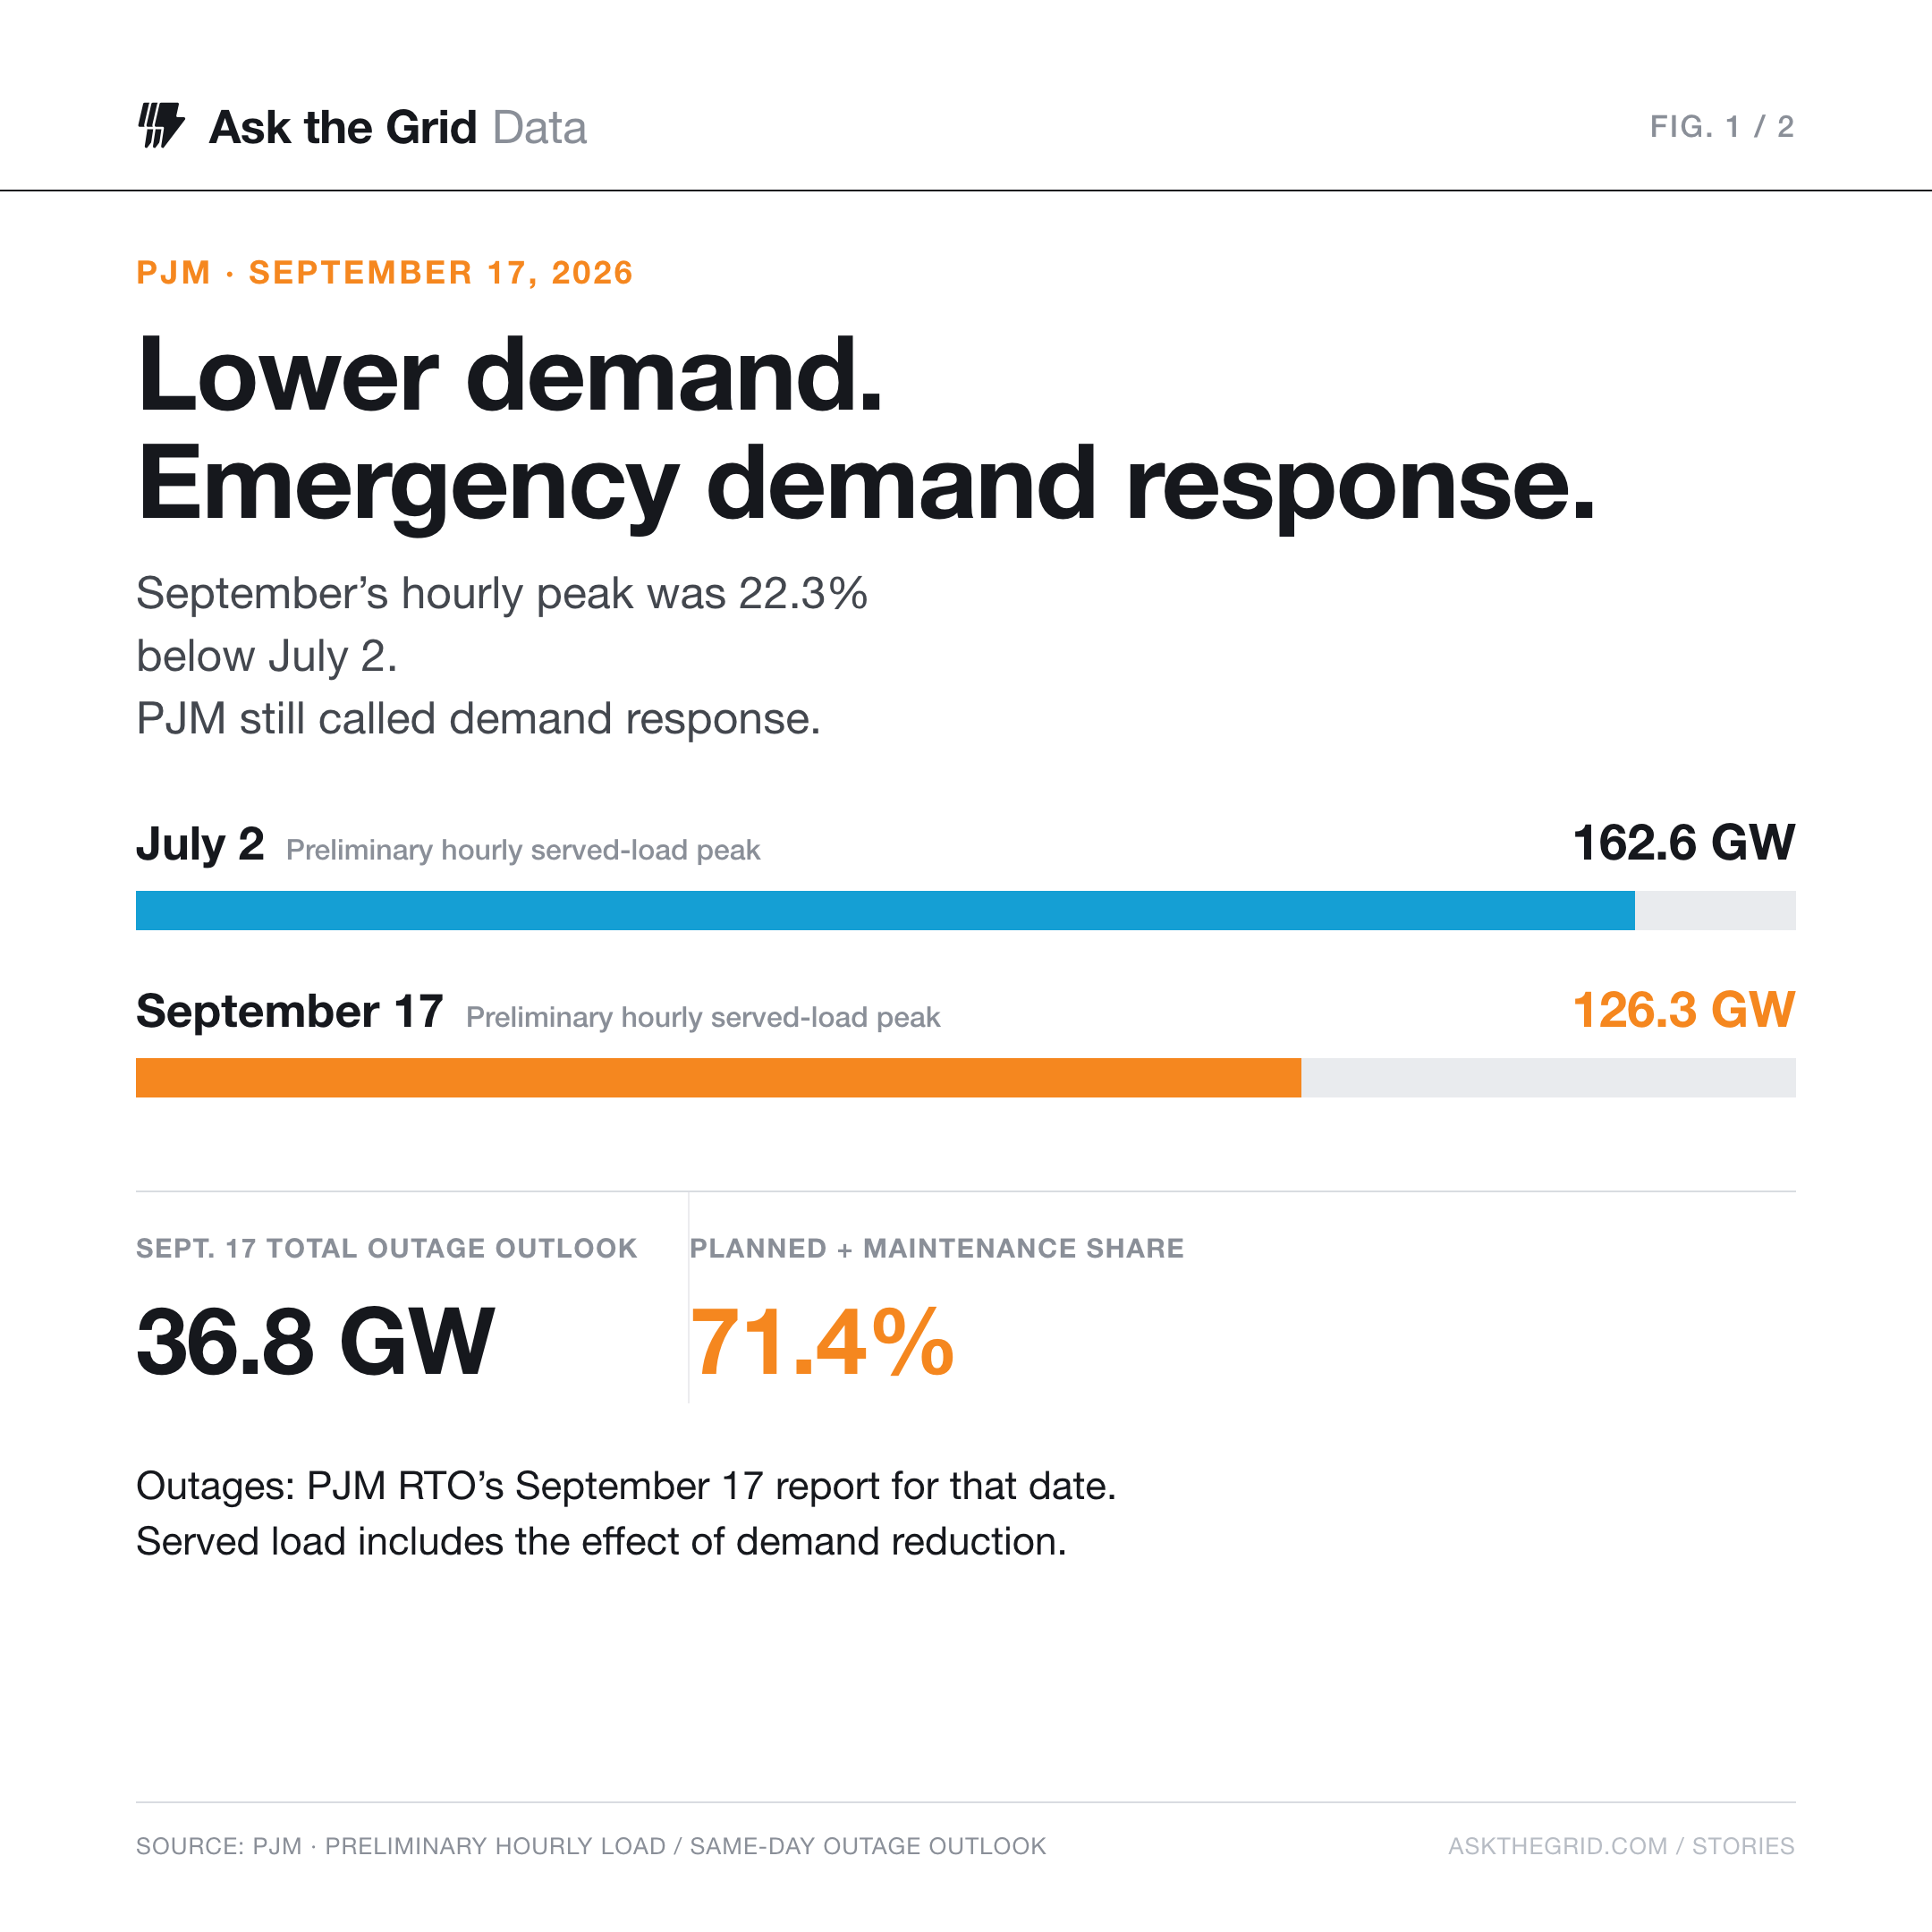
September 17’s preliminary hourly load peak was 22% below July 2. Maintenance-season outages and transmission limits left PJM calling demand response, while BGE’s hourly real-time price reached $1,765/MWh.
PJM called emergency demand response on September 17, 2026, on a day when its preliminary hourly served load peaked at 126.3 GW. That was 22.3 percent below July 2, measured with the same hourly series. By the hour beginning 7 p.m. Eastern, the BGE zone’s verified real-time electricity price had reached $1,764.60/MWh.
The system available to meet September’s demand was different from the one that met July’s heat. PJM’s same-day generation outage outlook totaled 36.8 GW, including 26.3 GW classified as planned or maintenance outages. Its federal emergency application described transmission limits, export obligations and a forecast reserve shortfall. An unexpected generator outage on the morning of September 17 added another problem before the evening peak.
The operating lesson is in that combination. A regional demand figure needs to be read alongside the generation available that day and the network’s ability to deliver it. September’s lower demand still produced an emergency response and a pronounced evening price increase.
Demand below July, more generation out of service#
The preliminary hourly series reached 126,343 MW in the 5–6 p.m. Eastern hour on September 17, compared with 162,569 MW in the same hour on July 2. The September peak was also slightly below the previous day’s 127,729 MW. These figures measure electricity actually served, including the effect of any demand reduction; they do not reconstruct what demand would have been without the response.
The outage outlook shows why the seasonal comparison matters. In the September 17 report for that date, PJM listed 18,649 MW of planned outages, 7,610 MW of maintenance outages and 10,523 MW of forced outages. Planned and maintenance work together made up 71.4 percent of the total. The equivalent July 2 report contained no planned outages and only 719 MW of maintenance outages.
| Measure | July 2 | September 17 |
|---|---|---|
| Preliminary hourly served-load peak | 162,569 MW | 126,343 MW |
| Hour beginning, Eastern | 5 p.m. | 5 p.m. |
| Same-day total generation outage outlook | 16,043 MW | 36,782 MW |
| Planned outages | 0 MW | 18,649 MW |
| Maintenance outages | 719 MW | 7,610 MW |
| Forced outages | 15,324 MW | 10,523 MW |
These are daily outlooks, each taken from the report bearing the target date. They establish the different outage mix available to planners, rather than an exact measurement of unavailable generation at 5 p.m. September’s report totaled 36,782 MW; PJM’s separate operating update described approximately 36,000 MW remaining after it recalled or canceled outages where possible.
At noon on September 17, PJM still forecast a peak of approximately 132,000 MW. That forecast and the subsequently measured 126,343 MW answer different questions. Subtracting them would not establish how much demand response delivered: weather, forecast error, customer behavior and curtailment can all affect the difference.
The eastern zones faced a delivery constraint#
In its September 16 application to the Department of Energy, PJM forecast it would be approximately 700 MW below its reserve margin on September 17. The filing also identified restricted north-to-south transfers on the Conastone–Peach Bottom 5012 500 kV facility, with conditions most acute in BGE, Pepco and Dominion. PJM reported that transmission overloads had already required loading relief on September 15.
That filing supplies a physical explanation for why location mattered. Additional generation elsewhere in PJM could help only within the network’s transfer limits. On September 17, PJM reported calling pre-emergency demand response across much of the footprint and additional emergency demand response in the BGE, Pepco and Dominion zones.
A supplemental letter submitted that morning added that a generation facility supporting the affected zones had unexpectedly gone offline, with its return by the evening peak uncertain. The public letter did not name the facility or give its capacity. Its report establishes an additional contingency without allowing the outage to be assigned to a particular plant.
The highest prices came after the load peak#
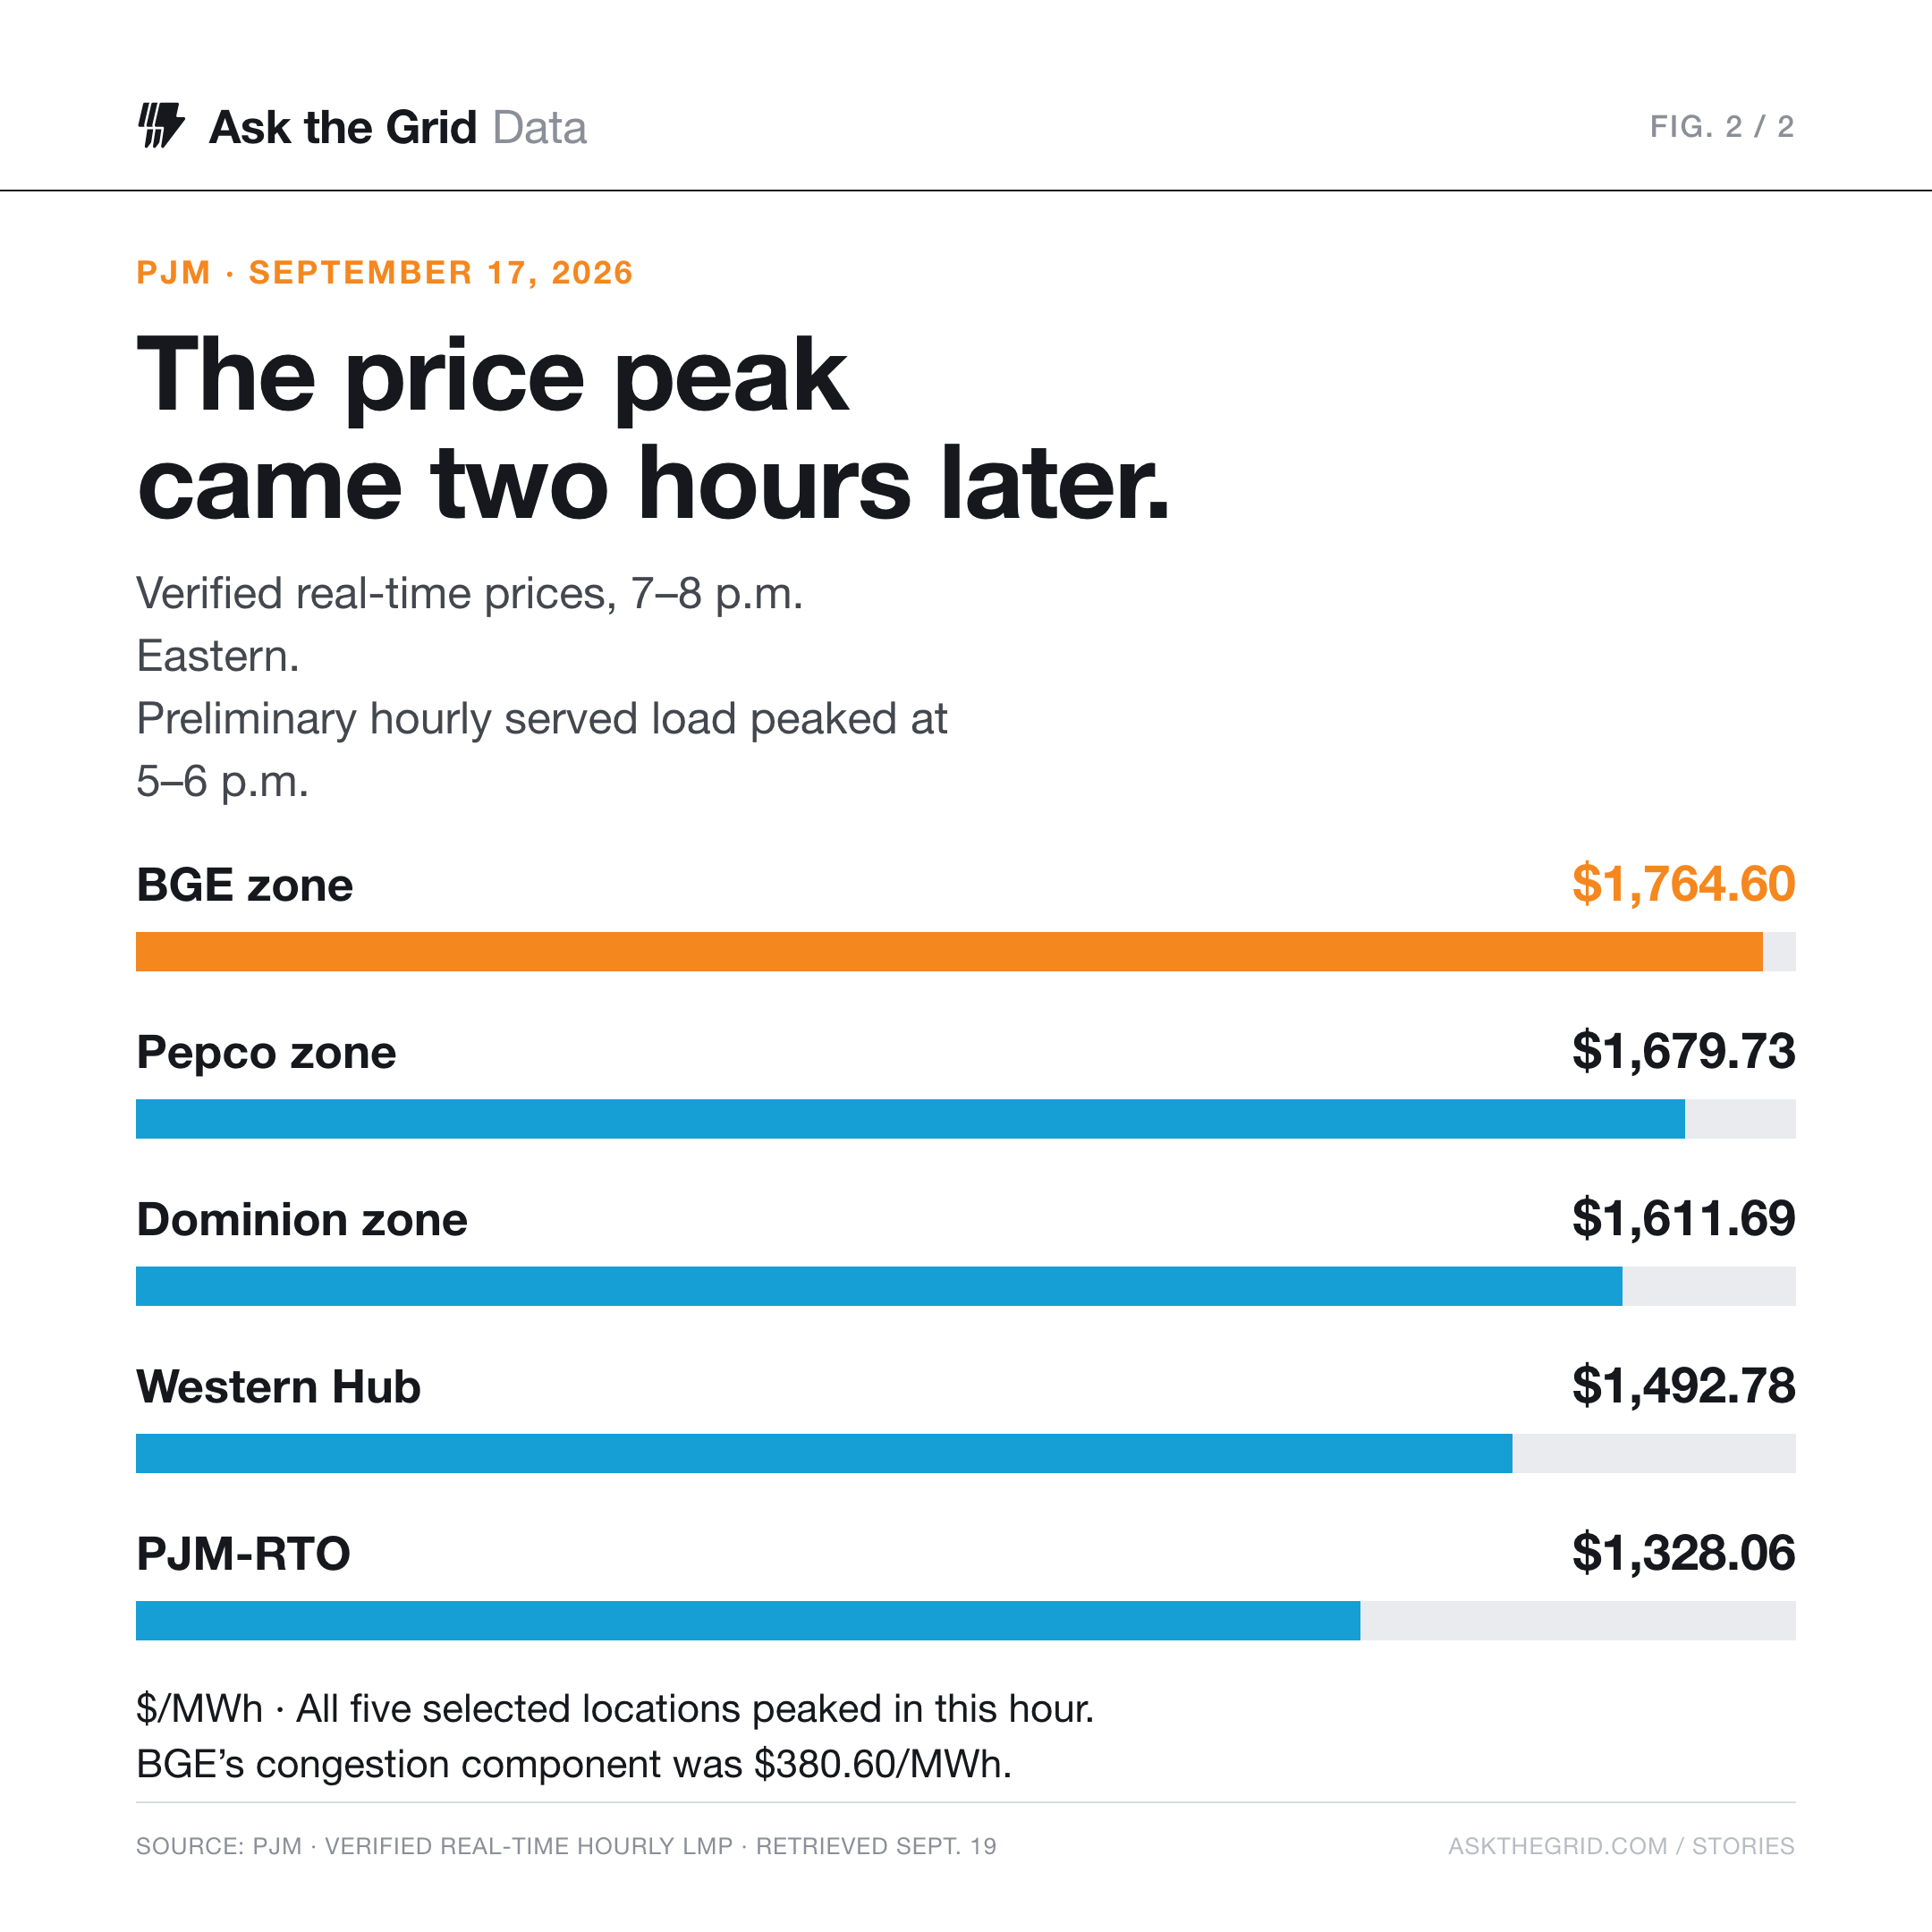
All five locations in this comparison reached their highest verified hourly real-time prices in the 7–8 p.m. Eastern hour, two hours after the served-load peak. BGE reached $1,764.60/MWh, Pepco $1,679.73/MWh and Dominion $1,611.69/MWh. Western Hub reached $1,492.78/MWh, while the PJM-RTO reference reached $1,328.06/MWh.
The price components separate a region-wide increase from the additional cost at particular locations. The common energy component was $1,324.05/MWh. BGE carried another $380.60/MWh in congestion and $59.95/MWh in marginal losses. Its premium over Western Hub was $271.81/MWh, of which $233.85/MWh came from the difference in their congestion components.
| Location | Total LMP | Energy | Congestion | Losses |
|---|---|---|---|---|
| BGE | 1764.60 | 1324.05 | 380.60 | 59.95 |
| PEPCO | 1679.73 | 1324.05 | 309.45 | 46.23 |
| Dominion zone | 1611.69 | 1324.05 | 246.47 | 41.17 |
| WESTERN HUB | 1492.78 | 1324.05 | 146.75 | 21.99 |
| PJM-RTO | 1328.06 | 1324.05 | 3.01 | 1.00 |
The congestion component confirms that transmission conditions contributed to the geographic price separation. PJM’s application names a relevant transfer limitation, but an hourly price decomposition cannot attribute the entire spread to that single facility. The large common energy component also shows that the evening price increase extended beyond the three eastern zones.
Supply was changing while demand receded. PJM’s operating snapshots put solar at 10,513 MW at 2 p.m. Eastern, falling to 415 MW at 7 p.m. Oil output reached its daily snapshot high of 2,978 MW at 7 p.m., while gas measured 63,044 MW. Wind was 826 MW at that time.
Between the 5 p.m. and 7 p.m. observations, preliminary hourly served load fell by about 3.9 GW, while the solar snapshots fell by 6.8 GW. Those series have different measurement conventions, so their difference is not a reserve calculation. Together they show why declining total demand did not by itself end the evening supply challenge.
What the federal order authorized#
DOE Order 202-26-45, effective September 17–18, allowed specified generators to operate as needed under emergency relief from operating limits. It separately authorized backup generation as a last resort before an Energy Emergency Alert Level 3, or during that level. The order required reporting of resources that actually operated using its allowances.
PJM’s demand-response call is documented. Whether a specific data center transferred to backup under the separate federal authority requires an activation or operating record. Neither the order’s issuance nor the rise in PJM’s oil-generation category establishes that fact.
The next evidence to watch is PJM’s event review and the operating reports required by DOE: measured demand-response performance, actual use of permit relief, and any backup-generation activation. Those records can establish how much each intervention contributed. The hourly market record already shows that maintenance-season demand deserves its own operating comparison, with outage mix and transmission availability alongside the load forecast.
Data and method#
Figures were retrieved September 19, 2026. Load uses the latest preliminary PJM hourly series, summed across ten nonoverlapping load areas, for July 2 and September 14–18. The peak comparison uses the maximum hourly value on each date. Outage comparisons use the July 2 and September 17 report-date/target-date pairs for PJM RTO, preserving planned, maintenance and forced categories.
Prices use PJM’s verified real-time hourly feed, deduplicated before selecting BGE (51292), Pepco (51298), Dominion zone (34964545), Western Hub (51288) and PJM-RTO (1). All five have 24 hourly observations on September 17. Prices and load are labeled by hour beginning in America/New_York; generation is an operating snapshot taken hourly. Charts are frozen at retrieval. The interactive map has its own interval series and may reflect subsequent revisions.
Continue with PJM’s July 2 demand peak, the different reliability roles of Wagner and Eddystone, or explore the PJM grid.
Share this story#