The $65 Million Grid Estimate That Ended a Massachusetts Battery Project
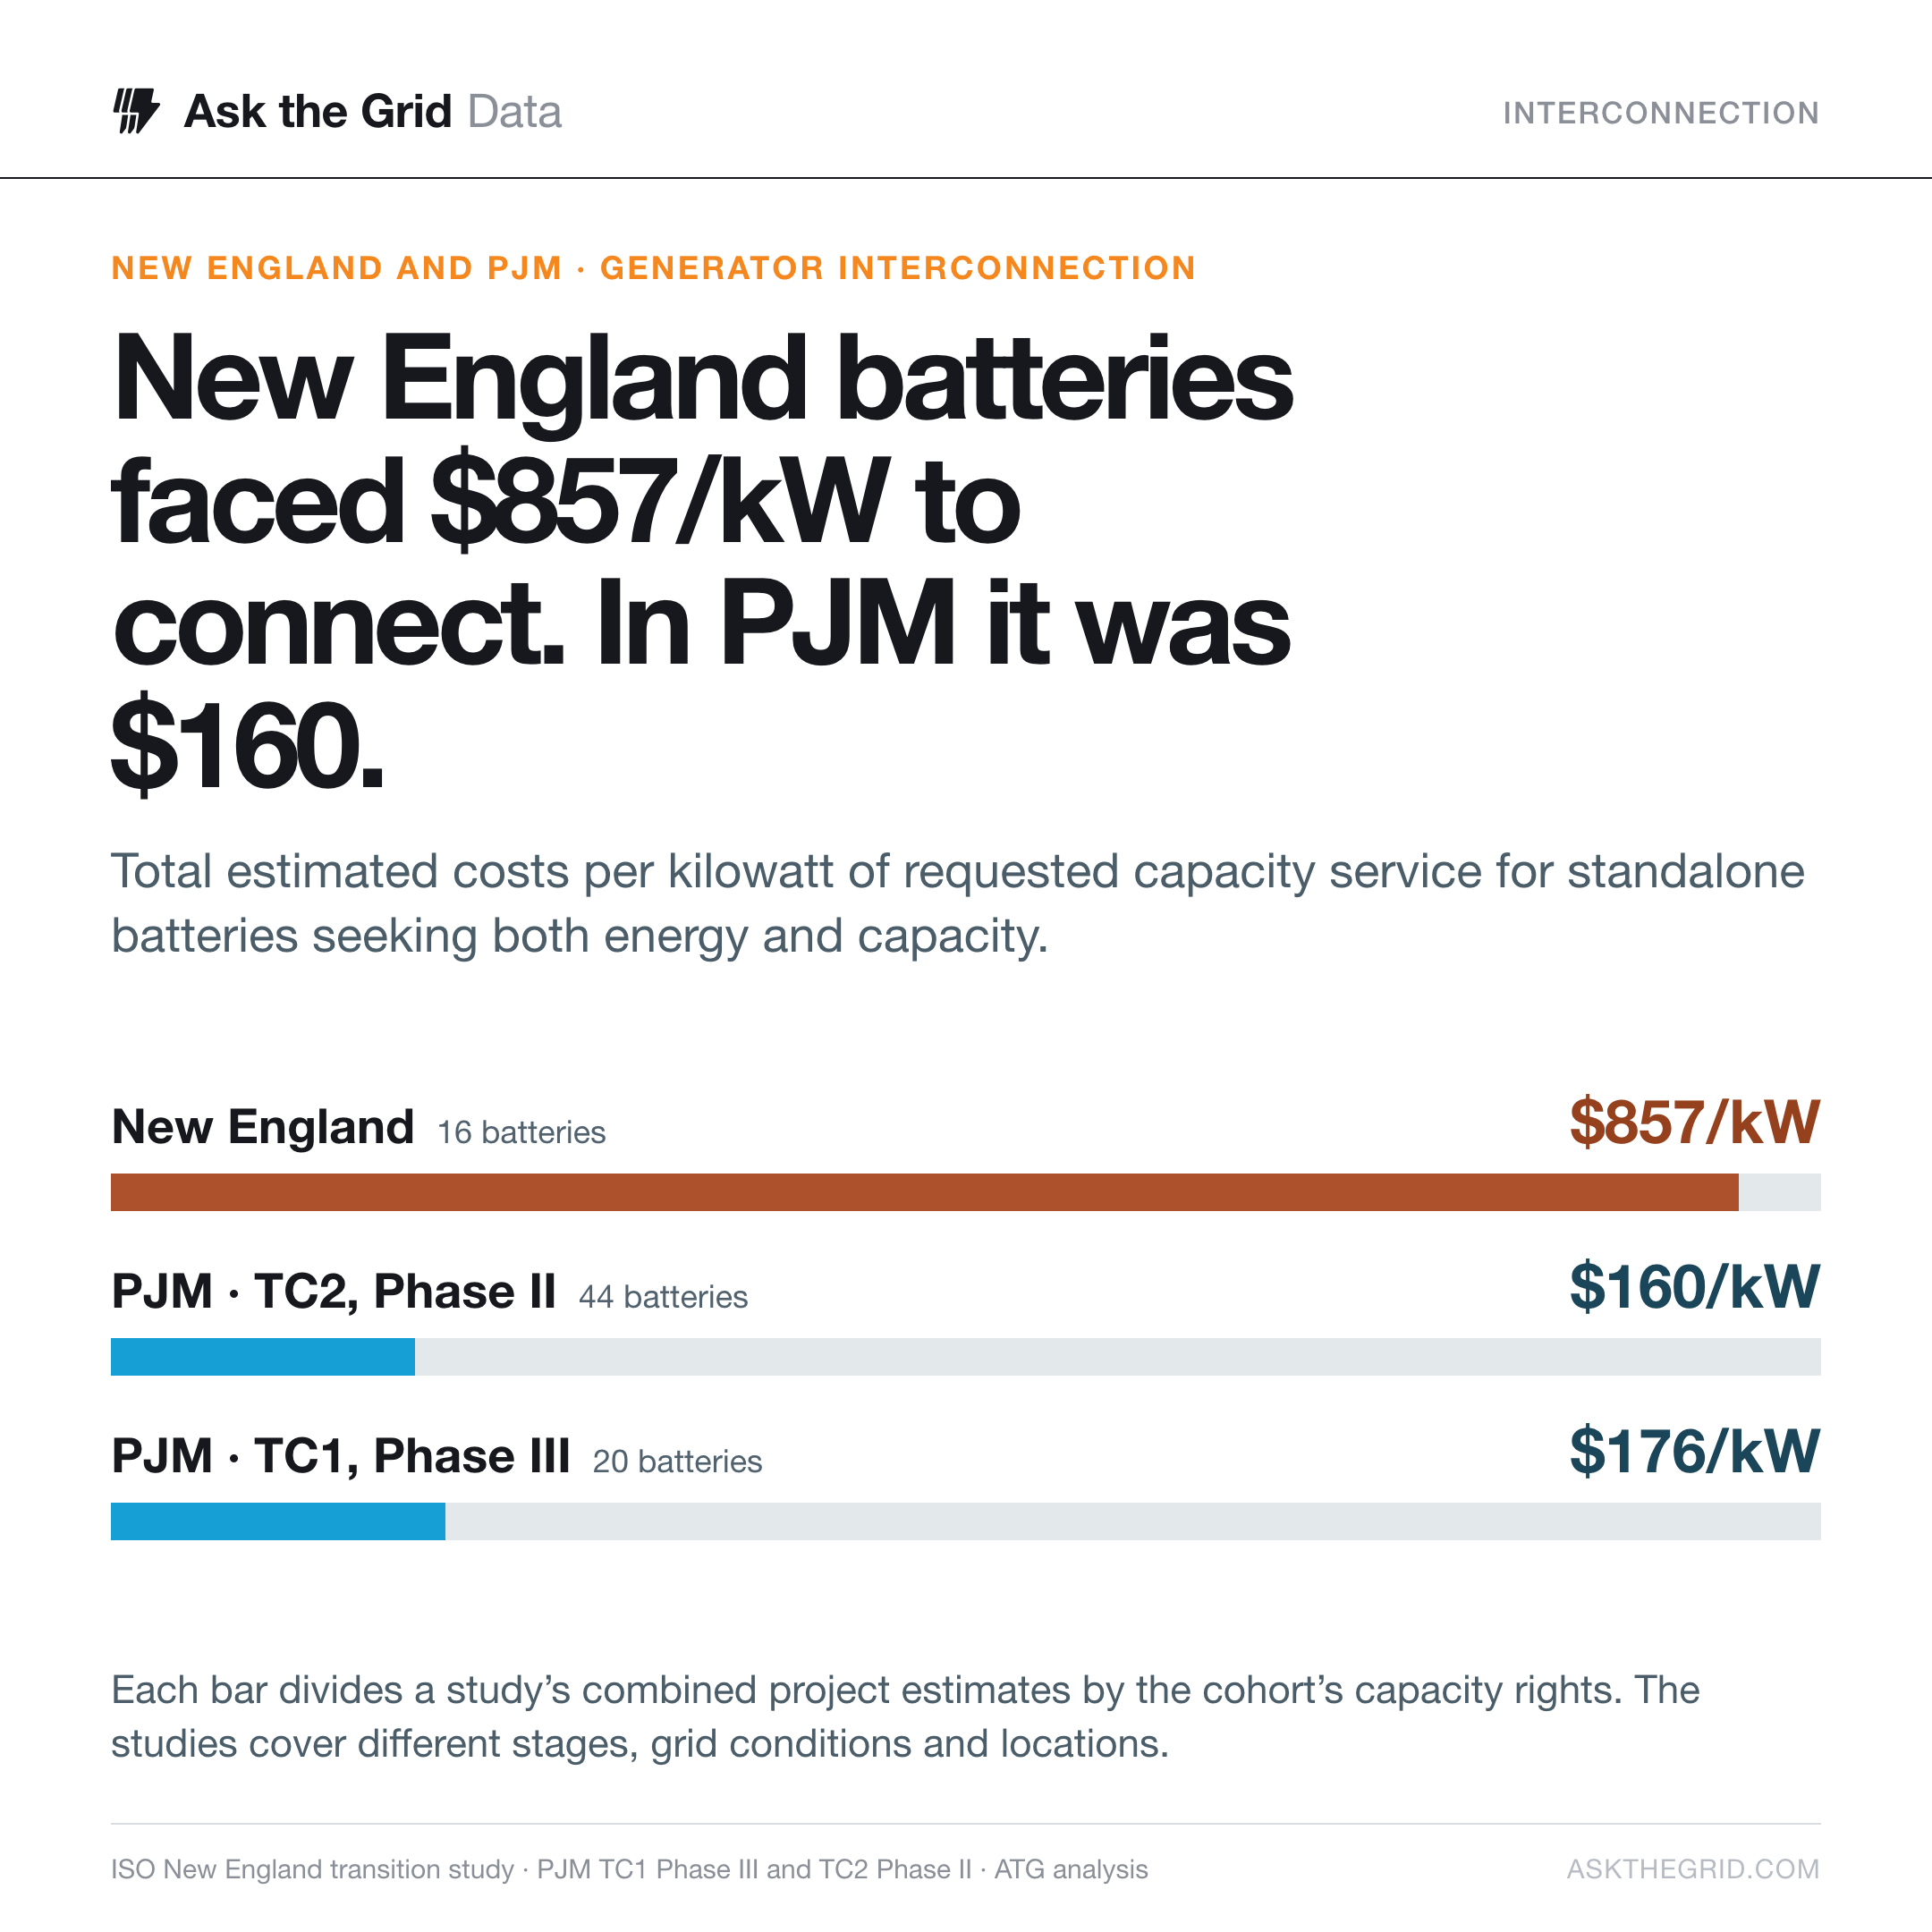
Tewksbury’s developer walked away at $523 per kilowatt. The average for 16 New England batteries was $857. Across 44 PJM proposals seeking similar service, it was $160.
On August 27, the company planning a battery in Tewksbury, Massachusetts, asked the state for more time to answer questions about its project. Five days later, its lawyers asked the state to close the case. The regional grid operator had worked out what it would cost to connect the battery. Hillman Energy Center had seen the number. Hillman’s motion, p. 2
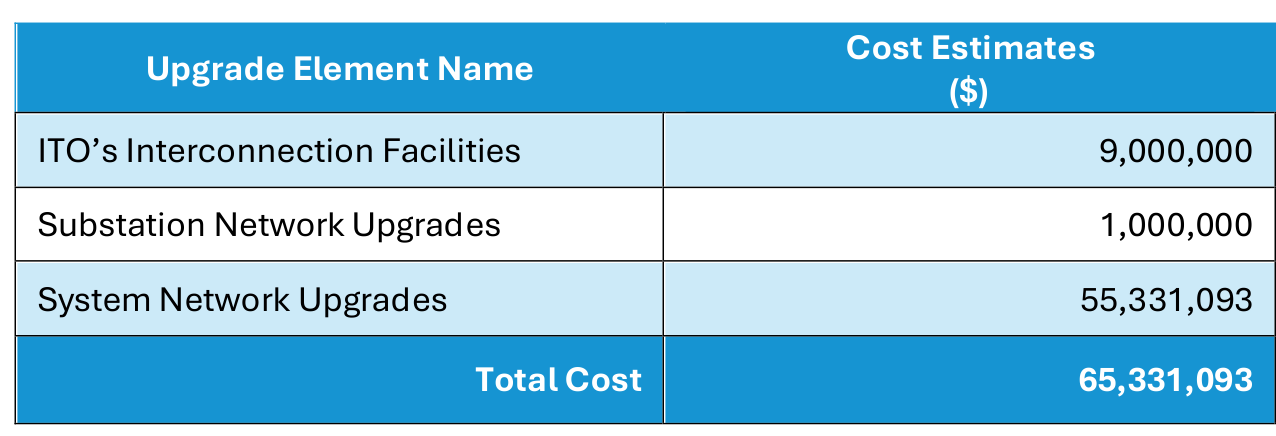
It was $65,331,093. The first $9 million was for the transmission owner’s equipment to connect the battery. Another $1 million was for substation work. The remaining $55.3 million bought improvements to the wider grid. East Point Energy, the developer, told WBUR that the total was more than three times what it had expected. WBUR’s reporting
For a 125-megawatt battery, that came to $523 per kilowatt. Ten of the fifteen other batteries in the same study faced a higher price per kilowatt. The 16 New England batteries seeking both energy and capacity service faced $857 per kilowatt between them. For 44 batteries seeking both services in PJM’s second transition study, we found $160. The 80 battery proposals in our comparison
Where PJM put the bill#
A grid connection buys a battery the chance to sell electricity. For a battery to earn capacity rights, the operator must be able to count on its power reaching customers under the conditions it plans for. We compared the dollars assigned to batteries with the kilowatts of capacity rights their developers asked for. Even PJM’s first group, which was further through engineering, came in at $176 per kilowatt. Each study estimated what developers would have to spend to connect their batteries. PJM’s first study · Second study
How much of the gap survives a change of benchmark?
Start with batteries seeking both energy and capacity service. Switch the comparison to see how much the answer depends on which projects enter the calculation.
Total assigned cost divided by all requested capacity-service kW in each cohort. Both PJM samples exclude hybrids and requests seeking only one service.
16 requests · $3,043.4 million · 3,552.6 MW of capacity rights. Study
44 requests · $819.8 million · 5,122.3 MW of capacity rights. Study
20 requests · $185.8 million · 1,057.32 MW of capacity rights. Study
New England’s estimate was 5.4 times PJM’s Phase II figure for batteries. The two systems studied different locations, grid investments and stages of design.
The historical values are Berkeley Lab’s simple project means in 2022 dollars. The recent benchmarks have different cost scopes and study stages.
PJM offers an unusually clear view of how that price can change. Between two rounds of its second study, the cost of network upgrades on the applicants’ side of the ledger fell $8.7 billion. Some 180 projects had dropped out. But PJM credited most of the decline to transmission work its board had approved in February for other regional needs. Some of the work a new plant might once have triggered was getting built anyway. A developer could receive a much smaller estimate even while the region was spending money on the grid. PJM’s account of the $8.7 billion change
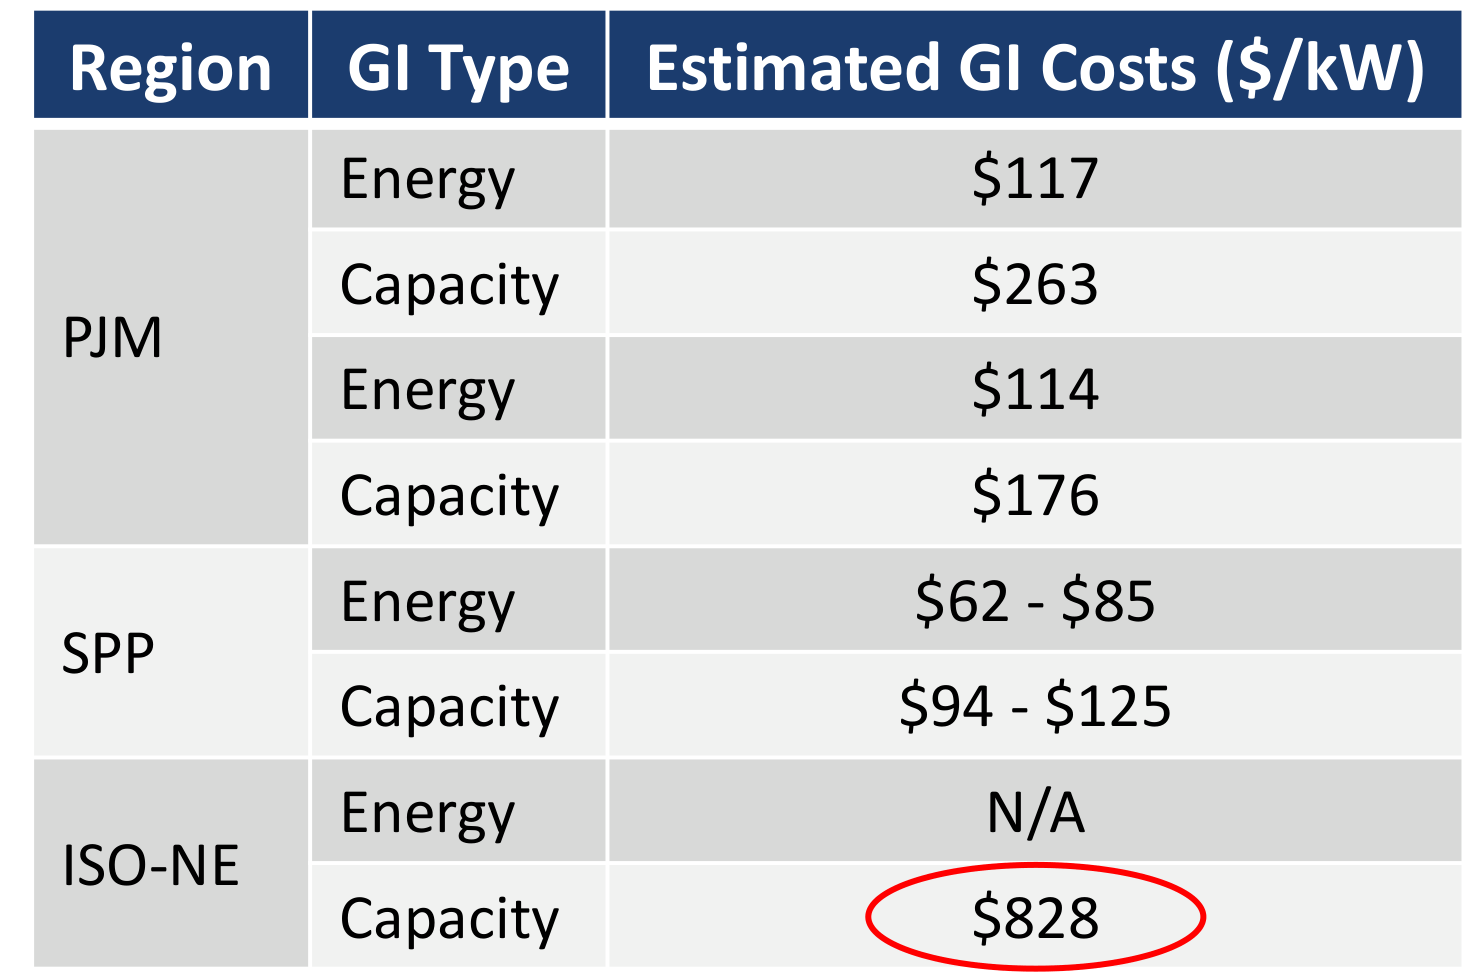
That matters when reading the table T. Bruce Tsuchida of The Brattle Group presented at a federal workshop in November. The much-circulated $828 in the bottom row is real. We get within three cents of it by taking the original $3.174 billion for the 18 New England projects newly studied for both services, including two solar projects, and dividing by their 3.83 million kilowatts. The Southwest Power Pool’s $94–125 range, meanwhile, was a proposed contribution toward a regional portfolio. A developer there could still owe money for its own connection. SPP’s rate calculation, p. 18
Would the batteries run at noon?#
Tsuchida had a question about New England’s engineering assumptions. Why count on batteries to discharge alongside solar plants at full output? A battery owner can often earn more by buying power when sunshine makes it cheap and selling it later. Tsuchida’s discussion of the dispatch assumptions
We went back through every hour of New England’s reported solar and battery output in 2025. During the hour when batteries supplied their most power, 277 MW, solar was producing just 57 MW. At solar’s high of 959 MW, batteries supplied 7 MW. Lower the bar to half of each technology’s own recorded high and they cleared it together for nine hours out of 8,760. These were the plants operating across the region that year. No one had yet dispatched the proposed Tewksbury battery. Hourly generation records
How often did battery and solar output run high together?
Each threshold is a share of the highest hourly output that category actually recorded in New England in 2025. Change the threshold to see how often the two coincided.
9 of 8,760 hours met both thresholds
Battery output reached 138.5 MW in 174 hours. Solar reached 479.5 MW in 1,518 hours.
| Month | Battery | Solar | Both |
|---|---|---|---|
| Jan | 0 | 48 | 0 |
| Feb | 0 | 64 | 0 |
| Mar | 1 | 127 | 0 |
| Apr | 4 | 131 | 2 |
| May | 15 | 114 | 1 |
| Jun | 29 | 181 | 0 |
| Jul | 38 | 201 | 1 |
| Aug | 19 | 234 | 0 |
| Sep | 15 | 184 | 0 |
| Oct | 25 | 130 | 4 |
| Nov | 7 | 65 | 1 |
| Dec | 21 | 39 | 0 |
The bars compare monthly hours meeting both thresholds. EIA counts battery net generation and solar without integrated storage as separate categories. Pumped storage and generation reported as hybrid solar-storage have their own categories. Rooftop generation is typically outside the grid operator’s view. Net battery readings can be negative during charging. New England reported none below zero in this series.
Sources: EIA-930 coverage · fuel definitions · Download 8,760 hours (CSV)
Source: U.S. Energy Information Administration, Form EIA-930 via Ask the Grid. All 8,760 hours of 2025 in Eastern time, across the ISO New England balancing area.
The operator has a reason to study an hour the market seldom produces. In testimony filed with federal regulators, ISO New England’s Alan McBride explained that customers and existing generators had already paid for a grid that could deliver power under demanding conditions. Granting a new battery the right to deliver power cannot take that right away from a plant already connected. A developer free to discharge at any time makes a different promise to the grid than one willing to accept an enforceable limit. The public study gives no price for that second arrangement. McBride’s testimony, p. 51
Nor does the region’s electricity market put a price on that promise. Western and central Massachusetts accounted for $1.99 billion of the published connection estimates. Yet the transmission congestion component of the zone’s day-ahead price averaged just $0.27 per megawatt-hour in absolute terms over the year ending in October. That price tells us how readily electricity moved over the grid the region already had. The study had to reckon with the grid after the new batteries arrived. Zonal price records
What made wholesale prices differ?
Compare two load zones over the same market hours. Each bar shows how much one part of the day-ahead price contributed to the difference.
+$5.71/MWh difference
Right of zero raised the price in the destination zone. Left of zero lowered it.
Marginal losses accounted for 62% of the $5.71/MWh difference between Maine and Northeastern Massachusetts/Boston. Congestion accounted for 38%.
Source: ISO New England’s final day-ahead hourly prices. Each delivery hour has equal weight. Zonal prices average over many pricing points. Interconnection studies test the proposed resource at its connection point under future system conditions. Download monthly components for all eight zones (CSV).
ISO New England final day-ahead energy, congestion and marginal-loss components, averaged over matched hours in November 2025 through October 2026.
Thirteen projects leave the study#
There is a good case for making a developer pay for work its project creates. Otherwise customers can get a bill for someone else’s business decision. The harder case is on page 35 of the New England study. The operator describes an upgrade where the existing structures were too old to take the new conductor. Nearly the whole line would need rebuilding. How much of that bill would customers eventually have faced anyway? The study prices the rebuild. It gives no estimate for replacing the aging equipment on its original schedule. ISO New England’s final report, section 6.7
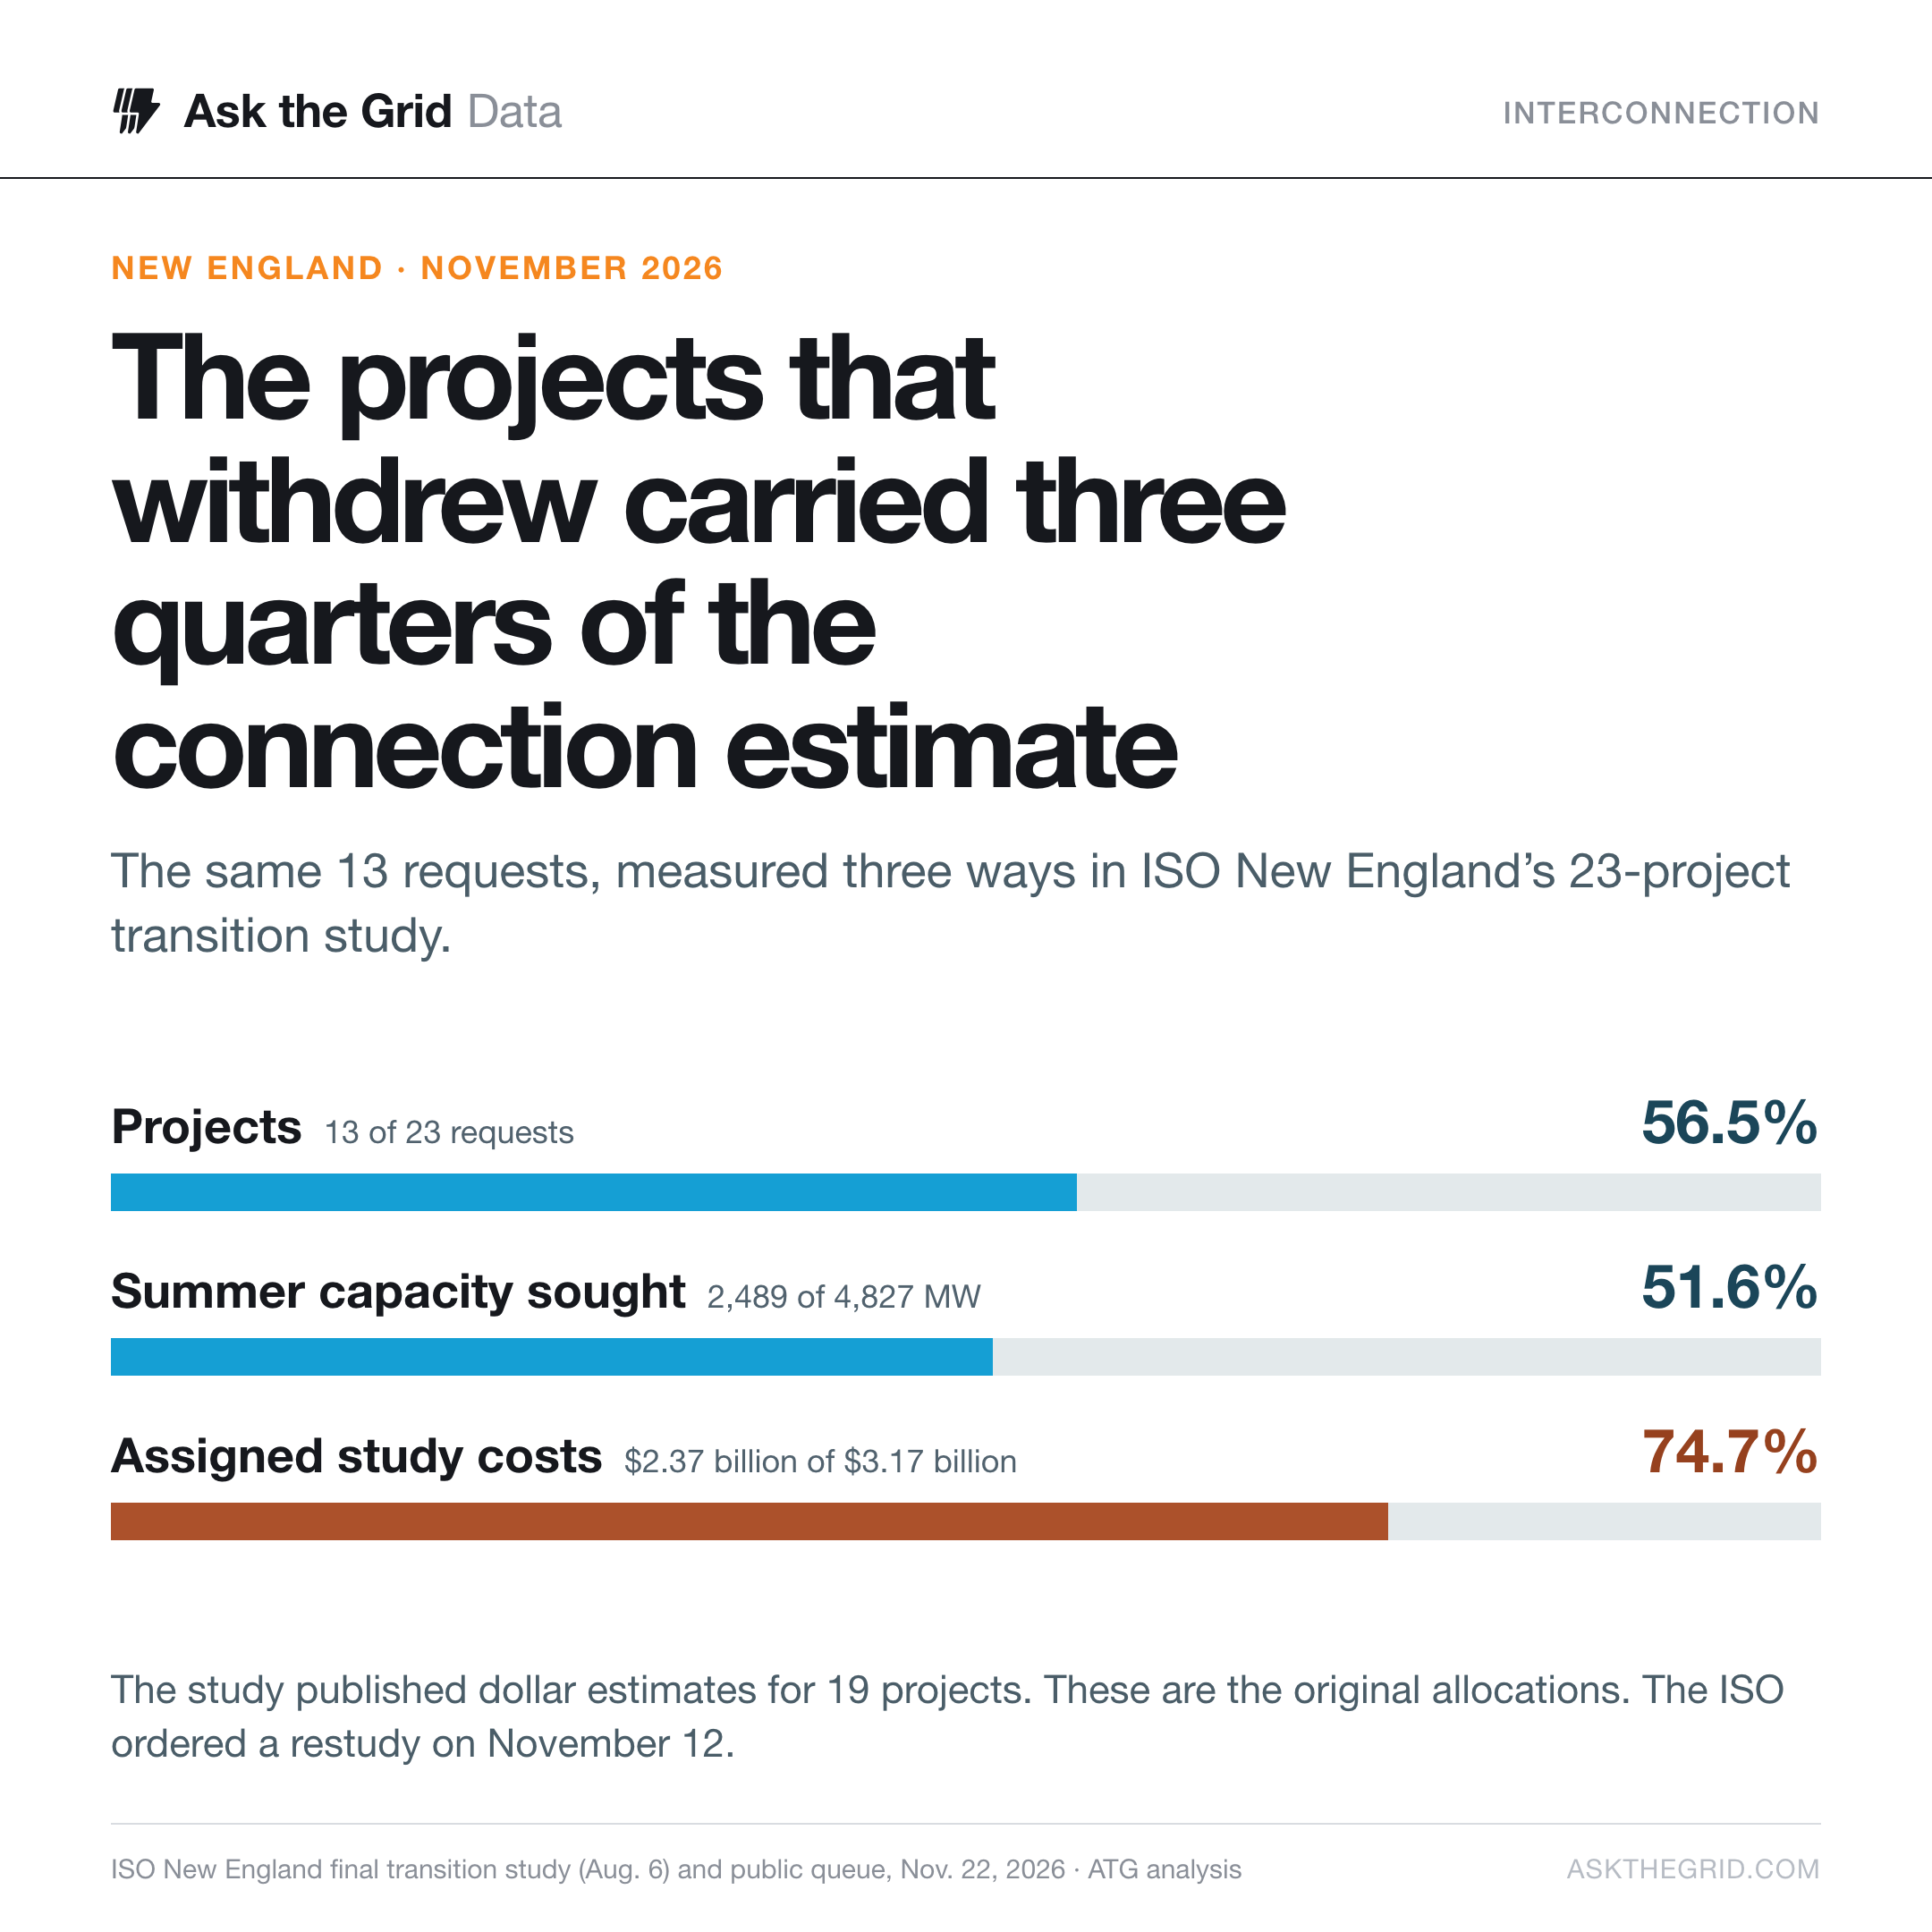
Tewksbury was one of 13 projects in the study that left the queue. Together they had been assigned $2.37 billion, three quarters of the costs the operator published. Their estimates averaged $952 per requested kilowatt. The five other projects seeking both services averaged $598. We know what drove the Tewksbury decision because its lawyers put the reason in writing. For the others, the queue records when they left. Original estimates and withdrawal dates
What happened to the projects in New England’s study
ISO New England studied 18 requests for both energy and capacity service. Five had already completed their energy studies.
Divide $3,173,515,346 in published estimates by 3,832,600 kW. All 18 requests in this group have numeric estimates.
Cumulative requests with a withdrawal date
13 of 18 requests had withdrawn by this date. They represented 2,488.6 MW of requested summer capacity service.
Source: ISO New England’s August 6 Transitional Cluster Study, Tables 1-1 and 9-1 through 9-22, and November 22 public queue. A missing estimate is recorded separately from a dollar amount. Download the 23 requests (CSV).
Original planning estimates and requested summer capacity, joined to public queue withdrawal dates through November 22, 2026.

The New England states credited the operator for finishing the study on schedule. What developers needed sooner, they wrote, was a reasonable idea of the cost while they still had time to change their plans. On November 12, ISO New England ordered a new study of the projects still in the queue. That second set of estimates will show which upgrades are still needed now that Tewksbury and a dozen others have gone. It comes too late to change the answer Hillman gave Massachusetts on September 1. States’ comments · The November 12 restudy decision
How we compared the projects
For the battery comparison we selected standalone storage requesting both energy and summer capacity service, then divided each cohort’s total estimated connection cost by the sum of its requested capacity-service kilowatts. New England’s 16 projects account for $3.043 billion and 3,552.6 MW. PJM’s second group accounts for $819.8 million and 5,122.3 MW, and its earlier group for $185.8 million and 1,057.32 MW. These studies cover different grid conditions and stages of engineering. Project-level comparison · Official New England study archive
We matched the August report’s 23 queue IDs to the November 22 queue. Nineteen had numeric cost estimates totaling $3.174 billion. Four had no published number. Five projects had already been studied for energy, and two of the 13 withdrawals predated the final report. The operating comparison uses hourly EIA-930 readings for batteries and solar reported separately by New England’s balancing authority, excluding pumped storage and hybrid solar-storage. The price comparison uses 8,760 matched hours of final day-ahead zonal prices between November 2025 and October 2026. Queue data · Regional output · Price data