SPP Advances a $23.7 Billion Grid Expansion as Congestion Costs Rise
Six more 765-kV projects would extend a regional backbone. Persistent price gaps strengthen the case for investment, while load forecasts and cost allocation shape its scale.
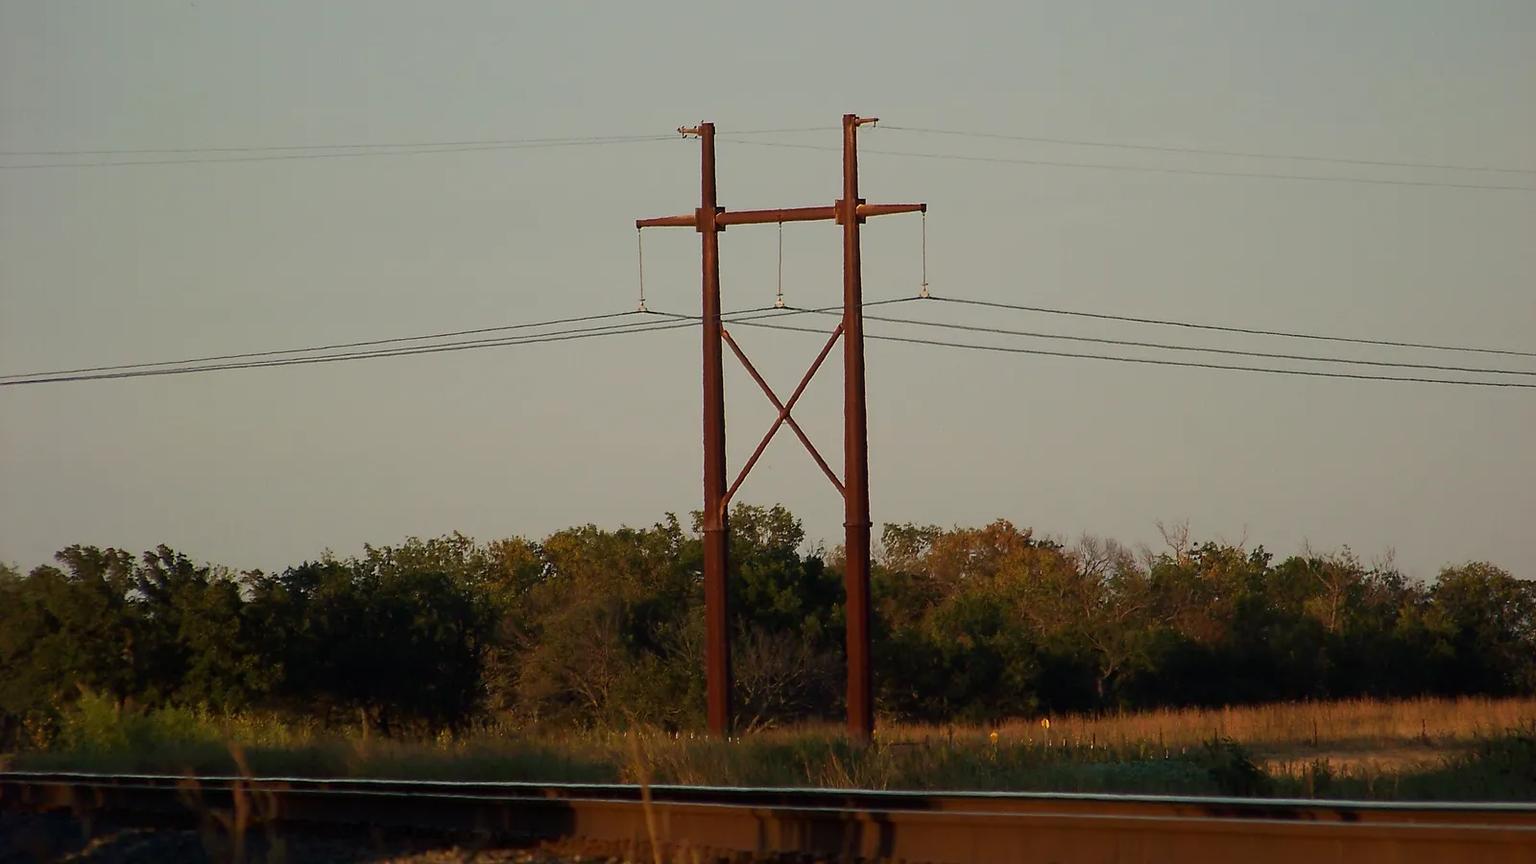
Southwest Power Pool is moving toward a $23.7 billion transmission expansion as congestion makes it increasingly expensive to move electricity across its region. The grid operator's Markets and Operations Policy Committee has endorsed a plan containing six additional 765-kilovolt projects, RTO Insider reported on October 19. SPP's published calendar schedules the Board's final approval vote for November 17.
The proposal, developed through SPP's 2026 Integrated Transmission Planning (ITP) study, would extend a high-voltage backbone intended to connect generation with growing demand. SPP puts annual net congestion costs at $1.9 billion in 2024, up from $457 million in 2019. Ask the Grid's analysis of day-ahead prices shows how that pressure reaches the market: the average magnitude of the congestion component at both SPP hubs was about four times higher in 2024 than in 2019, and large price gaps between the North and South hubs have persisted into 2026.
That establishes a problem the expansion is meant to address. The investment decision also turns on how much new demand arrives, how a regional backbone works alongside local upgrades, and how its costs are shared. SPP is planning for tens of gigawatts of additional load by 2035, a much faster increase than its historical peak-demand record.
Congestion has become a persistent cost#
Congestion arises when transmission limits prevent the market from serving demand with the least expensive available generation. The congestion component of a location's price captures that constraint's effect on electricity delivered there; a larger positive or negative component means location matters more to the price.
At SPP's North hub, the annual average absolute day-ahead congestion component rose from $1.90/MWh in 2019 to $7.87/MWh in 2024. At the South hub, it rose from $1.95 to $7.92/MWh. These hourly price measures provide a separate view of the pressure described in SPP's net congestion cost figures, which combine day-ahead and real-time market results.
The series also shows why a single year's spike would tell an incomplete story. Winter Storm Uri and high gas prices affected the market in 2021 and 2022, but congestion components remained elevated afterward. Through October 19, the 2026 averages were $7.50/MWh at the North hub and $6.78/MWh at the South hub, compared with roughly $2/MWh at each in 2019.
Price separation has become more frequent as well. North and South day-ahead hub prices differed by more than $20/MWh in roughly 100 hours a year from 2018 through 2020. That count reached 2,520 hours in 2022 and 1,251 in the first 7,008 hours of 2026. Across individual pricing nodes, 48 percent had an annual average congestion component outside plus or minus $5/MWh in 2025, compared with 2.4 percent in 2019, among nodes with more than 8,000 priced hours in each year.
SPP's own comparison holds fuel prices and energy demand at a similar scale: between 2019 and 2024, its cited gas benchmark fell from $1.93 to $1.81 per MMBtu while annual energy increased from 269 to 291 TWh. Over that period, net congestion costs more than quadrupled. The operator also reports that transmission emergencies increased from one in 2022 to 16 in 2025.
A regional backbone still needs local upgrades#
The generation mix has changed much faster than peak demand. Average wind output in SPP rose from 1.4 GW in 2011 to 12.6 GW in 2025. Over the same span, East-footprint peak load rose from 48.6 GW to 53.7 GW, reaching 56.7 GW in 2026. That changing balance makes the ability to move power between locations central to the transmission debate.
A 765-kV backbone is designed to carry large amounts of power over long distances. The market's binding limits, however, span both lines and local equipment. Over the twelve months through October 19, 1,130 real-time constraints carried a nonzero shadow price, the market's measure of the marginal value of easing a limit. Ranked by the sum of absolute shadow prices, the top ten accounted for 21 percent of activity and the top hundred for 63 percent.
Five of the ten highest-ranked constraints were transformers; transformer limits accounted for about a quarter of the total index. This helps explain why SPP evaluates the backbone together with lower-voltage upgrades. A long-distance line changes where power flows, while the connected network must be able to carry it. The benefits depend on the combined portfolio and the flows it produces.
In its September presentation, SPP gave the 2026 candidate 765-kV lines alone a conservative estimated benefit-to-cost ratio of 2 to 3 to 1. Staff had told the cost-allocation team in July that pairing 765-kV lines with lower-voltage upgrades raised the adjusted-production-cost benefit-to-cost ratio from more than 1.25 to about 8 to 1. Those are planning estimates for the configurations studied, and SPP expects economic-project ratios to change as projects are consolidated.
The size of the investment rests on the load forecast#
SPP presented two broad choices in September. A minimum build addressing base reliability needs would cost $8 billion to $10 billion. A larger portfolio, estimated at $15 billion to $25 billion, would add transfer capability and headroom for up to 40 GW of new load. The endorsed $23.7 billion plan falls within that larger range. RTO Insider reports a projected baseline value of $86 billion for the plan.
The scale is a step up from the roughly $8.6 billion portfolio approved in 2025, which included 50 projects and 949 miles of 765-kV line. SPP says its 2026 study identified nearly five times as many system needs as any previous plan, drawing more than 8,200 stakeholder-submitted solutions.
For 2035, SPP's base forecast adds 19 GW of firm load over 2025. Its two planning futures add another 11.6 GW or 17.9 GW of large “spot” loads, which SPP describes as additional high-confidence demand in or approaching study. The operator says about 60 percent of the larger spot-load figure is correlated with actual requests: 4.6 GW in agreements, 5.1 GW with studies complete, and 0.5 GW in study.
The historical comparison gives those assumptions their significance. East-footprint peak demand rose 12 percent between 2019 and 2026, from 50.6 GW to 56.7 GW. Tens of gigawatts of new load would mark a sharp acceleration. SPP points to an independent Evolved Energy Research forecast of 18.7 GW of new large load, about 60 percent from data centers, as support for the scale of its scenarios.
Modo Energy offered a more cautious reading in March. Its analysis put SPP's 2035 peak at 91 GW in Future 1 and 110 GW in Future 2, against the then-cited 56 GW record, and argued that actual growth would likely fall below operators' expectations. It described spot loads as survey requests that had yet to complete the interconnection process. The disagreement is consequential because the amount and location of new demand help determine the value of the lines.
The previous portfolio illustrates that sensitivity. SPP projected $12 to $18 of benefits per dollar invested in its 2025 plan; a staff memo to the Board reported about 3 to 1 under a low-load sensitivity. Construction estimates can change too: SPP's September deck showed the Elm Creek–Viola 765-kV line moving from a $1.92 billion conceptual estimate to $2.40 billion after transmission-owner input.
Who pays for growth#
Cost allocation determines how a regional investment reaches individual utilities and their customers. At its July meeting, SPP's cost-allocation team examined a hypothetical $35 billion overlay under three approaches: fully regional allocation, half based on peak load and half on energy, and half regional with the remainder assigned to the deliverability area containing the lines. The North area faced the greatest burden under the deliverability-area approach because it had higher transmission revenue requirements and less load and energy over which to spread them.
Members have argued for different principles. In February, an AEP representative said a focus on 765-kV facilities could be viewed as discriminatory, an Evergy representative cautioned against relying on speculative future benefits, and a Kansas commissioner favored charging long-term beneficiaries. Each position addresses a different exposure: which projects qualify, how confidently future savings can be counted, and who ultimately receives them.
Large new customers add another allocation question. In July's survey of 17 cost-allocation team members, 65 percent favored requiring large loads to bear both their interconnection costs and a share of regional portfolio costs. Some 88 percent supported making the transmission customer responsible for planned load even if that demand fails to materialize. Such obligations would place more of the risk of unbuilt demand on the customer requesting service.
FERC's June 18 show-cause orders on large-load integration put the issue into a broader regulatory process. SPP staff described a large-load delivery-point safe harbor as part of an anticipated November compliance filing. That process will run alongside the transmission decision as the region works out both the network it needs and the obligations attached to connecting new demand.
The next scheduled milestone is the November 17 Board vote. The congestion record gives directors a concrete reason to expand transfer capability; the load scenarios and allocation choices will determine how far the investment reaches and which customers carry its costs.
Sources and method#
The committee endorsement, $23.7 billion cost, six additional 765-kV projects and $86 billion projected baseline value are attributed to RTO Insider's October 19 report. Planning scenarios, cost estimates and benefit ratios are SPP's, from its September presentation and the cited staff materials.
Ask the Grid's market analysis uses SPP day-ahead hub and node prices, real-time binding constraints, five-minute load and generation mix. Hub congestion figures are unweighted hourly means of absolute congestion components. Node comparisons use each year's qualifying node set. Constraint rankings sum absolute shadow prices as an activity index. Load comparisons use the East balancing area and include historical footprint changes. The 2026 observations run through October 19. Explore SPP on the live map.